HilalimSBHilalimSB A Wedding Gift 🌙
HilalimSB - Revealing the Secrets of the Trend
HilalimSB is a powerful indicator designed to help investors analyze market trends and optimize trading strategies. Designed to uncover the secrets at the heart of the trend, HilalimSB stands out with its unique features and impressive algorithm.
Hilalim Algorithm and Fixed ATR Value:
HilalimSB is equipped with a special algorithm called "Hilalim" to detect market trends. This algorithm can delve into the depths of price movements to determine the direction of the trend and provide users with the ability to predict future price movements. Additionally, HilalimSB uses its own fixed Average True Range (ATR) value. ATR is an indicator that measures price movement volatility and is often used to determine the strength of a trend. The fixed ATR value of HilalimSB has been tested over long periods and its reliability has been proven. This allows users to interpret the signals provided by the indicator more reliably.
ATR Calculation Steps
1.True Range Calculation:
+ The True Range (TR) is the greatest of the following three values:
1. Current high minus current low
2. Current high minus previous close (absolute value)
3. Current low minus previous close (absolute value)
2.Average True Range (ATR) Calculation:
-The initial ATR value is calculated as the average of the TR values over a specified period
(typically 14 periods).
-For subsequent periods, the ATR is calculated using the following formula:
ATRt=(ATRt−1×(n−1)+TRt)/n
Where:
+ ATRt is the ATR for the current period,
+ ATRt−1 is the ATR for the previous period,
+ TRt is the True Range for the current period,
+ n is the number of periods.
Pine Script to Calculate ATR with User-Defined Length and Multiplier
Here is the Pine Script code for calculating the ATR with user-defined X length and Y multiplier:
//@version=5
indicator("Custom ATR", overlay=false)
// User-defined inputs
X = input.int(14, minval=1, title="ATR Period (X)")
Y = input.float(1.0, title="ATR Multiplier (Y)")
// True Range calculation
TR1 = high - low
TR2 = math.abs(high - close )
TR3 = math.abs(low - close )
TR = math.max(TR1, math.max(TR2, TR3))
// ATR calculation
ATR = ta.rma(TR, X)
// Apply multiplier
customATR = ATR * Y
// Plot the ATR value
plot(customATR, title="Custom ATR", color=color.blue, linewidth=2)
This code can be added as a new Pine Script indicator in TradingView, allowing users to calculate and display the ATR on the chart according to their specified parameters.
HilalimSB's Distinction from Other ATR Indicators
HilalimSB emerges with its unique Average True Range (ATR) value, presenting itself to users. Equipped with a proprietary ATR algorithm, this indicator is released in a non-editable form for users. After meticulous testing across various instruments with predetermined period and multiplier values, it is made available for use.
ATR is acknowledged as a critical calculation tool in the financial sector. The ATR calculation process of HilalimSB is conducted as a result of various research efforts and concrete data-based computations. Therefore, the HilalimSB indicator is published with its proprietary ATR values, unavailable for modification.
The ATR period and multiplier values provided by HilalimSB constitute the fundamental logic of a trading strategy. This unique feature aids investors in making informed decisions.
Visual Aesthetics and Clear Charts:
HilalimSB provides a user-friendly interface with clear and impressive graphics. Trend changes are highlighted with vibrant colors and are visually easy to understand. You can choose colors based on eye comfort, allowing you to personalize your trading screen for a more enjoyable experience. While offering a flexible approach tailored to users' needs, HilalimSB also promises an aesthetic and professional experience.
Strong Signals and Buy/Sell Indicators:
After completing test operations, HilalimSB produces data at various time intervals. However, we would like to emphasize to users that based on our studies, it provides the best signals in 1-hour chart data. HilalimSB produces strong signals to identify trend reversals. Buy or sell points are clearly indicated, allowing users to develop and implement trading strategies based on these signals.
For example, let's imagine you wanted to open a position on BTC on 2023.11.02. You are aware that you need to calculate which of the buying or selling transactions would be more profitable. You need support from various indicators to open a position. Based on the analysis and calculations it has made from the data it contains, HilalimSB would have detected that the graph is more suitable for a selling position, and by producing a sell signal at the most ideal selling point at 08:00 on 2023.11.02 (UTC+3 Istanbul), it would have informed you of the direction the graph would follow, allowing you to benefit positively from a 2.56% decline.
Technology and Innovation:
HilalimSB aims to enhance the trading experience using the latest technology. With its innovative approach, it enables users to discover market opportunities and support their decisions. Thus, investors can make more informed and successful trades. Real-Time Data Analysis: HilalimSB analyzes market data in real-time and identifies updated trends instantly. This allows users to make more informed trading decisions by staying informed of the latest market developments. Continuous Update and Improvement: HilalimSB is constantly updated and improved. New features are added and existing ones are enhanced based on user feedback and market changes. Thus, HilalimSB always aims to provide the latest technology and the best user experience.
Social Order and Intrinsic Motivation:
Negative trends such as widespread illegal gambling and uncontrolled risk-taking can have adverse financial effects on society. The primary goal of HilalimSB is to counteract these negative trends by guiding and encouraging users with data-driven analysis and calculable investment systems. This allows investors to trade more consciously and safely.
Scalp

Moving Average Scalper by nnamdertWhat does this Indicator Do?
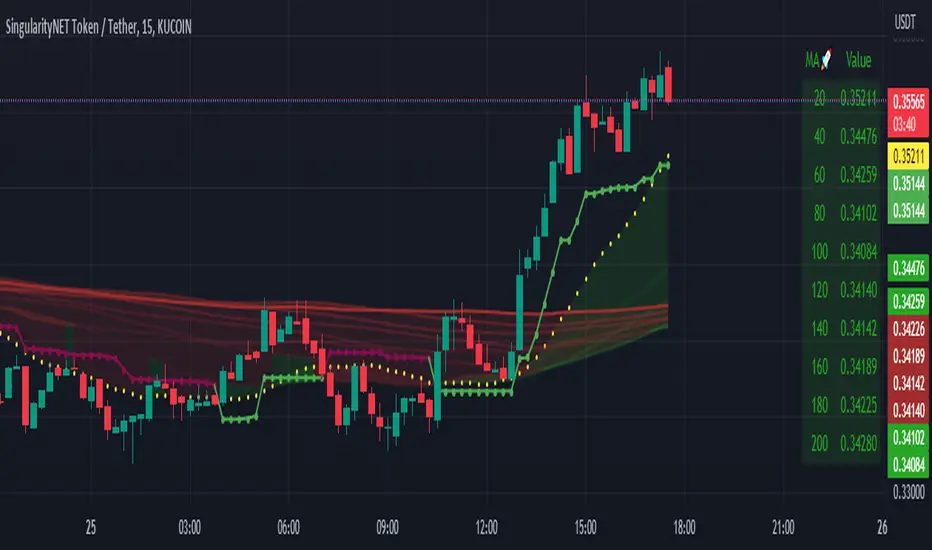
By request and popular demand, I have created a quick and easy Moving Average Crossover Scalper Indicator. This indicator simply allows the trader to visualize scalping opportunities in an easy way using MA crossovers.
The Indicator also plots multiple higher moving averages via an "optional" table. The table gives a quick glance at the overall trend (based on moving Averages alone).
Users can adjust the initial Moving Average Length and the number of additional Moving Average Lengths to be plotted on the chart.
How do I use it?
As shown below, the cross overs are very easy to see. The Stoploss "should" be set at the most recent swing high or low prior to the MA Cross.
The dotted yellow line must cross above or below the thick mutli-colored line in order to be considered valid.
As seen in the screenshot below, an optional input setting turns ON / OFF additional Moving Average "Lines" and plots them on the chart. In addition, the indicator color fills between the moving averages based on Bullish or Bearish movement. If the lines are in continuity, then the color will be either RED or GREEN depending on the market sentiment (bull or bear).
The total number of Moving Averages listed in the table can be manually adjusted in the settings by the user. The table is small and see-through so it works on mobile devices as well and allows the user to still see the candles easily. Simply double clicking on the table will bring up the settings.
As shown below, the table can be relocated to a position acceptable to the user if it is in the way. This option is available under input settings.
I hope this indicator proves useful for you and your trading style. If you have any suggestions please let me know.
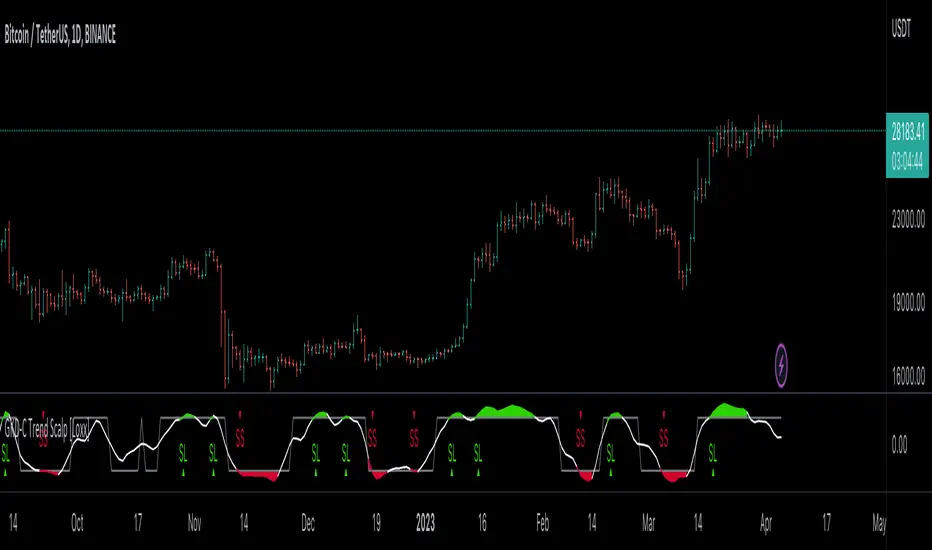
GKD-C Trend Scalp [Loxx]Giga Kaleidoscope GKD-C Trend Scalp is a Confirmation module included in Loxx's "Giga Kaleidoscope Modularized Trading System".
█ Giga Kaleidoscope Modularized Trading System
What is Loxx's "Giga Kaleidoscope Modularized Trading System"?
The Giga Kaleidoscope Modularized Trading System is a trading system built on the philosophy of the NNFX (No Nonsense Forex) algorithmic trading.
What is the NNFX algorithmic trading strategy?
The NNFX (No-Nonsense Forex) trading system is a comprehensive approach to Forex trading that is designed to simplify the process and remove the confusion and complexity that often surrounds trading. The system was developed by a Forex trader who goes by the pseudonym "VP" and has gained a significant following in the Forex community.
The NNFX trading system is based on a set of rules and guidelines that help traders make objective and informed decisions. These rules cover all aspects of trading, including market analysis, trade entry, stop loss placement, and trade management.
Here are the main components of the NNFX trading system:
1. Trading Philosophy: The NNFX trading system is based on the idea that successful trading requires a comprehensive understanding of the market, objective analysis, and strict risk management. The system aims to remove subjective elements from trading and focuses on objective rules and guidelines.
2. Technical Analysis: The NNFX trading system relies heavily on technical analysis and uses a range of indicators to identify high-probability trading opportunities. The system uses a combination of trend-following and mean-reverting strategies to identify trades.
3. Market Structure: The NNFX trading system emphasizes the importance of understanding the market structure, including price action, support and resistance levels, and market cycles. The system uses a range of tools to identify the market structure, including trend lines, channels, and moving averages.
4. Trade Entry: The NNFX trading system has strict rules for trade entry. The system uses a combination of technical indicators to identify high-probability trades, and traders must meet specific criteria to enter a trade.
5. Stop Loss Placement: The NNFX trading system places a significant emphasis on risk management and requires traders to place a stop loss order on every trade. The system uses a combination of technical analysis and market structure to determine the appropriate stop loss level.
6. Trade Management: The NNFX trading system has specific rules for managing open trades. The system aims to minimize risk and maximize profit by using a combination of trailing stops, take profit levels, and position sizing.
Overall, the NNFX trading system is designed to be a straightforward and easy-to-follow approach to Forex trading that can be applied by traders of all skill levels.
Core components of an NNFX algorithmic trading strategy
The NNFX algorithm is built on the principles of trend, momentum, and volatility. There are six core components in the NNFX trading algorithm:
1. Volatility - price volatility; e.g., Average True Range, True Range Double, Close-to-Close, etc.
2. Baseline - a moving average to identify price trend
3. Confirmation 1 - a technical indicator used to identify trends
4. Confirmation 2 - a technical indicator used to identify trends
5. Continuation - a technical indicator used to identify trends
6. Volatility/Volume - a technical indicator used to identify volatility/volume breakouts/breakdown
7. Exit - a technical indicator used to determine when a trend is exhausted
What is Volatility in the NNFX trading system?
In the NNFX (No Nonsense Forex) trading system, ATR (Average True Range) is typically used to measure the volatility of an asset. It is used as a part of the system to help determine the appropriate stop loss and take profit levels for a trade. ATR is calculated by taking the average of the true range values over a specified period.
True range is calculated as the maximum of the following values:
-Current high minus the current low
-Absolute value of the current high minus the previous close
-Absolute value of the current low minus the previous close
ATR is a dynamic indicator that changes with changes in volatility. As volatility increases, the value of ATR increases, and as volatility decreases, the value of ATR decreases. By using ATR in NNFX system, traders can adjust their stop loss and take profit levels according to the volatility of the asset being traded. This helps to ensure that the trade is given enough room to move, while also minimizing potential losses.
Other types of volatility include True Range Double (TRD), Close-to-Close, and Garman-Klass
What is a Baseline indicator?
The baseline is essentially a moving average, and is used to determine the overall direction of the market.
The baseline in the NNFX system is used to filter out trades that are not in line with the long-term trend of the market. The baseline is plotted on the chart along with other indicators, such as the Moving Average (MA), the Relative Strength Index (RSI), and the Average True Range (ATR).
Trades are only taken when the price is in the same direction as the baseline. For example, if the baseline is sloping upwards, only long trades are taken, and if the baseline is sloping downwards, only short trades are taken. This approach helps to ensure that trades are in line with the overall trend of the market, and reduces the risk of entering trades that are likely to fail.
By using a baseline in the NNFX system, traders can have a clear reference point for determining the overall trend of the market, and can make more informed trading decisions. The baseline helps to filter out noise and false signals, and ensures that trades are taken in the direction of the long-term trend.
What is a Confirmation indicator?
Confirmation indicators are technical indicators that are used to confirm the signals generated by primary indicators. Primary indicators are the core indicators used in the NNFX system, such as the Average True Range (ATR), the Moving Average (MA), and the Relative Strength Index (RSI).
The purpose of the confirmation indicators is to reduce false signals and improve the accuracy of the trading system. They are designed to confirm the signals generated by the primary indicators by providing additional information about the strength and direction of the trend.
Some examples of confirmation indicators that may be used in the NNFX system include the Bollinger Bands, the MACD (Moving Average Convergence Divergence), and the MACD Oscillator. These indicators can provide information about the volatility, momentum, and trend strength of the market, and can be used to confirm the signals generated by the primary indicators.
In the NNFX system, confirmation indicators are used in combination with primary indicators and other filters to create a trading system that is robust and reliable. By using multiple indicators to confirm trading signals, the system aims to reduce the risk of false signals and improve the overall profitability of the trades.
What is a Continuation indicator?
In the NNFX (No Nonsense Forex) trading system, a continuation indicator is a technical indicator that is used to confirm a current trend and predict that the trend is likely to continue in the same direction. A continuation indicator is typically used in conjunction with other indicators in the system, such as a baseline indicator, to provide a comprehensive trading strategy.
What is a Volatility/Volume indicator?
Volume indicators, such as the On Balance Volume (OBV), the Chaikin Money Flow (CMF), or the Volume Price Trend (VPT), are used to measure the amount of buying and selling activity in a market. They are based on the trading volume of the market, and can provide information about the strength of the trend. In the NNFX system, volume indicators are used to confirm trading signals generated by the Moving Average and the Relative Strength Index. Volatility indicators include Average Direction Index, Waddah Attar, and Volatility Ratio. In the NNFX trading system, volatility is a proxy for volume and vice versa.
By using volume indicators as confirmation tools, the NNFX trading system aims to reduce the risk of false signals and improve the overall profitability of trades. These indicators can provide additional information about the market that is not captured by the primary indicators, and can help traders to make more informed trading decisions. In addition, volume indicators can be used to identify potential changes in market trends and to confirm the strength of price movements.
What is an Exit indicator?
The exit indicator is used in conjunction with other indicators in the system, such as the Moving Average (MA), the Relative Strength Index (RSI), and the Average True Range (ATR), to provide a comprehensive trading strategy.
The exit indicator in the NNFX system can be any technical indicator that is deemed effective at identifying optimal exit points. Examples of exit indicators that are commonly used include the Parabolic SAR, the Average Directional Index (ADX), and the Chandelier Exit.
The purpose of the exit indicator is to identify when a trend is likely to reverse or when the market conditions have changed, signaling the need to exit a trade. By using an exit indicator, traders can manage their risk and prevent significant losses.
In the NNFX system, the exit indicator is used in conjunction with a stop loss and a take profit order to maximize profits and minimize losses. The stop loss order is used to limit the amount of loss that can be incurred if the trade goes against the trader, while the take profit order is used to lock in profits when the trade is moving in the trader's favor.
Overall, the use of an exit indicator in the NNFX trading system is an important component of a comprehensive trading strategy. It allows traders to manage their risk effectively and improve the profitability of their trades by exiting at the right time.
How does Loxx's GKD (Giga Kaleidoscope Modularized Trading System) implement the NNFX algorithm outlined above?
Loxx's GKD v1.0 system has five types of modules (indicators/strategies). These modules are:
1. GKD-BT - Backtesting module (Volatility, Number 1 in the NNFX algorithm)
2. GKD-B - Baseline module (Baseline and Volatility/Volume, Numbers 1 and 2 in the NNFX algorithm)
3. GKD-C - Confirmation 1/2 and Continuation module (Confirmation 1/2 and Continuation, Numbers 3, 4, and 5 in the NNFX algorithm)
4. GKD-V - Volatility/Volume module (Confirmation 1/2, Number 6 in the NNFX algorithm)
5. GKD-E - Exit module (Exit, Number 7 in the NNFX algorithm)
(additional module types will added in future releases)
Each module interacts with every module by passing data between modules. Data is passed between each module as described below:
GKD-B => GKD-V => GKD-C(1) => GKD-C(2) => GKD-C(Continuation) => GKD-E => GKD-BT
That is, the Baseline indicator passes its data to Volatility/Volume. The Volatility/Volume indicator passes its values to the Confirmation 1 indicator. The Confirmation 1 indicator passes its values to the Confirmation 2 indicator. The Confirmation 2 indicator passes its values to the Continuation indicator. The Continuation indicator passes its values to the Exit indicator, and finally, the Exit indicator passes its values to the Backtest strategy.
This chaining of indicators requires that each module conform to Loxx's GKD protocol, therefore allowing for the testing of every possible combination of technical indicators that make up the six components of the NNFX algorithm.
What does the application of the GKD trading system look like?
Example trading system:
Backtest: Strategy with 1-3 take profits, trailing stop loss, multiple types of PnL volatility, and 2 backtesting styles
Baseline: Hull Moving Average
Volatility/Volume: Hurst Exponent
Confirmation 1: Trend Scalp as shown on the chart above
Confirmation 2: Williams Percent Range
Continuation: Fisher Transform
Exit: Rex Oscillator
Each GKD indicator is denoted with a module identifier of either: GKD-BT, GKD-B, GKD-C, GKD-V, or GKD-E. This allows traders to understand to which module each indicator belongs and where each indicator fits into the GKD protocol chain.
Giga Kaleidoscope Modularized Trading System Signals (based on the NNFX algorithm)
Standard Entry
1. GKD-C Confirmation 1 Signal
2. GKD-B Baseline agrees
3. Price is within a range of 0.2x Volatility and 1.0x Volatility of the Goldie Locks Mean
4. GKD-C Confirmation 2 agrees
5. GKD-V Volatility/Volume agrees
Baseline Entry
1. GKD-B Baseline signal
2. GKD-C Confirmation 1 agrees
3. Price is within a range of 0.2x Volatility and 1.0x Volatility of the Goldie Locks Mean
4. GKD-C Confirmation 2 agrees
5. GKD-V Volatility/Volume agrees
6. GKD-C Confirmation 1 signal was less than 7 candles prior
Continuation Entry
1. Standard Entry, Baseline Entry, or Pullback; entry triggered previously
2. GKD-B Baseline hasn't crossed since entry signal trigger
3. GKD-C Confirmation Continuation Indicator signals
4. GKD-C Confirmation 1 agrees
5. GKD-B Baseline agrees
6. GKD-C Confirmation 2 agrees
1-Candle Rule Standard Entry
1. GKD-C Confirmation 1 signal
2. GKD-B Baseline agrees
3. Price is within a range of 0.2x Volatility and 1.0x Volatility of the Goldie Locks Mean
Next Candle:
1. Price retraced (Long: close < close or Short: close > close )
2. GKD-B Baseline agrees
3. GKD-C Confirmation 1 agrees
4. GKD-C Confirmation 2 agrees
5. GKD-V Volatility/Volume agrees
1-Candle Rule Baseline Entry
1. GKD-B Baseline signal
2. GKD-C Confirmation 1 agrees
3. Price is within a range of 0.2x Volatility and 1.0x Volatility of the Goldie Locks Mean
4. GKD-C Confirmation 1 signal was less than 7 candles prior
Next Candle:
1. Price retraced (Long: close < close or Short: close > close )
2. GKD-B Baseline agrees
3. GKD-C Confirmation 1 agrees
4. GKD-C Confirmation 2 agrees
5. GKD-V Volatility/Volume Agrees
PullBack Entry
1. GKD-B Baseline signal
2. GKD-C Confirmation 1 agrees
3. Price is beyond 1.0x Volatility of Baseline
Next Candle:
1. Price is within a range of 0.2x Volatility and 1.0x Volatility of the Goldie Locks Mean
3. GKD-C Confirmation 1 agrees
4. GKD-C Confirmation 2 agrees
5. GKD-V Volatility/Volume Agrees
█ GKD-C Trend Scalp
What is T3?
The T3 Moving Average (T3MA) is a technical analysis indicator that was developed by Tim Tillson. It is a trend-following indicator that aims to provide a smoother and more accurate representation of price trends than other moving average indicators.
The T3MA is a type of exponential moving average ( EMA ) that is calculated using a series of complex formulas. Unlike a simple or exponential moving average , which use fixed smoothing factors, the T3MA uses a variable smoothing factor that is based on the volatility of the underlying asset. This means that the T3MA is able to adapt to changing market conditions and provide more accurate signals.
The formula for calculating the T3MA is as follows:
T3 = a * EMA1 + (1 - a) * T3
Where:
-T3 is the current value of the T3MA
-EMA1 is the current value of the first EMA
-T3 is the previous value of the T3MA
-a is the smoothing factor, which is based on the volatility of the underlying asset and is calculated using the following formulas:
-c1 = -1 + exp (-sqrt(2) * pi / period)
-c2 = 2 * c1 * c1 + 2 * c1
-c3 = 1 - c1 - c2
-a = c1 * sqrt(period) * (close - T3) + c2 * T3 + c3 * EMA1
In simple terms, the T3MA is calculated by taking a weighted average of two different EMAs, with the weight given to each EMA depending on the volatility of the asset being analyzed. The T3MA is then smoothed using a second smoothing factor, which further reduces noise and improves the accuracy of the indicator.
The T3MA can be used in a variety of ways by traders and analysts. Some common applications include using the T3MA as a trend-following indicator, with buy signals generated when the price of an asset crosses above the T3MA and sell signals generated when the price crosses below. The T3MA can also be used in combination with other indicators and analytical techniques to confirm trading decisions and identify potential trend reversals.
Overall, the T3 Moving Average is a highly sophisticated and complex technical indicator that is designed to provide a more accurate and reliable representation of price trends. While it may be difficult for novice traders to understand and use effectively, experienced traders and analysts may find the T3MA to be a valuable tool in their trading toolbox.
What is Trend Scalp?
Trend Scalp calculates the difference between bull and bear power and then smooths this calculation using the T3 filter. This indicator is good for lower timeframe scalping. For use in regular trading, decrease the levels value, for scalps, keep the levels value high.
Requirements
Inputs
Confirmation 1 and Solo Confirmation: GKD-V Volatility / Volume indicator
Confirmation 2: GKD-C Confirmation indicator
Outputs
Confirmation 2 and Solo Confirmation Complex: GKD-E Exit indicator
Confirmation 1: GKD-C Confirmation indicator
Continuation: GKD-E Exit indicator
Solo Confirmation Simple: GKD-BT Backtest strategy
Additional features will be added in future releases.
VWAP Bollinger Band Crossover Breakout with ResistanceCredit to © Jesus_Salvatierra for VWAP script
This script help you find a trend in momentum stock that is about to breakout and shows resistance point. This script utilizes Bollinger bands VWAP and is good for intra day charts.
VWAP, or Volume Weighted Average Price, is a technical analysis tool used to measure the average price a security trades at during a given time period, weighted by the trading volume for each price level. It is commonly used by traders and investors to identify the true average price of a security and to assess whether they are buying or selling at a fair price.
A Bollinger Band is a technical analysis tool that uses standard deviation to measure the volatility of a security. The Bollinger Band is typically composed of three lines: the upper band, the lower band, and the middle band. The middle band is a simple moving average of the security's price, while the upper and lower bands are calculated based on the standard deviation of the security's price.
A Bollinger Band crossover occurs when the price of a security crosses above or below one of the bands. When the price crosses above the upper band, it is considered overbought, while when it crosses below the lower band, it is considered oversold. Traders often use Bollinger Band crossovers as a signal to enter or exit a position, depending on their trading strategy.
The VWAP and Bollinger Band crossover are two separate technical analysis tools that can be used in conjunction with each other. When a security's price crosses above or below the Bollinger Band, traders may look to the VWAP to confirm whether the security is trading at a fair price. If the security is trading above the VWAP, it may be overvalued, while if it is trading below the VWAP, it may be undervalued. Similarly, traders may use the Bollinger Band crossover as a signal to enter or exit a position, while also taking into account the VWAP to assess whether the price is fair.

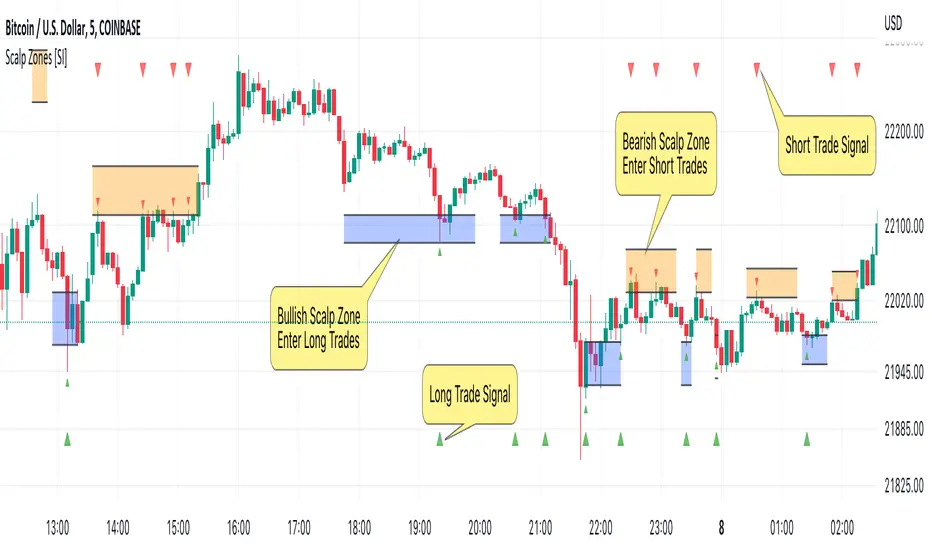
Scalp Zones [SI]The Scalp Zones indicator provides traders with visual ranges or "zones" on their charts, which can be used to quickly identify potential entry points for their trades in real time. Once price action enters the designated zone, trade signals and alerts will be generated, making it easier for both scalpers and swing traders to identify promising trading opportunities with greater confidence.
Although Scalp Zones is relatively easy to use, its simplicity is the end result of some interesting and rather complex analysis of price action and market structure.
█ CONCEPTS
Price Action vs Market Structure
For our purposes, “price action” refers to the movement of a security's price over time, whereas “market structure”, which is built upon price action, includes trends and support/resistance levels, breakouts, reversals of trend, etc. All of which can help traders identify potential entry and exit points for their trades.
Scalp Zone
A “Scalp Zone” is an area just above resistance or just below support that is deemed to be part of a trend that is exhausted or part of a “whipsaw” in the price action.
█ FEATURES
Can be combined with other indicators
Scalp Zones displays color-coded rectangles or "zones" that indicate areas of potential volatility, trend reversals and consolidation in price action. These zones can be used in conjunction with other indicators to more effectively identify trade opportunities.
Can also serve as an exit signal
Since Scalp Zones identifies areas where market participants are likely to enter or exit positions, they can offer some traders a way to spot good exits for their trades. For instance, if the price fails to surpass a significant resistance level (identified by a “scalp Zone”) and begins to decline, this may serve as a sell signal for traders who intend to lock in profits on a potential trend reversal.
Automatically adjusts to market conditions
Scalp Zones uses Average True Range (ATR) to dynamically adjust the size of the color-coded zones based on the current market conditions. By factoring in the ATR, the tool can produce zones that reflect the volatility of the market and adjust to changing levels of price movement.
█ LIMITATIONS
The Scalp Zones indicator is designed to provide traders with signals for potential entry points in the market, but it should not be used as the sole basis for making trading decisions. As with any trading indicator, it is important to acknowledge and understand that past performance does not guarantee future outcomes and that several other variables contribute to achieving success as a trader, especially proper risk management.
Ema ScalpThis is another simple strategy based on ema
Entry Buy - 1) when close crossover ema then buy and only open one trade till it not close
2) if previous buy trade is profitable open another trade and check again trade is profitable or not
3)if trade is not profitable reset and wait for sell condition...
Entry Sell -1) when close crossunder ema then sell and only open one trade till it not close
2) if previous sell trade is profitable open another trade and check again trade is profitable or not
3) if trade is not profitable reset and wait for buy condition.....
stop loss and take profit is percentage based ...

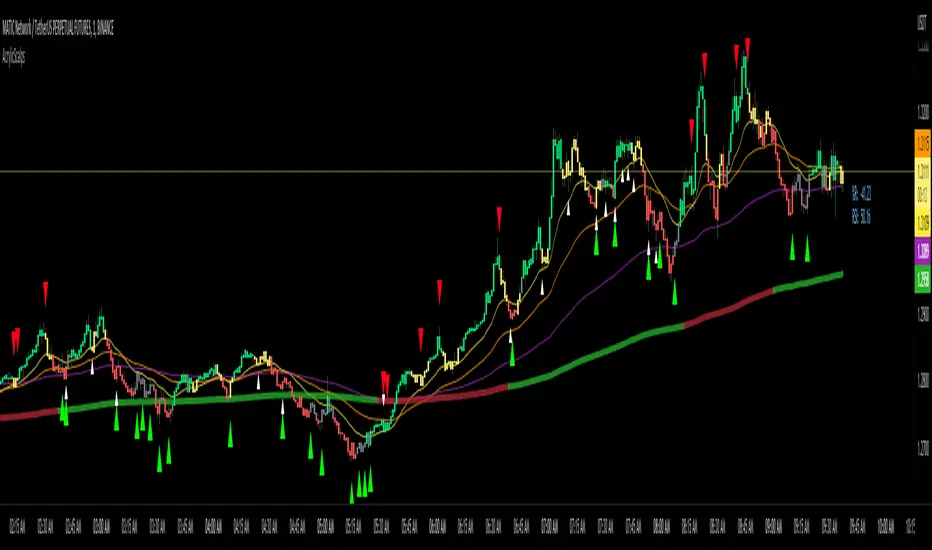
Acrylic's 1m/3m Scalper Buy/Sell SignalsAcrylic's Scalper Signals uses a combination of RSI / Stochastic / Williams %R to calculate the perfect entry signals. The script(with it's default settings) has been optimized and thoroughly tested on BTC & ETH 1 and 3 minute time frames. It's intended for quick in and out trades that should only last a few minutes unless a strong trend is caught. Basic knowledge of market structure is needed, as you will not be taking every signal generated by the script.
You also have the option to display all signals regardless of the short term trend that has been confirmed by RSI. This can be good if you're looking for reversal entries at resistance/support levels.
-Large triangle signal: Strongest signal that was confirmed with RSI & Williams %R optimized calculations. (prints at current candle close)
-Small triangle signal: Fractal signal can be used as a late entry signal/continuation. (prints after 2 candle closes)
-Candle colors are matched to stochastic strength for added confluence to enter trades. (Must hide default trading view candles to see these)
-233SMMA color is matched to the extreme short term trend based off of RSI calculations.
Perfect Long Entry Setup Image :
1) EMA21 > EMA55 > EMA100 > SMMA233(Colored green for added confluence) - All pointing up indicating strong trend
2) Enter on pullback to short term EMA after signal candle closes. (Do not take entry if candles closed below 100EMA)
Perfect Short Entry Setup Image :
1) EMA21 < EMA55 < EMA100 < SMMA233(Colored red for added confluence) - All pointing down indicating strong trend
2) Enter on pullback to short term EMA after signal candle closes. (Do not take entry if candles closed above 100EMA)
Feel free to ask questions or leave feedback in the comments, I'm always looking to improve! Thanks!
PSAR BBPT ZLSMA BTC 1minLong entry:
PSAR gives buy signal
BBPT prints green histogram
ZLSMA is below the price
ZLSMA has uptrend
SL is smaller than the max SL
Optional Sessions and EMA filters
Short entry
PSAR gives sell signal
BBPT prints red histogram
ZLSMA is above the price
ZLSMA has downtrend
SL is smaller than the max SL
Optional Sessions and EMA filters
SL:
Placed below ZLSMA + offset on long
Placed above ZLSMA + offset on short
TP1:
1x the SL by default
Takes no profit by default, 50% is also a good setting
TP2:
2x the SL by default
Take out all remaining position size.
If price reaches TP1, the SL is set to the entry price.

Andromeda [Loxx]Andromeda is a lower timeframe, high-leverage scalping indicator tuned to Cryptocurrency futures trading. It works by scanning for volatility spikes and then calculation the likelihood that those spikes will break market structure to the upside or downside.
Settings
Volatility Type: ATR or TRD, these types will be expanded in future releases.
Signal Speed: How quickly you'd like signals to flow in
Equity Calculation Method: Fixed or compounded. This determines trade size. If fixed, then the strategy uses the same quantity per trade, if compounded the strategy uses a percentage of cash on hand as that cash grows or shrinks
% Risk Per Trade: How much you'd like to risk per trade.
Leverage Multiple: How much leverage you'd like to use
% Maintenance Margin: You can find this value posted on the exchange you use
Enabled Forced Liquidation Stop-loss?: If enabled, the strategy will liquidate at measures of leverage automatically. 10x leverage liquidates at 10% opposite move for the trade, for example. This number will be adjusted by the % Maintenance Margin determined by the exchange.
% Minimum Take Profit Cutoff: This controls whether you wish to take trades only over XX% volatility. Since this indicator is to be used for small tight scalps, this keeps you out of trades that are too small to be useful for your desired trading style
Activate Long Pullback Rule?: This controls how the trade is entered. If activated, then the entry won't occur until a pullback happens after market structure break
Activate Short Pullback Rule?: This controls how the trade is entered. If activated, then the entry won't occur until a pullback happens after market structure break
Activate Trend Flip Exits?: Force strategy to exit when trend flips from short to long and long to short
Number of Take Profits: How many take profits levels. 1-5
Activate Trailing Take Profit?: Allows you to set a trailing stop loss after TP2 his hit
Trailing Take Profit Offset Multipler: This determines when the trailing stoploss hits. It's a multiple of volatility
Activate Moving Stop-loss?: Forces the stop loss to move up as targets are reached
Where to Move Stop-loss: At which Take Profit level do we begin to move stoplosses upward with targets
Show dip buying levels: If you have a high risk appetite, these are levels where you could increase your investment size, this has no effect on the strategy but is included for if you wish to manually add to your position size
Activate Longs?: Toggles on/off Longs
Activate Longs?: Toggles on/off Shorts
The remaining settings are multiples of volatility for Take Profits and dip buying levels
UI components
Big green and red plus signs means an entry point. PTF with green and red arrows means "prepare for trend flip". Not every PTF will actually flip the trend. These are just warning shots to make you aware that a possible trend flip is coming. Labels nest to market structure breaks with numbers are the ideal entry level. You can set limit orders at these levels so as to incur less exchange fees on Binance or Bybit for example. The data window provides useful information about the current trade and targets and stoploss of the next upcoming trade giving the current price action of the asset.
Other things to note
this is an extremely high risk strategy depending on how you tune the settings. You can tune down the settings to make it less risky at the cost of profit and hit rate, but that's up to you and your trading style. This can be used all all timeframes, but is meant for timeframes below 4 hours.

Morning Scalp StrategyThe Morning Scalp Strategy combines the 50EMA with the Stochastic Momentum Index. The morning period is when penny stocks usually have the highest volatility, so the strategy works between 10:00 AM and 12:10 PM.
***It opens only long positions. The ideal timeframe for this scalping strategy is 5 minutes on low-price stocks. The stock should spike in the morning with momentum and Volume.
***Look for a daily or intraday support area, close to the open position, to increase the confidence in the play
The components are:
- EMA50: Exponential Moving Average (EMA50)
- Stochastic Momentum Index (SMI)
Rules:
- Period: 10:00 AM and 12:10 PM
- if SMI Crossover and SMI < 0, open a position
- If close < EMA50, close the position
- Profit target: To be decided by the user, default value = 10% above the entry price
If you have any questions, let me know!

Volatility Stop with Vwap StrategyFirst the credits goes to @TradingView for their release of the volatility stop mtf indicator.
I have took it, and inside I have added a weekly vwap for a better trend direction and at the same time I have added a dynamic risk managment which is calculated from the distance between the volatility line to the close of the candle.
The rules for entry are simple:
For long:We enter when our close of the candle is above the volatility stop line and at the same time the close of the candle is above weekly vwap
For short we enter when our close of the candle is below the volatility stop line and at the same time the close of the candle is below weekly vwap.
We exit when we either have a reverse signal than the one we enterred, or based on the TP/SL which is calculated with the distance from vwap to the close of the candle.
If you have any questions please let me know !

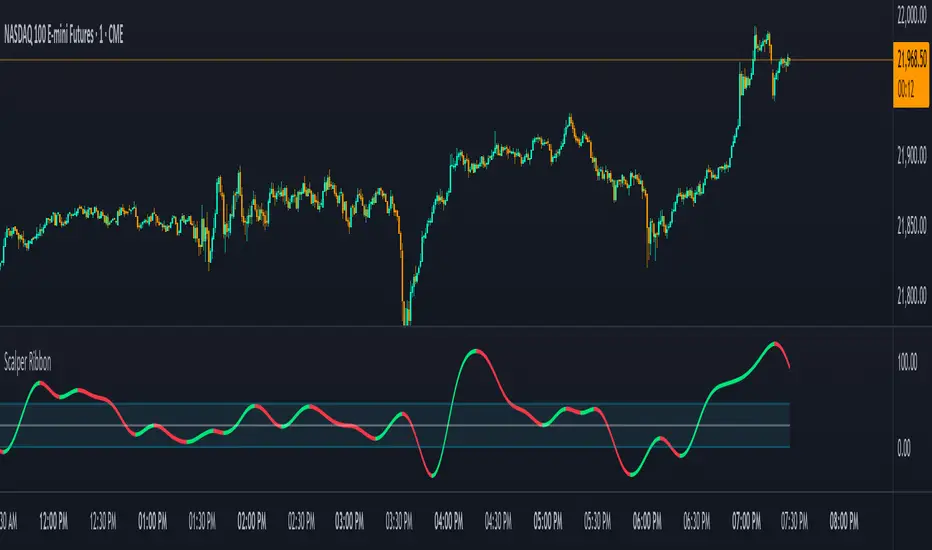
Scalper RibbonThis Scalper Ribbon is a combination of 6 different oscillators with a sprinkle of secret sauce . It’s smoothed out so it’s easy to read, but is quick enough to catch reversals early and helps you spot divergences. It will turn green or red according to the bullish or bearish nature of the ticker you are viewing without all of the noise that most oscillators give you.
It combines price action, momentum, rsi and a few other oscillators together to give an overall trend strength line that is smoothed out and coupled with a moving average to make it less noisy. Use it as an identifier of the underlying trend so you can make better decisions on scalp trades as well as swing trades on longer timeframes. Wait for the ribbon to break out/down from the middle blue range to avoid chop and get in when price is actually moving.
***HOW TO USE***
Find tops and bottoms of the market by looking for reversals in the ribbon when it is either very high or very low. The white line is the midline and the ribbon is overall bullish when above the midline and overall bearish when below the midline. There are also two blue lines just above and below the midline that is a buffer area I like to call the neutral range. When the ribbon is in the neutral range, expect indecision in the market and look for the ribbon to break out or down from that range for continuation of a trend. The farther away from the neutral range the ribbon is, the stronger the trend is. Take a look at how it performs across multiple timeframes and tickers and get a feel for it before using it in your strategy. It will help you spot reversals early and show you hidden divergences in price action before the reversals happen.
***CUSTOMIZATION***
You can adjust the length of the oscillators and the moving average ribbon to be faster or slower to suit your preferences. The lower the number used, the faster it will detect changes, but the more noise it will have. The higher the number used, the slower it will detect changes, but there will be less noise and easier to follow.
***MARKETS***
This indicator can be used as a signal on all markets, including stocks, crypto, futures and forex.
***TIMEFRAMES***
This Scalper Ribbon indicator can be used on all timeframes.
Bollinger Bands Scalper + VWAPGet more consistent scalps by trading in-between Bollinger Band Deviations.
FEATURES:
1) 3 Bollinger Bands with default settings to 1, 2, and 3 deviations for more consistent scalps
2) Trendicator: a dynamic color changing moving average that helps you see trend quickly
3) Robust VWAP tool with up to 3 different deviations as well as different anchor points to help you see strong support and resistances
4) Calming "purple cloud" color palette helps you focus on price action
5) Discover new trading strategies with a wide range of customizability

Scot Signal IndicatorThe Scot Signal Indicator is intended as a Scalping Resource. It was designed to work best on the ❗❗ 5 MINUTE CHART with Bitcoin ❗❗ / USD & USDT pairs.
🟡🔼🔽 Yellow Triangles : these are pre-signals. If the triangle is Pointing Down, then look for a possible Short to come, and vice-versa for Upward facing triangles will go Long.
* Be careful, this is a Canary in the Coal Mine, but not the full signal. Going purely on the triangle as a signal could lead to fake-outs more frequently.
🟩 🟥 Green & Red Boxes : these are "Long" & "Short" signals where the indicator feels the time is safe to enter a trade.
❗ EXITING THE TRADE ❗ : this is a scalping indicator, specifically meant for entering trades, NOT EXITING them. An ideal scalp is $100 - $200 Bitcoin move. Though, we run bots using this indicator, taking scalps as little
as $60, performing up to 8 trades a day.

Scalp 1min CryptoThis scalping strategy is designed for 1min timeframe.
It uses indicators: SuperTrend 15m ( is used to filter the trade as to open only long position or short position), Wavetrend 1min, Bollinger Band 3min, Stoch 3min to find entry.
TP: optimized value : 0.5 - 1
Stoploss: You have two choice: % or when SuperTrend reverse
If you would like use scripts, please ib to me.
You are welcom!

Daily Scalping Moving AveragesThis is a technical analysis study based on the most fit leading indicators for short timeframes like EMA and SMA.
At the same time we have daily channel made from the last 2 weeks of ATR values, which will give us the daily top and bottom expected values(with 80%+ confidence)
We have 3 groups of lengths for short length, medium length and a bigger length.
At the same time we combine it with the daily vwap values .
In the end we are going to have a total of 7 indicators telling us the direction.
The way we can use it :
The max ratings that we can have are +7 for long and -7 for short
In general once we have at least 5 indicators(fast and medium ones) giving us a direction, there is a high chance that we can scalp that trend and then we can exit either when we will be at +7 or close to neutral point
At the same time is very important to be aware of the current position inside of the TOP/BOTTOM channel that we have.
For example lets assume we are at 40k on BTC and our top channel is around 41-42k while the bottom is around 38k. In this case the margin that we have for long is much smaller than for short, so we should be prepared to exit once we reach the top values and from there wait and see if there is a huge continuation or a reversal. If the top channel was hit and the market started the rebounce going downwards and the moving averages confirms it, then we have a huge advantage using the top points as a STOP LOSS and continue the short movements, giving us an amazing risk/reward ratio .
If you have any questions let me know !

VIX Reversal Scalper by Trend Friend - Stocks OnlyVIX REVERSAL SCALPER BY TREND FRIEND - STOCKS ONLY
This indicator is built for scalping, but can be used for swing trades by adjusting the signal settings to a higher number.
This indicator is meant for stocks with a lot of price action and volatility, so for best results, use it on charts that move similar to the S&P 500 or other similar charts.
This indicator uses real time data from the stock market overall, so it should only be used on stocks and will only give a few signals during after hours. It does work ok for crypto, but will not give signals when the US stock market is closed.
**HOW TO USE**
When the VIX Volatility Index trend changes direction, it will give a bull or bear signal on the chart depending on which way the VIX is now trending. Follow these when price is near support/resistance or fibonacci levels.
For more signals with earlier entries, go into settings and reduce the number. 10-100 is best for scalping. For less signals with later entries, change the number to a higher value. Use 100-500 for swing trades. Can go higher for long swing trades.
***MARKETS***
This indicator should only be used on the US stock markets as signals are given based on the VIX volatility index which measures volatility of the US Stock Markets.
***TIMEFRAMES***
This indicator works on all time frames.
**NOTE**
Repainting does happen but it is seldom. If I get enough requests to remove repainting I will, but since it is built for early entries, preventing it from repainting will make the signals show up later than normal.
Due to various factors, this indicator might not give exit signals every time it should, so be sure to watch the price action for entries/exits and don't rely solely on this indicator.
**INVERSE CHARTS**
If you are using this on an inverse ETF and the signals are showing backwards, please comment with what chart it is and I will configure the indicator to give the correct signals. I have included over 50 inverse ETFs into the code to show the correct signals on inverse charts, but I'm sure there are some that I have missed so feel free to let me know and I will update the script with the requested tickers.
***TIPS***
Try using numerous indicators of ours on your chart so you can instantly see the bullish or bearish trend of multiple indicators in real time without having to analyze the data. Some of our favorites are our Auto Fibonacci, Directional Movement Index, Volume Profile, Auto Support And Resistance and Money Flow Index in combination with this Vix Reversal Scalper. They all have real time Bullish and Bearish labels as well so you can immediately understand each indicator's trend.

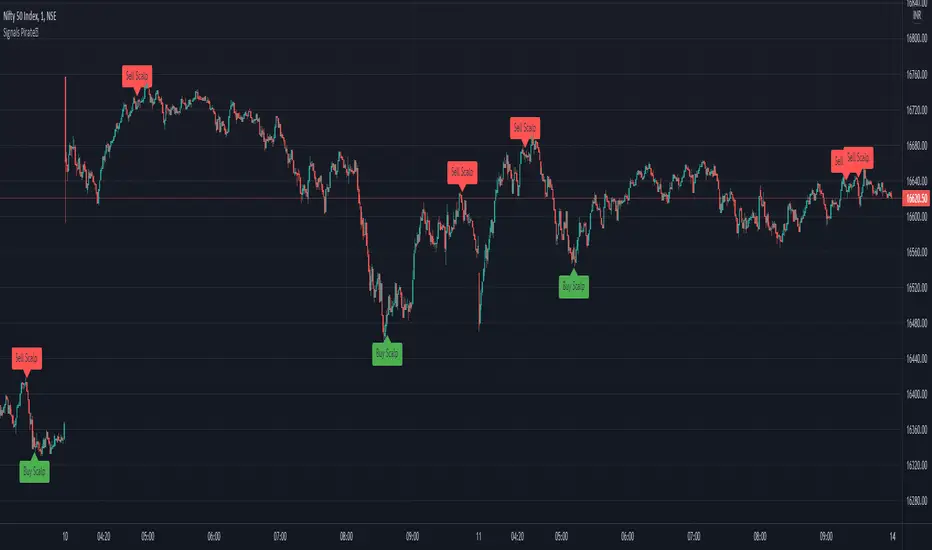
Signals Pirate™ ScalperSignalsPirate™ Scalper has been created specifically for asset scalping to help improve your short term trading by accurately identifying ‘Buy’ and ‘Sell’ opportunities!
The simplicity of this package ensures traders of all levels of expertise can utilise this tool and experience its benefits to the fullest. The only variable that alters the tools performance is the ‘Scalp Length’ option, which dictates how frequently scalping signals are identified. A value of 10 will result in more selective and less frequent signals, whereas a value of 1 will print ‘Buy’ and ‘Sell’ signals more often.
This tool has been formed using a number of trend reversal indicators, such as the RSI and Stochastics to identify overbought and oversold conditions. As well as these it incorporates crucial pivot points to identify potential support & resistance levels where scalp opportunities will have the highest chance of being successful. Combining these means when price is extremely oversold across a multitude of indicators while sitting at a pivot point support level, a ‘Buy Scalp’ label is created – and vice versa for ‘Sell Scalp’ signals.
The default settings are the best settings we’ve found so far but you can change them to build your own unique trading strategy. We’d recommend experimenting with these values to find the best results for the asset you are trading, and your own personal trading style.
Direction for use:
1. Use on any asset class and time frame, preferably on a lower timeframe (15min or less).
2. Fine tune the ‘Scalp Length’.
3. Enter a long position once a ‘Buy Scalp’ label is created, and close the position once a ‘Sell Scalp’ label is created. For short positions enter once a ‘Sell Scalp’ label is created and close once a ‘Buy Scalp’ label is created.
We hope you love this package, and it takes your trading and investing to the next level. Please let us know if you have any questions or queries regarding the logic behind the bundle, or if you have any suggestions for improvements etc. We love your feedback and are constantly striving to continuously improve!
Contrarian Scalping Counter Trend Bb Envelope Adx and StochasticContrarian Scalping is an trading strategy designed to take advanted of a counter-trend.
The advantage of these strrategies types is that they have a good profitability but with do not great gain (in relation at the time frame).
Indicators used:
Bollinger
Envelope
ADX
Stochastic
Rules for entry
For short: close of the price is above upper band from bb and envelope, adx is below 30 and stochastic is above 50
For long: close of the price is below lower band from bb and envelope, adx is below 30 and stochastic is below 50
Rules for exit
For short: either close of the candle is below lower band of bb or enveloper or stochastic is below 50
For long: either close o the candle is above upper band of bb or envelope or stochastic is above 50
If there are any questions let me know !

AlphaScalp [Backtest, No RealTime]AlphaScalp tries to find volatility moves and profits from the small pullbacks.
Even though the performance of this script in a fair amount of cases will beat HODL it is not the purpose. AlphaScalp aims for a high accuracy and profitfactor to ensure a more or less stable profit taking.
The properties like " MA Length " and the " Short - " or " Long line % " tweaks the risk by increasing or lowering the requirements for a buy (Long or Short). Close/Exit of each order is then handled by TP, SL or volatility stop.
For high volatility assets it is recommended to use the " Sell LONG on Volatility DOWN " and " Sell SHORT on Volatility UP " to ensure a TA approach for StopLoss. Normal SL is also possible to set but is not recommended on high volatility assets since you quickly can be stopped out by wicks.
AlphaScalp works best on high volatility assets with a solid liquidity and volume - but it will also work on stocks and low volatility assets.
AlphaScalp is designed for scalping and is thereby recommended to use between 5M-1H.
This version is free for your to backtest on all assets - but be aware that alerts on RealTime bars are disabled - meaning you can add alerts but they will not trigger in real time. To ensure you have the latest backtesting results, you need to have the script added to your chart, save your chart and the refresh the page.
Enjoy and please let me know if you have any questions

Scalping Trading System ALERT Crypto and StocksThis is the alert version of the strategy with the same name.
Indicators
SImple Moving Average
Exponential Moving Average
Keltner Channels
MACD Histogram
Stochastics
Rules for entry
long= Close of the candle bigger than both moving averages and close of the candle is between the top and bot levels from Keltner . At the same time the macd histogram is negative and stochastic is below 50.
short= Close of the candle smaller than both moving averages and close of the candle is between the top and bot levels from Keltner . At the same time the macd histogram is positive and stochastic is above 50.
Rules for exit
We exit when we meet an opposite reverse order.
This strategy has no risk management inside, so use it with caution !

Scalping Trading System bot Crypto and StocksThis is a trend trading strategy scalping bot that can work with any type of market. However I concluded my tests so far with Crypto, Stocks and Forex, and with optimizations always could be found some profitable settings.
Indicators
SImple Moving Average
Exponential Moving Average
Keltner Channels
MACD Histogram
Stochastics
Rules for entry
long= Close of the candle bigger than both moving averages and close of the candle is between the top and bot levels from Keltner. At the same time the macd histogram is negative and stochastic is below 50.
short= Close of the candle smaller than both moving averages and close of the candle is between the top and bot levels from Keltner. At the same time the macd histogram is positive and stochastic is above 50.
Rules for exit
We exit when we meet an opposite reverse order.
This strategy has no risk management inside, so use it with caution !

Forex Fractal EMA ScalperThis is a forex scalper designed for very short timeframes 1-5 min max.
At the same time due to the short timeframe, is recommend to re optimize it weekly .
Its components are
Fractals
Triple EMA with different lengths
Rules for entry:
For long : we have an up fractal and all 3 ema are in ascending order
For short: we have a down fractal and all 3 ema are in descending order.
Rules for exit
We exit when we either get a reverse order or when we hit the take profit or stop loss calculated in fixed pips.
