RSI Bands + Levels (Miu)This indicator was designed to plot lines from prices of overbought (OB) and oversold (OS) RSI levels in chart. It will also create a visible band between these levels.
It's main utility is to show in chart current and past prices for OB/OS RSI levels. Traditionally the RSI is considered overbought when above 70 and oversold when below 30 but you can customize these values in settings. The RSI oscillates between zero and 100.
Users can easily identify overbought and oversold prices using this indicator and then it is expected to help users to make better strategic decisions with their trades.
There are some extra options available in settings:
- Customizable RSI levels
- Customizable RSI length
- RSI Levels: if activated, it will draw lines above OB line and below OS line according to the multiplier, so it will plot sequential lines that goes in different RSI levels (e.g: RSI 72, 74, 76, 78 and 80).
- Backgroud only: it will remove these lines and keep only a backgroung color instead
- RSI 50: it will draw a line as RSI 50
- Customizable multiplier
Enjoy!
Göreceli Güç Endeksi (RSI)

K`s Extreme DurationExtreme duration uses a special combination of the RSI and its relative position to deliver a reversal signal.
The following are the conditions to generate signals:
* Bullish signal: The current 8-period RSI is below 50 and above 35 while the previous 5 RSI's are below 35.
* Bearish signal: The current 8-period RSI is above 50 and below 65 while the previous 5 RSI's are above 65.

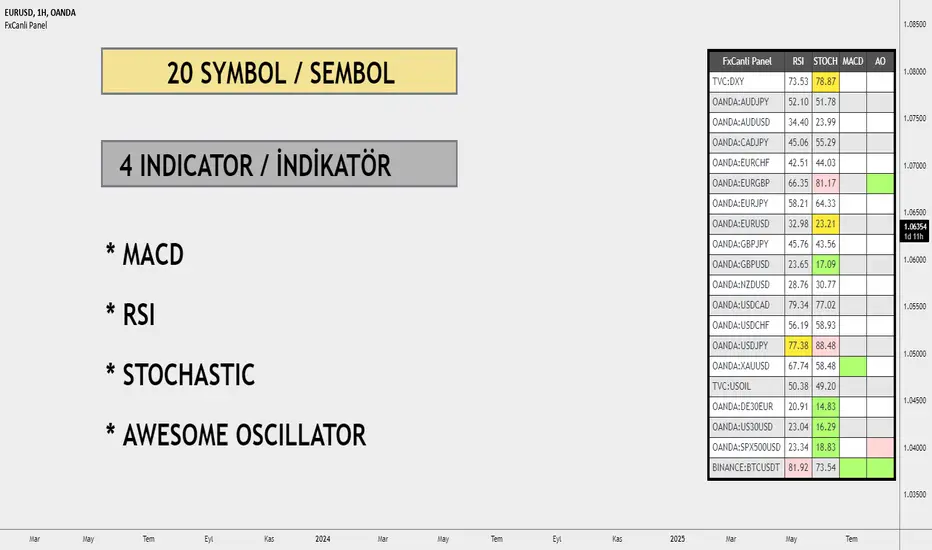
FxCanli PanelEN - FxCanli TradingView Panel Indicator shows the status of RSI, Stochastic, MACD and AO indicators in many TradingView symbols at the same time.
You can follow the market by geting an alarm instantly or at candle close about these indicators.
AT THE DEMO VERSION, YOU CAN FOLLOW ONLY 2 SYMBOL AT THE SAME TIME
TR - FxCanli TradingView Panel Göstergesi aynı anda birçok TradingView sembolünde RSI, Stokastik, MACD ve AO göstergelerinin durumunu gösterir.
Bu göstergeler hakkında anlık veya mum kapanışında alarm alarak piyasayı takip edebilirsiniz.
DEMO VERSİYONUNDA AYNI ANDA SADECE 2 SEMBOLÜ TAKİP EDEBİLİRSİNİZ
RSI Indicator details / RSI İndikatörü detayları
Green box / Yeşil Kutu
EN - At Over Sold Zone
TR - Aşırı Satım Bölgesinde
Pink box / Pembe Kutu
EN - At Over Bought Zone
TR - Aşırı Alım Bölgesinde
Yellow box / Sarı Kutu
EN - Exit from Over Bought/Sold Zone
TR - Aşırı Alım/Satım Bölgesinden Çıkınca
Stochastic Indicator details / Stochastic İndikatörü detayları
Green box / Yeşil Kutu
EN - At Over Sold Zone
TR - Aşırı Satım Bölgesinde
Pink box / Pembe Kutu
EN - At Over Bought Zone
TR - Aşırı Alım Bölgesinde
Yellow box / Sarı Kutu
EN - Exit from Over Bought/Sold Zone
TR - Aşırı Alım/Satım Bölgesinden Çıkınca
MACD Indicator details / MACD İndikatörü detayları
Green box / Yeşil Kutu
EN - MACD Line crossing UP SIGNAL Line
TR - MACD Çizgisi, SİNYAL Çizgisini YUKARI Keser
Pink box / Pembe Kutu
EN - MACD Line crossing DOWN SIGNAL Line
TR - MACD Çizgisi, SİNYAL Çizgisini AŞAĞI Keser
AO Indicator details / AO İndikatörü detayları
Green box / Yeşil Kutu
EN - AO crossing UP ZERO Level
TR - AO Sıfır Seviyesini YUKARI Keser
Pink box / Pembe Kutu
EN - AO crossing DOWN ZERO Level
TR - AO Sıfır Seviyesini ASAGI Keser
Alerts and Notifications / Alarm ve Bildirimler
EN - You can get ALL or ANY of these Alerts
TR - Herhangi birinin veya tamamının alarmlarını alabilirsiniz
DEMO - FxCanli PanelEN - FxCanli TradingView Panel Indicator shows the status of RSI, Stochastic, MACD and AO indicators in many TradingView symbols at the same time.
You can follow the market by geting an alarm instantly or at candle close about these indicators.
AT THE DEMO VERSION, YOU CAN FOLLOW ONLY 2 SYMBOL AT THE SAME TIME
TR - FxCanli TradingView Panel Göstergesi aynı anda birçok TradingView sembolünde RSI, Stokastik, MACD ve AO göstergelerinin durumunu gösterir.
Bu göstergeler hakkında anlık veya mum kapanışında alarm alarak piyasayı takip edebilirsiniz.
DEMO VERSİYONUNDA AYNI ANDA SADECE 2 SEMBOLÜ TAKİP EDEBİLİRSİNİZ
RSI Indicator details / RSI İndikatörü detayları
Green box / Yeşil Kutu
EN - At Over Sold Zone
TR - Aşırı Satım Bölgesinde
Pink box / Pembe Kutu
EN - At Over Bought Zone
TR - Aşırı Alım Bölgesinde
Yellow box / Sarı Kutu
EN - Exit from Over Bought/Sold Zone
TR - Aşırı Alım/Satım Bölgesinden Çıkınca
Stochastic Indicator details / Stochastic İndikatörü detayları
Green box / Yeşil Kutu
EN - At Over Sold Zone
TR - Aşırı Satım Bölgesinde
Pink box / Pembe Kutu
EN - At Over Bought Zone
TR - Aşırı Alım Bölgesinde
Yellow box / Sarı Kutu
EN - Exit from Over Bought/Sold Zone
TR - Aşırı Alım/Satım Bölgesinden Çıkınca
MACD Indicator details / MACD İndikatörü detayları
Green box / Yeşil Kutu
EN - MACD Line crossing UP SIGNAL Line
TR - MACD Çizgisi, SİNYAL Çizgisini YUKARI Keser
Pink box / Pembe Kutu
EN - MACD Line crossing DOWN SIGNAL Line
TR - MACD Çizgisi, SİNYAL Çizgisini AŞAĞI Keser
AO Indicator details / AO İndikatörü detayları
Green box / Yeşil Kutu
EN - AO crossing UP ZERO Level
TR - AO Sıfır Seviyesini YUKARI Keser
Pink box / Pembe Kutu
EN - AO crossing DOWN ZERO Level
TR - AO Sıfır Seviyesini ASAGI Keser
Alerts and Notifications / Alarm ve Bildirimler
EN - You can get ALL or ANY of these Alerts
TR - Herhangi birinin veya tamamının alarmlarını alabilirsiniz

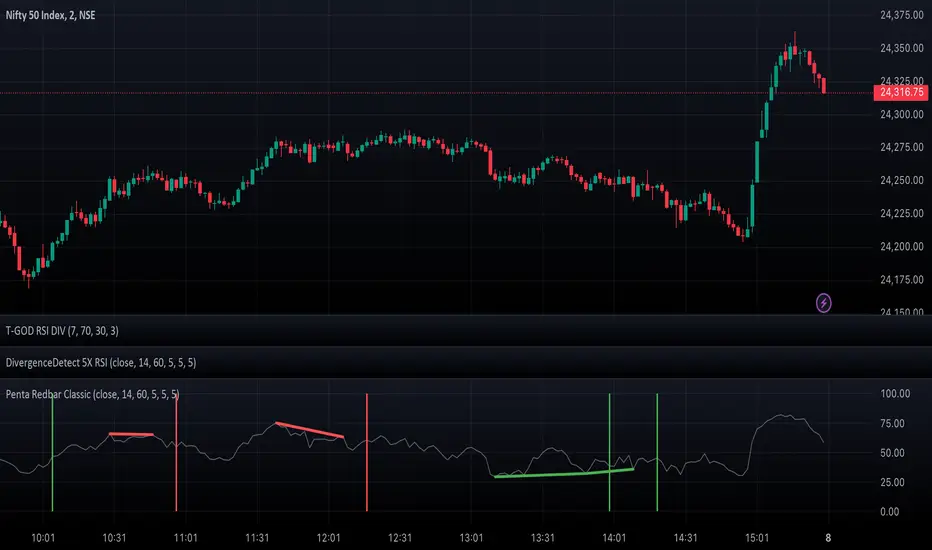
DivergenceDetect 5X RSIIntroducing the DivergenceDetect 5X RSI - a precision-engineered TradingView indicator tailored to spot RSI divergences over the span of the last 5 candles. Designed for both novice and professional traders, this tool aids in unveiling potential market reversals, providing timely alerts to guide your trading decisions. With its straightforward integration and user-friendly interface, staying a step ahead in the market has never been easier.
Feel free to adjust based on any additional features or specifics of your tool!
SpiceIn the chart photo is a description for each shape and letter, saying what each one is.
BB, Reversals are off by default.
BB + Reversals + Next bar confirmation - The way this should be used is by waiting for a 1 or 2 bar confirmation closed above/below the high/low of the Reversal candle. So if its a Top R, a yellow box will print as a confirmed 1 bar if it closed below the top R's low, then you can wait for the second bar to close also below the Top R's low. Vice versa with the Bot R.
RSI arrows - Essentially showing you when the multi time frame RSIs are coming back up above 30, or below 70. Respective to what time frames you have selected.
Three Line Strike - A trend continuation candlestick pattern consisting of four candles
Leledc Exhaustion suggest the trend may be reversing. Combined with the moving average as a trend filter, the indicator can signal the end of a pull back and the continuation of the trend.
EMAs - Help measuring the trend direction over a period of time.
Credit to all these amazing creators -
Multi Timeframe RSI (LTF) by @millerrh
3 Line Strike by @Lij_MC 'MarketVision A'
Leledc Exhaustion by @glaz, used updated version by @Joy_Bangla
If anyone uses the BB reversals source code to put into their own indicator/strategy, you are free to do so. Just send me a message I'd love to see your work with it! :)
Thanks to Lij_MC's MarketVision A indicator for inspiring me to add more features. At first it was just the RSI Arrows and the BB reversals candles + Condition but then I found MarketVision A and loved the extra Leledc and 3 Line Strike features.
Hope you enjoy this Spice!
No Signal is 100% correct at what it's trying to do. Use caution when trading!
Practice Risk Management.

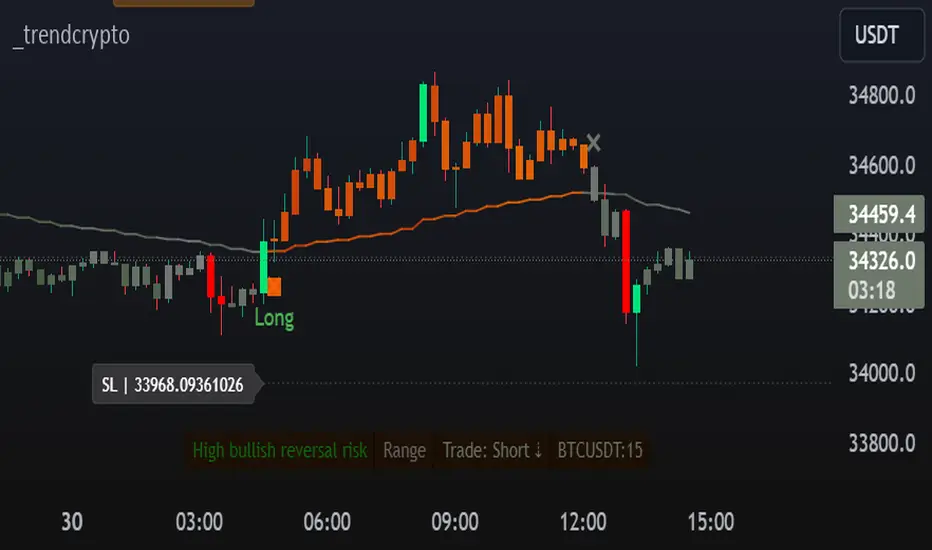
TrendCryptoThe _trendcrypto script is a trading strategy that uses a variety of indicators to identify potential trading opportunities, including the Parabolic SAR, ADX, and RSI.
The script first calculates the RMA, SMA, and trend direction. The RMA is a moving average that is weighted more heavily towards recent prices. The SMA is a simple moving average that gives equal weight to all prices in the period. The trend direction is calculated by comparing the current price to the price a certain number of periods ago.
The script then uses the RMA, SMA, and trend direction to identify potential trading opportunities. If the current price is above the RMA and the trend direction is up, the script will generate a buy signal. If the current price is below the RMA and the trend direction is down, the script will generate a sell signal.
The script also calculates the Parabolic SAR, which is a technical indicator that helps traders identify potential trend reversals. The Parabolic SAR is calculated using a formula that takes into account the high and low prices of a security over a specified period of time.
The script also calculates the ADX, which is a trend strength indicator. The ADX is calculated using a formula that takes into account the difference between the high and low prices of a security, as well as the difference between the closing price and the previous close.
The script also calculates the RSI, which is a momentum indicator that measures the magnitude of recent price changes to evaluate overbought or oversold conditions in the price of a stock or other asset. The RSI is calculated over a specified period of time, and the default value in the code is 14.
The script also allows users to specify a stop loss and take profit level for each trade. The default stop loss level is 4% and the default take profit level is 7%.
RSI Heatmap Screener [ChartPrime]The RSI Heatmap Screener is a versatile trading indicator designed to provide traders and investors with a deep understanding of their selected assets' market dynamics. It offers several key features to facilitate informed decision-making:
█ Custom Asset Selection:
The user can choose up to 30 assets that you want to analyze, allowing for a tailored experience.
█ Adjustable RSI Length:
Customize your analysis by adjusting the RSI length to align with your trading strategy.
█ RSI Heatmap:
The heatmap feature uses various colors to represent RSI values:
█ Color coding for labels:
Grey: Signifies a neutral RSI, indicating a balanced market.
Yellow: Suggests overbought conditions, advising caution.
Pale Red: Indicates mild overbought conditions in a strong area.
Bright Red: Represents strong overbought conditions, hinting at a potential downturn.
Pale Green: Signals mild oversold conditions with signs of recovery.
Dark Green: Denotes full oversold conditions, with potential for a bounce.
Purple: Highlights extremely oversold conditions, pointing to an opportunity for a relief bounce.
█ Levels:
Central Plot and Zones: The central plot displays the average RSI of the selected assets, offering an overview of market sentiment. Overbought and oversold zones in red and green provide clear reference points.
█ Hover Labels:
Hover over an asset to access details on various indicators like VWAP, Stochastic, SMA, TradingView ranking, and Volume Rating. Bullish and bearish indicators are marked with ticks and crosses, and a fire emoji denotes heavily overextended assets.
█ TradingView Ranking:
Utilize the TradingView ranking metric to assess an asset's performance and popularity.
Thank you to @tradingview for this ranking metric.
█ Volume Rating:
Gain insights into trading volumes for more informed decision-making.
█ Oscillator at the Bottom:
The RSI average for the entire market, presented in a normalized format, offers a broader market perspective. Green indicates a favorable buying area, while red suggests market overextension and potential short or sell opportunities.
█ Heatmap Visualization:
Historical RSI values for each selected asset are displayed. Red indicates overbought conditions, while green signals oversold conditions, helping you spot trends and potential turning points.
This screener is designed to make entering the market simpler and more comprehensive for all traders and investors.

Machine Learning: Optimal RSI [YinYangAlgorithms]This Indicator, will rate multiple different lengths of RSIs to determine which RSI to RSI MA cross produced the highest profit within the lookback span. This ‘Optimal RSI’ is then passed back, and if toggled will then be thrown into a Machine Learning calculation. You have the option to Filter RSI and RSI MA’s within the Machine Learning calculation. What this does is, only other Optimal RSI’s which are in the same bullish or bearish direction (is the RSI above or below the RSI MA) will be added to the calculation.
You can either (by default) use a Simple Average; which is essentially just a Mean of all the Optimal RSI’s with a length of Machine Learning. Or, you can opt to use a k-Nearest Neighbour (KNN) calculation which takes a Fast and Slow Speed. We essentially turn the Optimal RSI into a MA with different lengths and then compare the distance between the two within our KNN Function.
RSI may very well be one of the most used Indicators for identifying crucial Overbought and Oversold locations. Not only that but when it crosses its Moving Average (MA) line it may also indicate good locations to Buy and Sell. Many traders simply use the RSI with the standard length (14), however, does that mean this is the best length?
By using the length of the top performing RSI and then applying some Machine Learning logic to it, we hope to create what may be a more accurate, smooth, optimal, RSI.
Tutorial:
This is a pretty zoomed out Perspective of what the Indicator looks like with its default settings (except with Bollinger Bands and Signals disabled). If you look at the Tables above, you’ll notice, currently the Top Performing RSI Length is 13 with an Optimal Profit % of: 1.00054973. On its default settings, what it does is Scan X amount of RSI Lengths and checks for when the RSI and RSI MA cross each other. It then records the profitability of each cross to identify which length produced the overall highest crossing profitability. Whichever length produces the highest profit is then the RSI length that is used in the plots, until another length takes its place. This may result in what we deem to be the ‘Optimal RSI’ as it is an adaptive RSI which changes based on performance.
In our next example, we changed the ‘Optimal RSI Type’ from ‘All Crossings’ to ‘Extremity Crossings’. If you compare the last two examples to each other, you’ll notice some similarities, but overall they’re quite different. The reason why is, the Optimal RSI is calculated differently. When using ‘All Crossings’ everytime the RSI and RSI MA cross, we evaluate it for profit (short and long). However, with ‘Extremity Crossings’, we only evaluate it when the RSI crosses over the RSI MA and RSI <= 40 or RSI crosses under the RSI MA and RSI >= 60. We conclude the crossing when it crosses back on its opposite of the extremity, and that is how it finds its Optimal RSI.
The way we determine the Optimal RSI is crucial to calculating which length is currently optimal.
In this next example we have zoomed in a bit, and have the full default settings on. Now we have signals (which you can set alerts for), for when the RSI and RSI MA cross (green is bullish and red is bearish). We also have our Optimal RSI Bollinger Bands enabled here too. These bands allow you to see where there may be Support and Resistance within the RSI at levels that aren’t static; such as 30 and 70. The length the RSI Bollinger Bands use is the Optimal RSI Length, allowing it to likewise change in correlation to the Optimal RSI.
In the example above, we’ve zoomed out as far as the Optimal RSI Bollinger Bands go. You’ll notice, the Bollinger Bands may act as Support and Resistance locations within and outside of the RSI Mid zone (30-70). In the next example we will highlight these areas so they may be easier to see.
Circled above, you may see how many times the Optimal RSI faced Support and Resistance locations on the Bollinger Bands. These Bollinger Bands may give a second location for Support and Resistance. The key Support and Resistance may still be the 30/50/70, however the Bollinger Bands allows us to have a more adaptive, moving form of Support and Resistance. This helps to show where it may ‘bounce’ if it surpasses any of the static levels (30/50/70).
Due to the fact that this Indicator may take a long time to execute and it can throw errors for such, we have added a Setting called: Adjust Optimal RSI Lookback and RSI Count. This settings will automatically modify the Optimal RSI Lookback Length and the RSI Count based on the Time Frame you are on and the Bar Indexes that are within. For instance, if we switch to the 1 Hour Time Frame, it will adjust the length from 200->90 and RSI Count from 30->20. If this wasn’t adjusted, the Indicator would Timeout.
You may however, change the Setting ‘Adjust Optimal RSI Lookback and RSI Count’ to ‘Manual’ from ‘Auto’. This will give you control over the ‘Optimal RSI Lookback Length’ and ‘RSI Count’ within the Settings. Please note, it will likely take some “fine tuning” to find working settings without the Indicator timing out, but there are definitely times you can find better settings than our ‘Auto’ will create; especially on higher Time Frames. The Minimum our ‘Auto’ will create is:
Optimal RSI Lookback Length: 90
RSI Count: 20
The Maximum it will create is:
Optimal RSI Lookback Length: 200
RSI Count: 30
If there isn’t much bar index history, for instance, if you’re on the 1 Day and the pair is BTC/USDT you’ll get < 4000 Bar Indexes worth of data. For this reason it is possible to manually increase the settings to say:
Optimal RSI Lookback Length: 500
RSI Count: 50
But, please note, if you make it too high, it may also lead to inaccuracies.
We will conclude our Tutorial here, hopefully this has given you some insight as to how calculating our Optimal RSI and then using it within Machine Learning may create a more adaptive RSI.
Settings:
Optimal RSI:
Show Crossing Signals: Display signals where the RSI and RSI Cross.
Show Tables: Display Information Tables to show information like, Optimal RSI Length, Best Profit, New Optimal RSI Lookback Length and New RSI Count.
Show Bollinger Bands: Show RSI Bollinger Bands. These bands work like the TDI Indicator, except its length changes as it uses the current RSI Optimal Length.
Optimal RSI Type: This is how we calculate our Optimal RSI. Do we use all RSI and RSI MA Crossings or just when it crosses within the Extremities.
Adjust Optimal RSI Lookback and RSI Count: Auto means the script will automatically adjust the Optimal RSI Lookback Length and RSI Count based on the current Time Frame and Bar Index's on chart. This will attempt to stop the script from 'Taking too long to Execute'. Manual means you have full control of the Optimal RSI Lookback Length and RSI Count.
Optimal RSI Lookback Length: How far back are we looking to see which RSI length is optimal? Please note the more bars the lower this needs to be. For instance with BTC/USDT you can use 500 here on 1D but only 200 for 15 Minutes; otherwise it will timeout.
RSI Count: How many lengths are we checking? For instance, if our 'RSI Minimum Length' is 4 and this is 30, the valid RSI lengths we check is 4-34.
RSI Minimum Length: What is the RSI length we start our scans at? We are capped with RSI Count otherwise it will cause the Indicator to timeout, so we don't want to waste any processing power on irrelevant lengths.
RSI MA Length: What length are we using to calculate the optimal RSI cross' and likewise plot our RSI MA with?
Extremity Crossings RSI Backup Length: When there is no Optimal RSI (if using Extremity Crossings), which RSI should we use instead?
Machine Learning:
Use Rational Quadratics: Rationalizing our Close may be beneficial for usage within ML calculations.
Filter RSI and RSI MA: Should we filter the RSI's before usage in ML calculations? Essentially should we only use RSI data that are of the same type as our Optimal RSI? For instance if our Optimal RSI is Bullish (RSI > RSI MA), should we only use ML RSI's that are likewise bullish?
Machine Learning Type: Are we using a Simple ML Average, KNN Mean Average, KNN Exponential Average or None?
KNN Distance Type: We need to check if distance is within the KNN Min/Max distance, which distance checks are we using.
Machine Learning Length: How far back is our Machine Learning going to keep data for.
k-Nearest Neighbour (KNN) Length: How many k-Nearest Neighbours will we account for?
Fast ML Data Length: What is our Fast ML Length? This is used with our Slow Length to create our KNN Distance.
Slow ML Data Length: What is our Slow ML Length? This is used with our Fast Length to create our KNN Distance.
If you have any questions, comments, ideas or concerns please don't hesitate to contact us.
HAPPY TRADING!

RSI MTF Panel [xdecow]This indicator shows the RSI of up to 10 different timeframes with various customization options:
Panel position
Panel orientation (vertical/horizontal)
Border width and color
Choose up to 10 time frames with RSI length and source
Background and text colors
Thresholds of overbought, oversold, uptrend, downtrend and no-trend zones to change the color of the RSI
Color debug mode

Strong Pullback Indicator [Rami_LB]Strong Pullback Indicator
Description:
The Strong Pullback Indicator is designed to identify potential pullbacks or even trend reversals by utilizing a specific candlestick pattern in conjunction with the Relative Strength Index (RSI). It is advised to employ this indicator in chart intervals of 15 minutes or higher, as intervals below 15 minutes may generate excessive false signals.
Working Mechanism:
Upon detecting the designated candlestick pattern, the indicator examines whether any of the last five candles exhibit RSI values below 30 or above 70 across at least four distinct time intervals, depending on whether the pattern is bullish or bearish. The RSI calculations incorporate eight different intervals: 1 minute (1m), 5 minutes (5m), 15 minutes (15m), 30 minutes (30m), 1 hour (1h), 2 hours (2h), 4 hours (4h), and 1 day (1d). An arrow is rendered above or below the current candle only when these conditions are met.
Users have the option to adjust the number of overbought or oversold intervals, as well as the general settings for the RSI.
SL/TP Lines:
The indicator can also serve as a trade signal to initiate trades in the opposite direction. To evaluate the potential success of a trade in a backtesting scenario, SL (Stop Loss) and TP (Take Profit) lines can be displayed on the chart. The SL is calculated by taking the distance from the close of the current candle to the high/low of the previous candle and multiplying it by 2.
In the settings, you can alter the Risk Reward Ratio (RRR) of the trade. Given the pullback nature of this indicator, a RRR of 1:1 is deemed logical, thus set as the default value.
Bullish vs. Bearish Candle Counter:
An additional feature of this indicator is its ability to analyze the last 100 candles to ascertain the ratio of bullish to bearish candles. When a 60% threshold is reached, the chart background color alters accordingly. This feature was conceived after a thorough analysis of over 50,000 candles of a currency pair revealed nearly identical counts of bullish and bearish candles, suggesting a market tendency to maintain this balance.
Within the settings, you have the flexibility to modify the number of candles to be analyzed and the percentage threshold for each candle type.
Should you have any ideas on how to enhance the accuracy of this indicator, or suggestions for other indicators that could improve the signals, feel free to leave a comment.

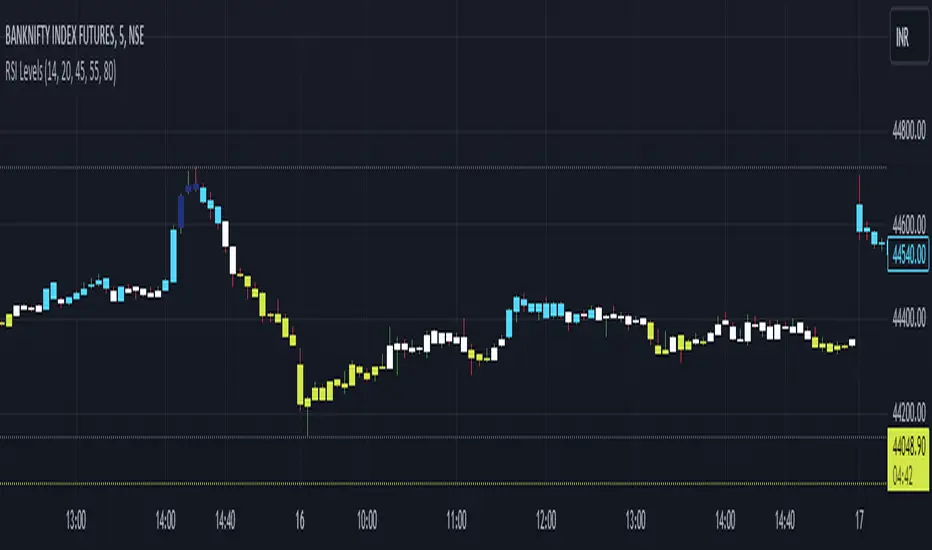
RSI Custom LevelsRSI Custom Levels is a "one stop shop" for a complete strategy based on RSI.
AS per principal: RSI oscillates between 0-100 and therefore the indicator is build around various parameters of RSI. It comprises of 4 different levels of RSI and therefore highlights the candles accordingly.
Understanding each LEVEL:
Level 1 (Highlight): Highlights candles that have an RSI value (closing basis) less than Level 1 specified value (default 20)
Level 2 (Highlight): Highlights candles that have an RSI value (closing basis) greater than Level 1 specified value (default 20) and less than Level 2 specified value (default 45)
Level 4 (Highlight): Highlights candles that have an RSI value (closing basis) greater than Level 4 specified value (default 80)
Level 3 (Highlight): Highlights candles that have an RSI value (closing basis) greater than Level 3 specified value (default 55) and less than Level 4 specified value (default 80)
The most efficient way to trade is as follows:
TRENDING SETUPS:
Uptrend Setups: When RSI enters Level 3 with exit at Level 4
Downtrend Setups: When RSI enters Level 2 with exit at Level 1
SIDEWAYS APPLICATION:
When RSI is in between Level 2 and 3 that area has no highlights as the system considers it to be FLAT and non oscillating.
OVERSTRETCHED APPLICATIONS:
Downtrend Reversal: When RSI enters Level 2 from Level 1 that is a sign for a downtrend reversal.
Uptrend Reversal: When RSI enters Level 3 from Level 2 that is a sign for a uptrend reversal.
Moreover the most ideal scenario is to convert the colour of all candles into white (in dark theme) or black(in light theme) for best performance.
TTP Pair CipherPair Cipher can run your hedge pair trading strategy.
Pair cipher can use a spread chart (two assets ratio or difference) to manage a hedge position consisting of two assets: one long and one short position.
Event though the spread chart is used to determine the entries and exits each coin price action is used to calculate floating PNL.
It supports different bot platforms. It's backtestable and can run live.
Features:
- Internal and external entry signal
- In-chart realised PNL plot
- Hedge position floating PNL chart
- Individual floating PNL for each long and short ("show coins" toggle)
- Retracement exit strategy: determine at which retracement factor to exit your position while in profit
- PNL RSI exit strategy: determine at which RSI level crossunder you'd like to exit. RSI is applied to the floating PNL
- Static TP/SL levels
- ATR TP/SL levels with individual factors. When ATR is selected the TP or SL acts as a multiplier of ATR instead.
- On-chart debug labels for alerts
- Intra candle alert: signals can trigger intra candle in this mode, but this mode will cause repainting. Example: if the position goes below SL intra candle, the alert will be sent, but later if it goes in profit before closing the candle, the backtest will continue with the position open. The backtest does NOT have access to the intra candle data. Alert intra candle reduces the risk of not applying SL.
Example of setup:
1) Load an empty 1 hour timeframe chart with the spread BYBIT:REQUSDT.P / BYBIT:REEFUSDT.P
2) Select an investment amount
3) Select TP 1.2 and enable ATR
4) Select SL 1.1 and enable ATR
5) Select RSI profits of crossunder 70
6) Don't enable external signal (you can try with TTP PNR)
7) Select BYBIT:REQUSDT.P as symbol 1
8) Select BYBIT:REEFUSDT.P as symbol 2

YD_Divergence_RSI+CMFThe ‘YD_Divergence_RSI+CMF’ indicator can find divergence using RSI (Relative Strength Index) and CMF (Chaikin Money Flow) indicators.
📌 Key functions
1. Search pivot high and pivot low points in a certain length of price.
2. Connect pivot high to pivot high , pivot low to pivot low , forming two standards for divergence in result.
The marker then plots only the higher high, lower low lines.
(higher low and lower high in prices are referred to hidden divergence, which are not considered in this indicator)
3. Compare the two standards with RSI and CMF indicators, send an alert if there is a divergence. As a result, the indicator will find four combination of divergence.
A. Higher high price / Lower RSI (Bearish RSI Divergence)
B. Lower low price / Higher RSI (Bullish RSI Divergence)
C. Higher high price / Lower CMF (Bearish CMF Divergence)
D. Lower low price / Higher CMF (Bullish CMF Divergence)
📌 Details
Developing the indicators, we put a lot of effort in making a customizable and user-friendly interface.
#1. Pivot Setting
Users can set the length to find the pivot high / pivot low in ‘Pivot Settings – Pivot Length.’
Increased pivot Length takes more candles to interpret the chart but reduce false signals since the it uses only the most certain pivot high / pivot low values. Obviously, decreased pivot length will act the opposite.
Users can choose whether to use ‘High/Low’ or ‘Close’ in ‘Pivot Reference’ to set the swing point of prices.
Users can also choose whether to display the pivot high / pivot low marker on the chart.
#2 RSI & CMF Settings
Users can adjust the length of RSI & CMF separately. (The default values are set to 14 and 20 each.)
#3 Label Setting
Users can adjust the text displayed on the chart label. (The default values is set to ‘Bullish / Bearish’, ‘RSI/CMF’, ‘Divergence’.)
Users can reduce the length of text label or simply turn the label off. Just click the ‘Bull/Bear’ or ‘None’ button. ‘Divergence’ works the same.
Users can decide whether to display the ‘Divergence Line and Label’, set custom settings for the label and line. (color, thickness, style, etc)
📌 Alert
Alert are provided as a combination of the chart's symbol and the set label text. For example,
‘BINANCE:BTCUSDT.P, Bullish RSI Divergence’
====================================================
"YD_Divergence_RSI+CMF" 지표 는 RSI와 CMF 지표를 이용해서 Divergence 를 찾아낼 수 있습니다.
📌 주요 기능
1. 정해진 가격 움직임 안에서 pivot high와 pivot low 포인트 를 찾아냅니다.
2. Pivot high로만 이어진 라인과, Pivot low로만 이어진 두 라인을 작도한 뒤 divergence의 기준으로 삼습니다.
이 지표에서는 normal divergence만 사용하기 때문에 차트에 higher high와 lower low만 표기 합니다.
(higher low와 lower high는 hidden divergence로 정의되며, 이 지표에서는 다루지 않습니다.
3. 두 기준선과 RSI, CMF 지표를 각각 비교하고, 결과적으로 4개의 조합을 구할 수 있습니다.
A. Higher high price / Lower RSI (Bearish RSI Divergence)
B. Lower low price / Higher RSI (Bullish RSI Divergence)
C. Higher high price / Lower CMF (Bearish CMF Divergence)
D. Lower low price / Higher CMF (Bullish CMF Divergence)
📌 세부 사항
지표를 개발하며 사용자들이 원하는 방향으로 지표를 설정할 수 있게 작업에 많은 공을 들였습니다. 굉장히 다양한 옵션을 선택할 수 있으며, 원하는 방식으로 지표를 사용할 수 있습니다.
#1 Pivot Setting
Pivot setting에서는 Pivot Length를 변경할 수 있습니다.
Pivot Length를 늘릴 경우, 보다 확실한 Swing High와 Swing Low만을 사용하게 되므로, False signal이 줄어들 수 있습니다. 하지만 Swing High/ Low를 판정하는 데에 더 긴 시간이 걸리게 되므로, Signal이 다소 늦게 발생하는 단점이 생기게 됩니다.
Pivot Length를 줄일 경우, 반대로 Swing High/Low의 판정이 더 빨리 일어나기 때문에, Signal을 거래에 이용하기는 좋을 수 있습니다. 다만, Swing High와 Low가 훨씬 더 잦은 빈도로 발생하기 때문에 False Signal을 줄 가능성이 높아집니다.
Pivot Reference에서는 가격의 Swing Point를 설정함에 있어, High/Low(고가/저가)를 이용할 지 Close (종가)를 이용할 지 선택할 수 있습니다.
Pivot High/Low Marker를 선택할 경우 Pivot High/ Low에 Marker가 찍히게 됩니다.
#2 RSI와 CMF Setting
RSI와 CMF Setting에서는 RSI와 CMF의 길이를 각각 설정할 수 있습니다. 기본값은 14와 20으로 설정되어 있습니다.
#3 Label Setting
Label Setting에서는 Label에 표시되는 글자를 선택할 수 있습니다.
기본값은 "Bullish / Bearish", "RSI/CMF", "Divergence"로 선택되어 있으며, 너무 길다고 느껴질 경우 "Bull/Bear" 혹은 "None"을 클릭하여 길이를 줄일 수 있습니다. 마찬가지로 Divergence의 경우도 생략이 가능합니다.
하단에서는 Divergence Line과 Label을 켜고 끌 수 있으며, 선의 색깔, 굵기, 종류, 그리고 Label의 색깔, 크기, 종류를 선택할 수 있습니다. Label의 Text 색 역시 변경이 가능합니다.
📌 얼러트
얼러트는 자신이 설정한 차트의 심볼과 Label의 문구의 조합으로 제공되며 예를 들면 다음과 같습니다.
"BINANCE:BTCUSDT.P, Bullish RSI Divergence"

Quantum VRSIThe VRSI indicator is another in the suite of volume indicators we have developed and one that complements our volume price analysis methodology perfectly. and was developed out of a desire to build further on our cornerstone of VPA by peeling back the layers of volume and considering the relative aspect of volume. Hence, the acronym of Volume Relative Strength Index indicator encapsulates what the indicator is all about.
By analyzing relative volume, we are able to see a visual representation of the pressure in a trend, or indeed the lack of pressure, and in doing so, present in a clear, intuitive, and colorful way whether the trend we are trading or considering joining is being driven with constant or rising pressure as it develops. If so, the indicator gives us that all-important ingredient: confidence—namely, the confidence to continue maintaining the position for as long as possible. However, equally important is when we see a trend that is tiring, with falling pressure, sending a strong signal it is time to close out. Alternatively, when there is little or no pressure in the trend, this is a signal to wait and be patient.
These signals are delivered in a variety of ways, primarily through a color change sequence of brighter or darker colors, but equally importantly, based on the height of each pressure bar and its relationship to its neighbor or groups of bars. And herein lies the close relationship to the volume price analysis methodology since the interpretation of both is about judging bars against one in terms of confirmation of trends, such as rising volume and rising pressure bars, or alternatively falling volume and falling pressure bars signaling that the trend is weakening.
The Volume Relative Strength Index indicator, or VRSI, embodies the core concept of volume-price analysis. It blends trading volume data with price to create an indicator for all the various markets and instruments, whether stocks, ETFs, futures, forex, or cryptocurrencies. The result is an intuitive visual representation of the market’s underlying bullish and bearish pressure in the form of an oscillating histogram with varying colors, with the central fulcrum at zero giving a clear indication when sentiment is shifting from bullish to bearish, or vice versa.
Now, for the first time, you can see the strength of the trend represented visually and clearly based on our two leading indicators of relative volume and price, giving you that essential ingredient we all seek: confidence. And just as with all our other indicators, we urge you to use it in multiple timeframes.

RSI PRECISION v.3RSI PRECISION v.3 (MACD, StochRSI, SMA Signals)
Developed by Giorgos Protonotarios (2021-2023)
RSI PRECISION is an alternative to the classic Relative Strength Index (RSI). The indicator aims to enhance the classic RSI and make it more accurate on longer timeframes. Additionally, the indicator works as an advanced signaling machine, offering five different categories of leading trading signals. RSI PRECISION is an ideal tool for analyzing highly volatile markets, such as cryptocurrency and small-cap stocks.
In this 3rd version, the core formula remains the same, however, there are new trading signals and a great number of new parameters. Traders have the opportunity to fully customize the indicator according to their needs.
What is new ?
The RSI formula remains the same, however, there are additional features:
• Selected StochRSI signals
• Low-timeframe SMA signal (<60 minutes)
• High-timeframe SMA signal (>60 minutes)
• SMA on the RSI PRECISION readings
• Ability to customize everything in settings (tooltips added)
Note: You can turn off any trading signal by unselecting it in Settings>Style.
□ NEW TRADING SIGNALS (v.3)
■ SELECTED STOCHRSI SIGNALS
The selected StochRSI signals are visualized by a cross (+) on the top and bottom of the indicator. The settings for StochRSI are the classic 8.5.3 (customizable). By default, the crossover is generated when StochRSI crosses above 25, and the crossunder when StochRSI crosses below 75.
(i) Bullish StochRSI cross
• Symbol: Cross (+) on the Top
• Event: StochRSI crosses above level 25
(ii) Bearish StochRSI cross
• Symbol: Cross (+) on the Bottom
• Event: StochRSI crosses below level 75
■ SMA CROSSOVERS (LOW/HIGH TIMEFRAMES)
These trading signals are generated when the price of an asset crosses above or below a preset SMA.
There are two different SMAs, one shown on low timeframes, and one on high timeframes. You can adjust the periods for both, by default 200 periods.
(i) Low-Timeframe SMA Cross (<60 minutes)
• Symbol: Bullish (↥) on the top of the indicator and bearish (↧) on the bottom
• Event: The price crosses above or below the selected SMA on low timeframes
(ii) High-Timeframe SMA Cross (>60 minutes)
• Symbol: Bullish (↥) on the top of the indicator and bearish (↧) on the bottom
• Event: The price crosses above or below the selected SMA on high timeframes
■ SMA LINE ON RSI PRECISION
This is just a simple SMA line on the RSI PRECISION readings. By default, it is set at 50 periods.
• SMA Line (blue-dashed)
You can turn it off by unselecting it in Settings>Style.
□ OLDER TRADING SIGNALS
The 3rd version of RSI PRECISION also includes all previous signals.
■ RSI PRECISION CROSSES
This signal corresponds to a bullish/bearish RSI PRECISION cross. By default, it is 5 for a bullish crossover and 100 for a bearish crossunder. These numbers are indicative and can be customized.
(i) Bullish RSI PRECISION Cross
• Symbol: Green arrow (▲) on the Top
• Event: RSI PRECISION crosses above level 5
(ii) Bearish RSI PRECISION Cross
• Symbol: Red arrow (▼) on the Bottom
• Event: RSI PRECISION crosses below level 100
■ MACD CROSSOVER SIGNALS
The MACD signals are visualized by a green/red dot (•). The default settings are the standard MACD settings (12,6,9).
(i) Bullish MACD cross
• Symbol: Green Dot (•) on the Top
• Event: MACD crosses above its signal line
(ii) Bearish MACD cross
• Symbol: Red Dot (•) on the Bottom
• Event: MACD crosses below its signal line
NOTE: In lower timeframes, MACD generates too many signals. You can switch off “MACD BULLISH & BEARISH CROSSOVERS” by clicking on ‘SETTINGS’, then ‘STYLE’, and then unselecting ‘Bullish MACD Cross’ and ‘Bearish MACD Cross’.
■ GOLDEN/DEATH CROSSES (SMA CROSSOVERS)
The cross of the 50-day moving average above the 200-day moving average is called a golden cross, and it is considered a bullish signal. The cross of the 50-day moving average below the 200-day moving average is called a death cross, and it is considered a bearish signal.
The Golden/Death crosses are visualized by (X). By default, 50 periods for the fast SMA and 200 periods for the slow SMA (both are customizable).
(i) Bullish SMA Cross
• Symbol: (X) on the Top
• Event: The fast SMA crosses above the Slow SMA
(ii) Bearish RSI Cross
• Symbol: (X) on the Bottom
• Event: The fast SMA crosses below the Slow SMA
□ More about the Indicator
■ MISSION
Enhancing the classic Relative Strength Index (RSI) and making it more accurate on longer timeframes, during choppy market conditions, and especially near market tops/bottoms.
■ OBJECTIVES
(1) Creating a better RSI that works as an “All-in-one” indicator
(2) Identifying overbought/oversold market levels in a simple and user-friendly manner
(3) Making precise calculations near market tops and bottoms, where price volatility is always booming
(4) Making precise calculations on longer timeframes (weekly, monthly) where the classic RSI readings are hardly readable
(5) Offering five different categories of trading signals (RSI, StochRSI, MACD, Golden/Death Crosses, SMAs) in a single indicator
■ RSI PRECISION CALCULATIONS
The RSI PRECISION formula consists of three (3) different components:
(a) Relative Strength Index component (the classic RSI)
(b) Periodic Price Volatility component (PPV, essential)
(c) RSI Volatility component (less important)
RSI PRECISION FORMULA ADJUSTMENTS
(i) CLASSIC RSI
This measurement corresponds to the classic RSI. If the other two components of the formula are set to zero (0%), then by entering 100% here, the RSI PRECISION becomes identical to the classic RSI.
-By default, 100%
(ii) PERIODIC PRICE VOLATILITY -PPV
The Periodic Price Volatility (PPV) is an advanced measurement of price volatility and an essential component of the core RSI PRECISION formula. You can easily adjust the weight of PPV in the formula.
-By default, 100%
(iii) RSI VOLATILITY
This is an extra measurement of volatility. This time the focus is exclusively on periodic RSI volatility, not on price volatility.
-By default, 5%
■ FINAL THOUGHTS
RSI PRECISION v.3 is an improved RSI indicator offering five leading trading signals. Everything is combined in one place to create an all-in-one TA tool. I have been using it as my only indicator for quite some time.
As always, happy trading, and remember, if you want to rule the world, create code, not war.
□ Giorgos Protonotarios,
Financial Analyst, Building Web
(October 5th 2023)
