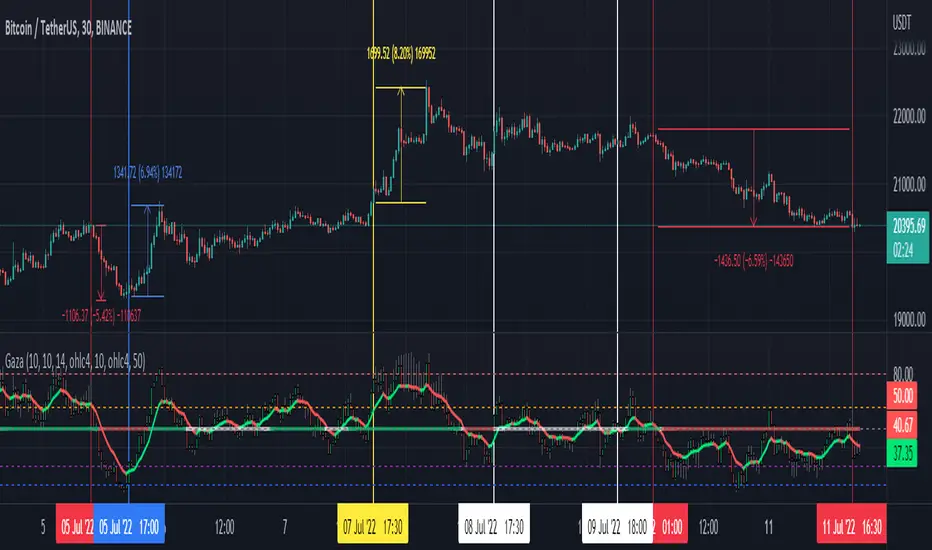
Koalafied RSI Decision PointsMomentum conditions as detailed in RSI : The Complete Guide by John Hayden
Decision points are conditions based on changes of these rsi values. Pauses in an uptrend, exiting high momentum values, breakouts and failures.
Touch up to an old script and so I thought I'd release. Although most people treat RSI as a reversion tool it is really a momentum indicator. Hopefully this script sparks thoughts about use-cases.
2:1 momentum is associated with RSI values of 66.67 and 33.33 respectfully. In an Uptrend an RSI value of 40 should not be broken and in a downtrend
a RSI value of 60 should not be exceeded. If so, then there is buying/selling pressure in the opposite direction (but not necessarily enough for a trend reversal).
Alternatively it may show the presence of HTF traders.
4:1 momentum (RSI values of 80/20) can be associated with extreme market conditions, typically thought of as being Overbought or Oversold.
Göreceli Güç Endeksi (RSI)

All TimeFrame OscillatorsI have always fighted to understand the market direction because it looks different on different timeframes.
I wanted an indicator where I can see all the different timeframes at once.
This indicator shows already existing oscillators but not only in the current chart's timeframe, but all the most important higer timeframes at once.
I have started with the stoch, then added as many oscillators as I could.
Experimenting with this I have saw that confluence of 4H 1D and 1W Stoch can be very interesting and can highlight higher timeframe take profit areas and sometimes major tops/bottoms.
Also bounces can be interesting when a lower timeframe stoch is bounced or rejected from a higher one.
Oscillators:
Stoch - Stochastic Oscillator
SMI - Stochastic Momentum Index
Rsi - Relative Strength Index
StochRsi - Stochastic RSI
WaveTrend - Vumanchu alias Market Cypher Wave Trend line
CCI - Commodity Channel Index
CCIStoch - Stochastic CCI
Williams Percent Range - Williams %R
Norm. MACD - Normalized Moving Average Convergence Divergence
Norm. MACD Hist - Normalized MACD Histogramm
PVT - Normalized Price Volume Trend
MFI - Money Flow Index
CMF - Chaikin Money Flow
Chande Momentum - Chande Momentum
Volume - Normalized Volume
CandleValue - Vumanchu alias Market Cypher MoneyFlow
BBWP - Bollinger Band Width Percentile
Line Type
Smooth: lines are smoothed, but the actualy not closed values are not shown
Step: Step lines, the actually open timeframes are calculated as they closed at the current values
Plot Oscillator or it's Slope:
its possible to not plot the oscillator but it's slope
Print dots when:
Cross Up/Down oversold/overbougt level - best for most oscillators. for example when Stoch crosses above 20 or below 80
Cross os/ob and the one higher TF is about to cross - when it's crosses beolw 80 and the higher timeframe oscillator is still above ans sloping down
Cross above/below middle line - for example on RSI being above or below 50 can be interesting
Print triangles when:
All Slope Match - all visible timeframe lines are pointing up or down at the same time
All above/belove middle line - all visible lines are above or belove the middle line
All above/belove middle line and slope match - like the previous one and the slope direction is the same
All above/below oversold/overbougt - all lines are above or below os/ ob. this is the default. it can be a very important confluence
Lower TF in order - 5, 15, 30, 60 minute timeframes are in order.
Higher TF in order - 4H 1D 1W in order (like 4H above 1D abd 1D above 1W). can be interesting at RSI
4H-1D in order - 4H 1D in order .
Print triangles
Print all triangles - print all triangles when the condition is met
Print only first triangles - only show when the condition starts to met
Print only last triangles - small triangles when the condition met first, large when last. tis is the default.
Timeframes to show:
You can turn on/off different timeframs to show or not from the list below:
1m 5m 15m 30m 1H 4H D 5D W M
This is for experimenting/ understanding the market direction on multiple timeframes at once.
Don't take it's signals (and any other indicator's) as exact trade signals. use it as confirmation instead.
Any comments, insights, ideas are welcome.

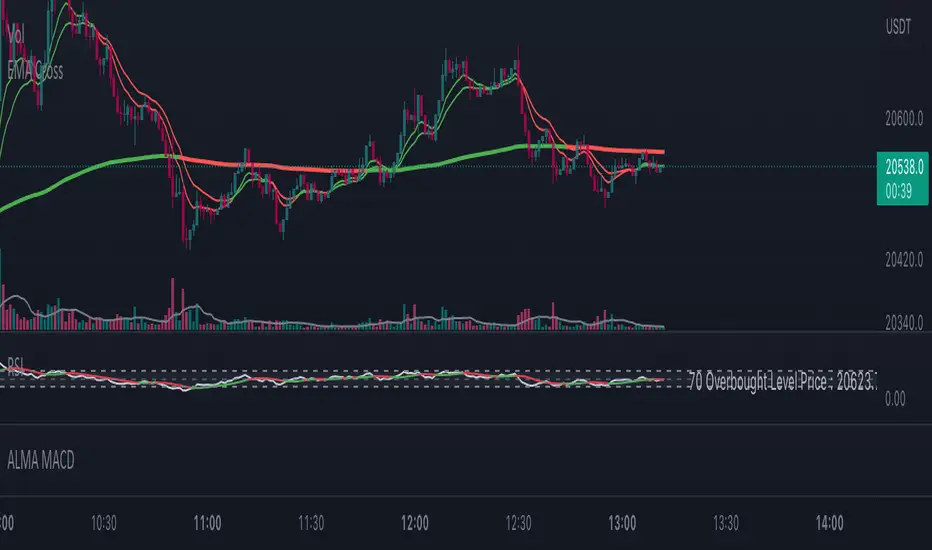
RSI + rCalcThis is a modification of the TradingView RSI.
I have added HMA and ALMA options to the MA settings and also the option for a colour change on RSI cross.
A reverse calc has also been added. This will display the MA cross/Overbought/Oversold price predictions. There is also the option to display an entered RSI or Price for a prediction display.
All colours and modifications can be turned on/off.
Enjoy! :)
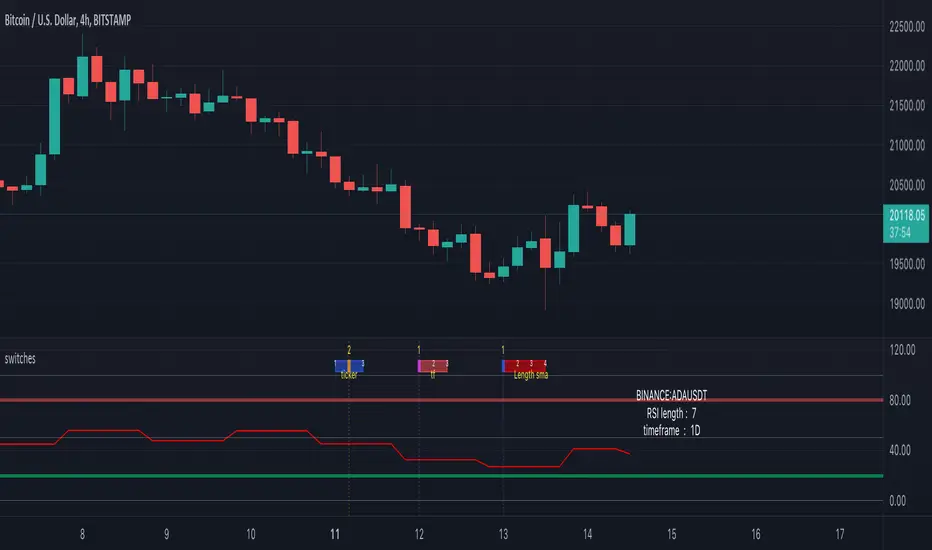
switches [experimental / tools]This scripts shows a tool which enables switching between settings without opening the settings
In this case you can switch between a RSI of 3 different tickers, 3 different higher timeframes, and 4 different lengths.
How does it work?
The position of a 'time line' is compared with the position of a box.
Changing the position of the line changes the settings.
The settings need to be set upfront though,
if you want to switch between length 7, 10, 14, 21 they need to be set first.
Example:
One wants to switch between RSI of SOLUSDT, ADAUSDT and FILUSDT
First set your tickers
-> Settings -> Set 1 -> Ticker
Then tap/click and move the line
And there you go!
The same with Timeframe and Length
Important:
It is not possible to automatically set the boxes/line at current time,
so these (settings -> date at Box, Line) need to be set in the beginning
Cheers!
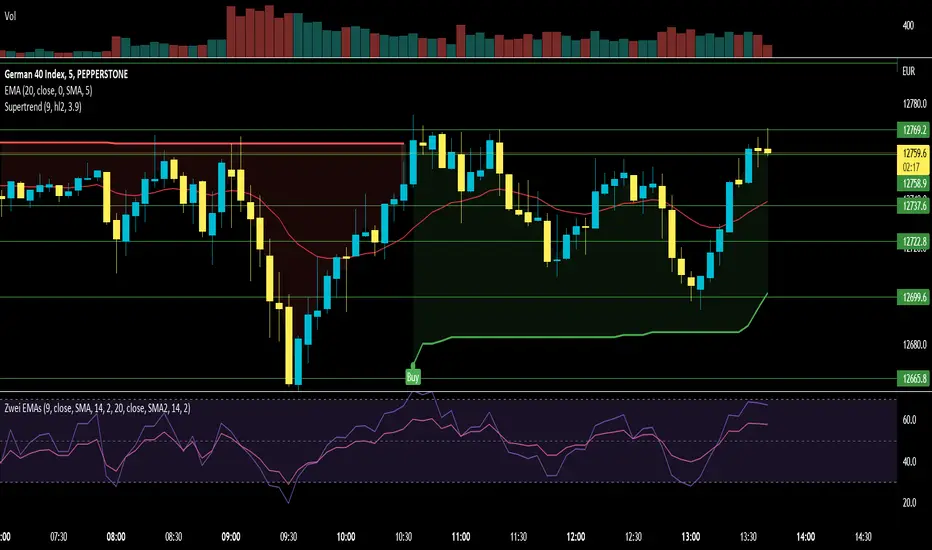
Zwei RSIFür McGranada, du alter Pfennigfuchser ;P
Beinhaltet einfach 2 Mal den Quellcode des Standard RSI.
RSI Potential Divergence - FontiramisuIndicator showing potential momentum divergences on RSI Momentum.
The problem with the classic divergence is that when the signal appears, it is sometimes too late to enter a trade.
The potential divergence corrects this problem by signaling the beginning of a potential divergence.
RSI is a momentum indicator that offers relevant insights with divergences.
Potential divergences are indicated with the letter B and a red color for Bearish Div or Green color for Bullish Div .
Potential divergence is confirmed when the line and the label "Bear"' or "Bull" appear.

Dragon Double RSI Overbought-Oversold With LabelThis indicator consist of tow RSI length that user can customize it. like length, overbought, oversold. like length, overbought, oversold. also it has one moving average where the user can select from different types of moving averages, price sources, lookback periods and resolutions

RSI Candles - Appa SoTradition RSI just shows the line as an indicator when the price candle is changed. So Indicator hasn't been able to offer open price RSI and close price at once. Rsi candles can make the user be able to see RSI open and close price is changed simultaneously with Candle form.
RSI 캔들 형태로 표현하여 open 가격과 close 가격의 RSI 데이타를 동시에 볼 수 있게 표현 하였습니다. - 제작: 압력밥소

Ultimate RSI With Some Spices★彡 𝓤𝓵𝓽𝓲𝓶𝓪𝓽𝓮 𝓡𝓢𝓘 𝓦𝓲𝓽𝓱 𝓢𝓸𝓶𝓮 𝓢𝓹𝓲𝓬𝓮𝓼 彡★
* Hi everybody here's the ★彡 𝓤𝓵𝓽𝓲𝓶𝓪𝓽𝓮 𝓡𝓢𝓘 𝓦𝓲𝓽𝓱 𝓢𝓸𝓶𝓮 𝓢𝓹𝓲𝓬𝓮𝓼 彡★ indicator and how to use it :
彡彡彡彡彡彡彡彡彡彡彡彡彡彡彡彡彡彡彡彡彡彡彡彡彡彡彡彡彡
First we have that red : green {RSI EMA Line}line in the indicator which show the current symbol situation \
𝐒𝐢𝐦𝐩𝐥𝐲 : 𝐢𝐟 𝐭𝐡𝐞 𝐥𝐢𝐧𝐞 𝐜𝐥𝐨𝐬𝐞 𝐰𝐢𝐭𝐡 𝐠𝐫𝐞𝐞𝐧 𝐜𝐨𝐥𝐨𝐫 𝐲𝐨𝐮 𝐜𝐚𝐧 𝐨𝐩𝐞𝐧 𝐚 𝐥𝐨𝐧𝐠 𝐭𝐫𝐚𝐝𝐞 𝐚𝐧𝐝 𝐞𝐱𝐢𝐭 𝐰𝐡𝐞𝐧 𝐭𝐡𝐞 𝐫𝐞𝐝 𝐜𝐨𝐥𝐨𝐫 𝐚𝐩𝐩𝐞𝐚𝐫𝐬
I𝐧 𝐭𝐡𝐞 𝐬𝐚𝐦𝐞 𝐭𝐢𝐦𝐞 𝐰𝐞 𝐡𝐚𝐯𝐞 𝐨𝐭𝐡𝐞𝐫 𝐭𝐡𝐢𝐧𝐠𝐬 𝐭𝐨 𝐮𝐬𝐞 𝐰𝐢𝐭𝐡 𝐭𝐡𝐚𝐭 𝐰𝐨𝐮𝐥𝐝 𝐡𝐞𝐥𝐩 𝐮𝐬 𝐭𝐨 𝐦𝐚𝐤𝐞 𝐚 𝐠𝐨𝐨𝐝 𝐨𝐫𝐝𝐞𝐫
Like The 𝐂𝐲𝐜𝐥𝐞𝐫 𝐬𝐢𝐭𝐮𝐚𝐭𝐢𝐨𝐧 𝐚𝐧𝐝 𝐟𝐢𝐛𝐨𝐧𝐚𝐜𝐜𝐢 𝐥𝐞𝐯𝐞𝐥𝐬
We have the 𝐧𝐞𝐱𝐭 𝐟𝐢𝐛𝐨𝐧𝐚𝐜𝐜𝐢 𝐥𝐞𝐯𝐞𝐥𝐬 𝟐𝟎 ,𝟑𝟎 ,𝟓𝟎 ,𝟔𝟏.𝟖 ,𝟖𝟎 { 61.8 𝐢𝐬 𝐭𝐡𝐞 𝐭𝐡𝐞 𝐟𝐢𝐛𝐨𝐧𝐚𝐜𝐜𝐢 𝐠𝐨𝐥𝐝𝐞𝐧 𝐫𝐚𝐭𝐢𝐨 }
About The 𝐂𝐲𝐜𝐥𝐞𝐫 you can use it to know where is the current symbol go { UP : Green ,| Down : Red ,| White : Where the symbol movement is in a slight fluctuation without any significant up or down }
░▒▓█ 𝐍𝐨𝐭𝐞 : 𝐓𝐡𝐞 𝐂𝐲𝐜𝐥𝐞𝐫 𝐥𝐢𝐧𝐞 𝐢𝐬 𝐭𝐡𝐞 𝐬𝐚𝐦𝐞 𝐟𝐢𝐛𝐨𝐧𝐚𝐜𝐜𝐢 𝐥𝐞𝐯𝐞𝐥 ' 𝐫𝐚𝐭𝐢𝐨 𝟓𝟎 ' █▓▒░
𝐡𝐞𝐫𝐞'𝐬 𝐚 𝐟𝐚𝐬𝐭 𝐩𝐡𝐨𝐭𝐨 𝐭𝐡𝐚𝐭 𝐬𝐡𝐨𝐰 𝐞𝐯𝐞𝐫𝐲𝐭𝐡𝐢𝐧𝐠
When the RSI EMA Line reach the purple 𝐟𝐢𝐛𝐨𝐧𝐚𝐜𝐜𝐢 level its a very good entry point where the RSI is over sold and ready to g oup again
When the RSI EMA Line reach the Golden 𝐟𝐢𝐛𝐨𝐧𝐚𝐜𝐜𝐢 level its a very important area in the line crossover it then it's a very amazing entry time but if the RSI EMA line crossunder this line then the price w'll drop down
❤❤❤❤ 𝐟𝐢𝐧𝐚𝐥𝐥𝐲 𝐇𝐚𝐯𝐞 𝐚 𝐠𝐨𝐨𝐝 𝐭𝐢𝐦𝐞 ❤❤❤❤
RSI PacingThe RSI Pacing indicator compares the movement of the RSI directly with the movement of the asset to help identify divergences.
Bullish Divergences
The RSI is increasing at a greater rate than the pace of the asset.
The RSI is decreasing at a lesser rate than the pace of the asset.
Bearish Divergences
The RSI is decreasing at a greater rate than the pace of the asset.
The RSI is increasing at a lesser rate than the pace of the asset.
Warning: Does not yet work on higher timeframes yet. Working on getting the pace normalized to the RSI's bounds.


RSI In-Chart Indicator with Candle StickSimplified RSI with in Chart Indicator for better analysis, What is does? it simply plot OB/OS over candles for better understanding. Also you can on/of candle stick along side in setting but the RSI is always on.
Candle stick Patterns
Three White Soldier (TWS)
Three Black Crows (TBS)

WSTF RSI2 IndicatorThis is the Indicator replicating the basic RSI(2) created by Wilders.
Buy condition:
(RSI(2) crossed under 10) & (close > EMA(200)) & (EMA(5) > close)
Sell condition:
(RSI(2) crossed over 90) & (close < EMA(200)) & (EMA(5) < close)
You can play around with the script by adjusting the RSI Values, EMA values and crossover & crossunder threshold.
We will update the script with new features in the futures.
Please don't hesitate to share some Ideas or Feedbacks, we would be happy to improve the script for you !
Have fun !
WS TradingFactory

OMA (One More Average) RSI Histogram [Loxx]OMA (One More Average) RSI Histogram is an RSI histogram built using the OMA adaptive moving average. This is meant to filter out the noise from regular RSI. You'll notice that it rarely signals, but the signals that do show up are perfectly set up for mean reversion/trend ATR-based trading.
What is the One More Moving Average (OMA)?
The usual story goes something like this : which is the best moving average? Everyone that ever started to do any kind of technical analysis was pulled into this "game". Comparing, testing, looking for new ones, testing ...
The idea of this one is simple: it should not be itself, but it should be a kind of a chameleon - it should "imitate" as much other moving averages as it can. So the need for zillion different moving averages would diminish. And it should have some extra, of course:
How to use
Green means buy
Red means sell
Included
Bar coloring

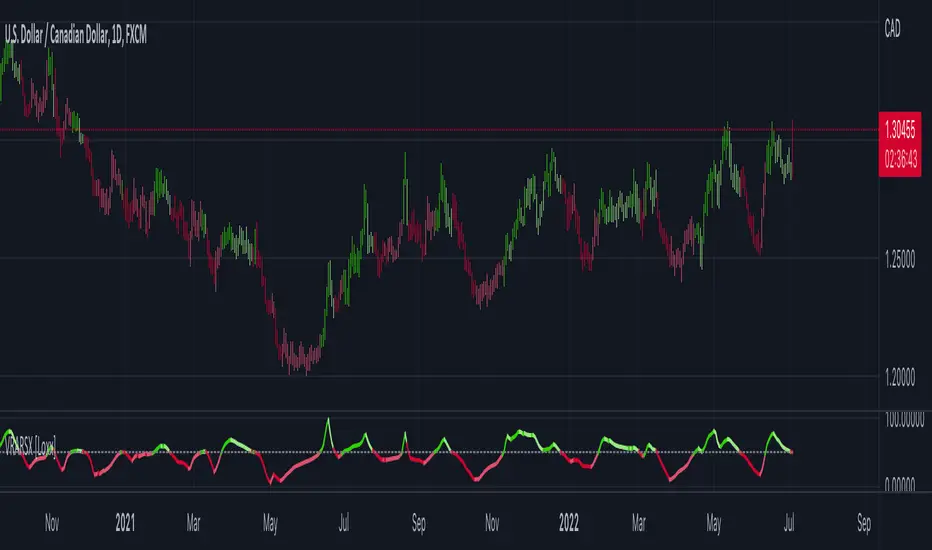
Volatility Ratio Adaptive RSX [Loxx]Volatility Ratio Adaptive RSX this indicator adds volatility ratio adapting and speed value to RSX in order to make it more responsive to market condition changes at the times of high volatility, and to make it smoother in the times of low volatility
What is RSX?
RSI is a very popular technical indicator, because it takes into consideration market speed, direction and trend uniformity. However, the its widely criticized drawback is its noisy (jittery) appearance. The Jurik RSX retains all the useful features of RSI, but with one important exception: the noise is gone with no added lag.
Included:
-Toggle on/off bar coloring
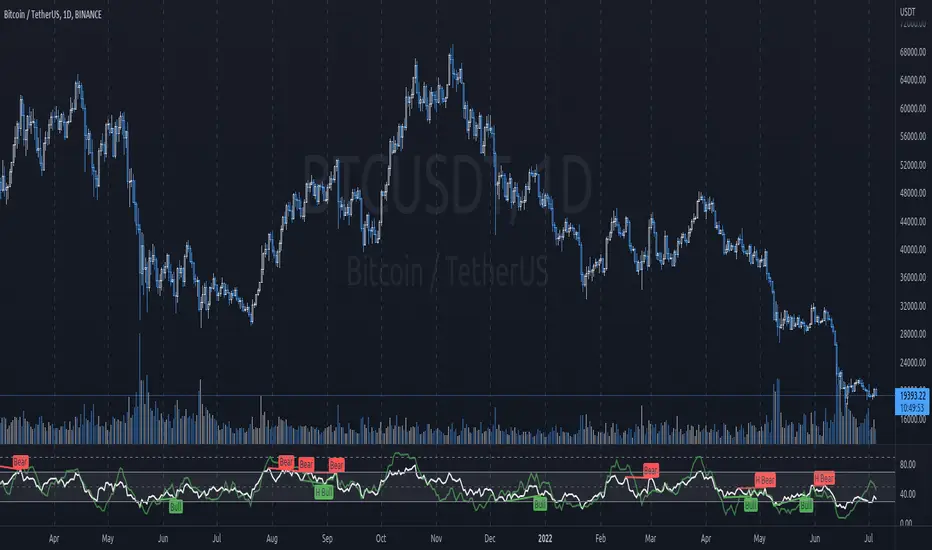
JG RSI/MFI/divergence IndicatorThis is a combination of
- RSI (relative strength index)
- MFI (money flow index)
- Divergences on the RSI
MFI behaves much the same as RSI but it more responsive/to some degree a leading indicator. I find it helps having this overlayed with RSI to help gauge price action and sentiment, as well as for confluence with RSI.
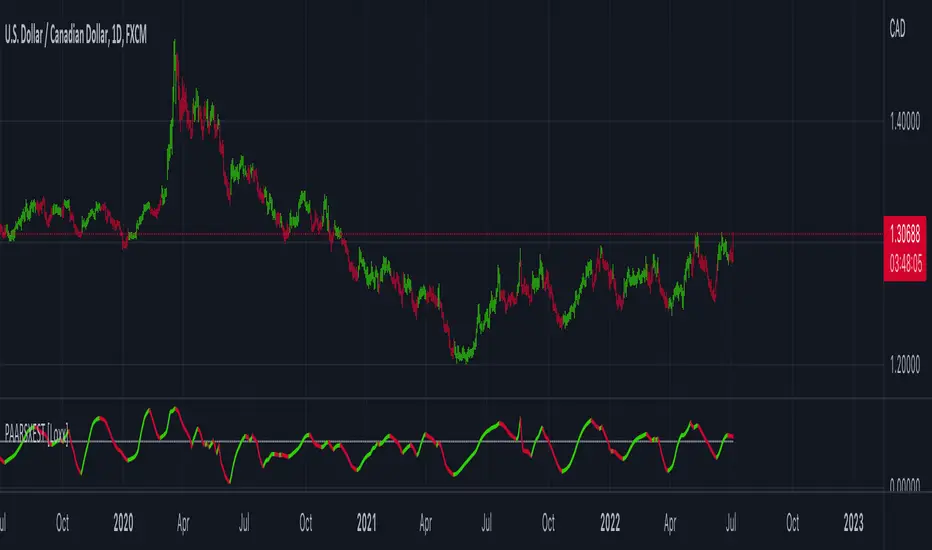
Phase-Accumulation Adaptive RSX w/ Expanded Source Types [Loxx]Phase-Accumulation Adaptive RSX w/ Expanded Source Types is a Phase Accumulation Adaptive Jurik RSX.
What is RSX?
RSI is a very popular technical indicator, because it takes into consideration market speed, direction and trend uniformity. However, the its widely criticized drawback is its noisy (jittery) appearance. The Jurk RSX retains all the useful features of RSI , but with one important exception: the noise is gone with no added lag.
What is Phase Accumulation?
The phase accumulation method of computing the dominant cycle is perhaps the easiest to comprehend. In this technique, we measure the phase at each sample by taking the arctangent of the ratio of the quadrature component to the in-phase component. A delta phase is generated by taking the difference of the phase between successive samples. At each sample we can then look backwards, adding up the delta phases.When the sum of the delta phases reaches 360 degrees, we must have passed through one full cycle, on average.The process is repeated for each new sample.
The phase accumulation method of cycle measurement always uses one full cycle’s worth of historical data.This is both an advantage and a disadvantage.The advantage is the lag in obtaining the answer scales directly with the cycle period.That is, the measurement of a short cycle period has less lag than the measurement of a longer cycle period. However, the number of samples used in making the measurement means the averaging period is variable with cycle period. longer averaging reduces the noise level compared to the signal.Therefore, shorter cycle periods necessarily have a higher out- put signal-to-noise ratio.
Included:
-Toggle on/off bar coloring
RSI - S&P Sector ETFsThe script displays RSI of each S&P SPDR Sector ETF
XLB - Materials
XLC - Communications
XLE - Energy
XLF - Financials
XLI - Industrials
XLK - Technology
XLP - Consumer Staples
XLRE - Real Estate
XLU - Utilities
XLV - Healthcare
XLY - Consumer Discretionary
It is meant to identify changes in sector rotation, compare oversold/overbought signals of each sector, and/or any price momentum trading strategy applicable to a trader.

ATR-Adaptive, Smoothed Laguerre RSI [Loxx]ATR-Adaptive, Smoothed Laguerre RSI is an adaptive Laguerre RSI indicator with smoothing to reduce noise
What is Laguerre RSI?
The Laguerre RSI indicator created by John F. Ehlers is described in his book "Cybernetic Analysis for Stocks and Futures".
This version:
Instead of using fixed periods for Laguerre RSI calculation, this indicator uses an ATR (average True Range) adapting method to adjust the calculation period. This makes the RSI more responsive in some periods (periods of high volatility), and smoother in order periods (periods of low volatility). Also this indicator adds an option to have smoothed source input including Loxx's Expanded Source Types.
Included
-Loxx's Expanded Source Types
-Bar coloring

RAS.V2 Strength Index OscillatorHeavily modified version of my previous "Relative Aggregate Strength Oscillator" -Added high/low lines, alma curves,, lrc bands, changed candle calculations + other small things. Replaces the standard RSI indicator with something a bit more insightful.
Credits to @wolneyyy - 'Mean Deviation Detector - Throw Out All Other Indicators ' And @algomojo - 'Responsive Coppock Curve'
And the default Relative Strength Index
The candles are the average of the MFI ,CCI ,MOM and RSI candles, they seemed similar enough in style to me so I created candles out of each and the took the sum of all the candle's OHLC values and divided by 4 to get an average, same as v1 but with some tweaks. Previous Peaks and Potholes visible with the blue horizontal lines which adjust when a new boundary is established. Toggle alma waves or smalrc curves or both to your liking. This indicator is great for calling out peaks and troughs in realtime, although is best when combined with other trusted indicators to get a consensus.

RSI Trend Heatmap in Multi TimeframesRSI Trend Heatmap in Multi Timeframes
Description
Sometimes you want to look at the RSI Trend across multiple time frames.
You have to waste time browsing through them.
So we've put together every time frame you want to see in one indicator.
We have 10 layers of RSI Trend heatmap available for you.
You can set the timeframe as you want on the Settings page.
Description of Parameter RSI Setting ** You can change it by setting.
RSI Trend Length : (Default 50)
Source : (Default close)
RSI Sideways Length : (Default 2 = RSI between 48 .. 52)
Description of Parameter RSI Timeframe ** You can change it by setting.
""=None,
"M"=1Month, "2W"=2Weeks, "W"=1Week,
"3D"=3Days, "2D"=2Days, "D"=1Day,
"720"=12Hours, "480"=4Hours, "240"=4Hours, "180"=3Hours, "120"=2Hours,
"60"=60Minutes, "30"=30Minutes, "15"=15Minutes, "5"=5Minutes, "1"=1Minute
Default Configurate of RSI Timeframe (for a time frame of 1 hour to 1 day)
"W"= Timeframe 1 month shown in line 90-100 --> Represent Long Trend of RSI
---------------------------------------
"D2"= Timeframe 2 days shown in line 70-80 --> Represent Trend of RSI
"D"= Timeframe 1 day shown in line 60-70 --> Represent Trend of RSI
---------------------------------------
"240"= Timeframe 3 hours shown in line 40-50 --> Represent Signal Up/Signal Down/Divergence of RSI
"120"= Timeframe 2 hours shown in line 30-40 --> Represent Signal Up/Signal Down/Divergence of RSI
"60"= Timeframe 1 hour shown in line 20-30 --> Represent Signal Up/Signal Down/Divergence of RSI
"30"= Timeframe 30 minutes shown in line 10-20 --> Represent Signal Up/Signal Down/Divergence of RSI
"15"= Timeframe 15 minutes shown in line 00-10 --> Represent Signal Up/Signal Down/Divergence of RSI
Description of Colors
Dark Bule = Extreme Uptrend / Overbought / Bull Market (RSI > 67)
Light Bule = Uptrend (RSI between 50-52 .. 67)
Yellow = Sideways Trend / Trend Reversal (RSI between 48 .. 52) ** You can change it by setting.
Light Red = Downtrend (RSI between 33 .. 48-50)
Dark Red = Extreme Downtrend / Oversold / Bear Market (RSI < 33)
How to use
1. You must first know what the main trend of the RSI is (look at the 60-80 line). If it is red, it is a downtrend. and if it's blue shows that it is an uptrend
2. Throughout the period of the main trend There will always be a reversal of the sub-trend. (Can see from the 0-50 line), but eventually will return to follow the main trend.
3. Unless the sub trend persists for a long time until the main trend changes.

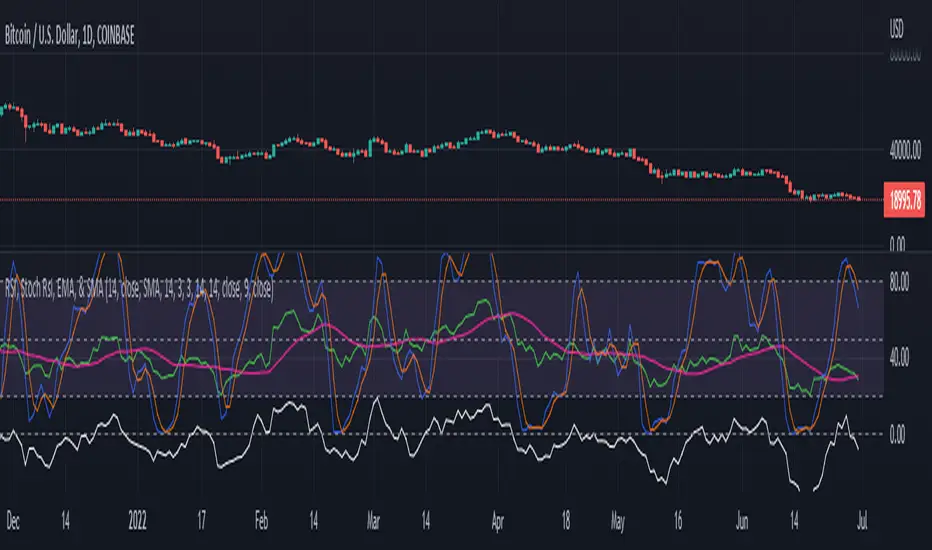
RSI, Stoch Rsi, EMA, SMA, & ROCThis indicator is simply an enhanced version of the RSI followed up by a few extra indicators that pair strongly with the RSI. This indicator allows the user to interact with various inputs based off the indicators provided. All indicators include moving average, relative strength index, stochastic relative strength index, simple moving average, exponential moving average, and rate of change. This program is unique as it is very versatile allowing the user to use as little or as many indicators as needed interchangeably.
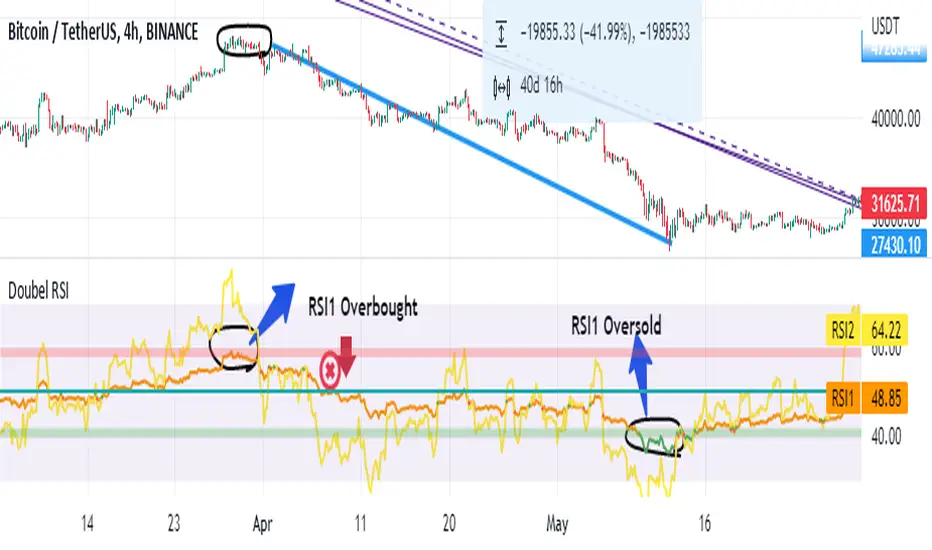
Dragon Double RSIMost important thing is feeling inspired and relaxed. Forcing your way into anything under stress and pressure will only end up in disaster
This indicator consists of three RSIs.
RSI: RSI is common and its length is 14.
RSI 1: The slowest RSI. The length is 100.
RSI 2: Faster than RSI 1. The length is 50.