Fixed Reference Ratio ChartThis study does a division ("/") between the ticker to benchmark symbol. It works only on day timeframe.
Often referred to as spread charts or ratio charts this is often used to measure the strength and performance of a script vis-a-vis a benchmark index. In this study, the comparison is plotted from a fixed reference session. On the current bar, the percentage change of the current ratio to the reference ratio is displayed as a label down icon, rounded to nearest integer. There are options to plot either a candle plot or line plot. The reference date can also be changed from the input dialog.
In the example above, 13-Feb-2020 is chosen as the reference date. Ratios are plotted from this reference date onwards. At the latest bar, the "60%" displays the percentage difference between ratio on 13-Feb-2020 and current date, 09-Sep-2020. This means RELIANCE performed 60% better than the benchmark NIFTY50 since 13-Feb-2020.
Relativestrength
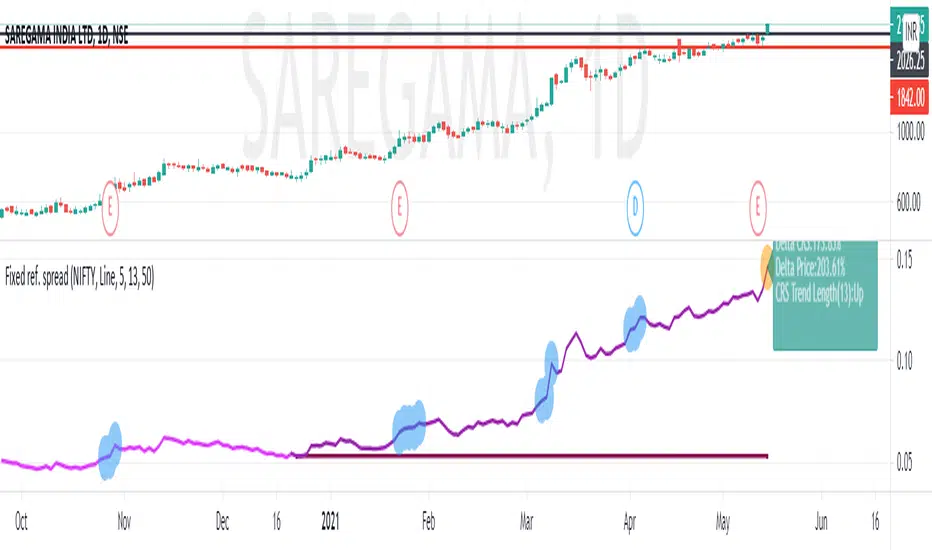
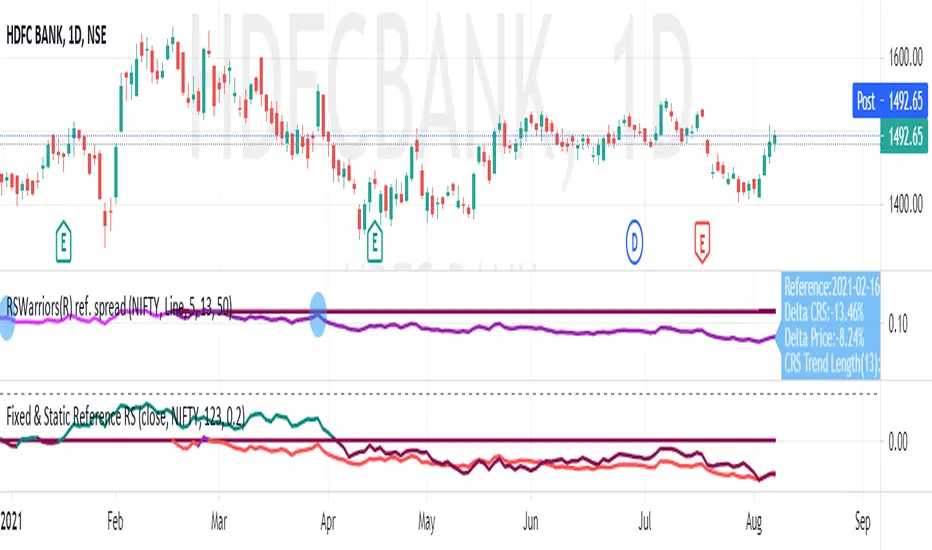
Fixed Reference Relative StrengthRelative Strength based on a fixed reference session date. This study works on day timeframe only.
The idea here is to "fix" a reference trading session day. The relative strength of subsequent candles are measured based on this reference day only. Relative strengths of bars before this bar is irrelevant and not plotted. As the plotting of the bars advances, the length is automatically adjusted so that the base reference is the "fixed" reference only. The RS value is multiplied by 100 to give a percentage value.
The other Relative Strength indicators that I have published (and other Relative Strength scripts generally available on TradingView), generally take a fixed length as input and that has to be advanced each trading session. What this results into is that only the "latest bar" RS is compared to the "reference" session date. All the RS values prior to this latest bar is actually compared to days previous to the reference date.
In the example above, we have input 13-Feb-2020 as the "fixed" reference trading session day. Starting from 14-Feb-2020, each session day, we calculate the RS always with respect to 13-Feb-2020, unlike the other scripts. When the RS value of today, 08-Sep-2020 is being calculated, it is using 13-Feb-2020 (as the other scripts do when the length is advanced one day each trading session day). However, when the RS value of 07-Sep-2020 is being calculated today (08-Sep-2020), it is still using 13-Feb-2020 as the reference. In the other scripts, a calculation of RS for 07-Sep-2020 on 08-Sep-2020 would have taken 12-Feb-2020 as the reference value.
This plot thus gives the exact performance of the script with respect to the benchmark index from the fixed reference each day. A performance trend is therefore possible to do on this plot.
ElearnMarkets CRSHi Everyone,
How it works?
1. With this indicator you can compare any other symbol of index/security with selected symbol.
2. You can compare with three different Indices/symbols.
3. Also you can keep different timeframe to compare with the current symbol.
4. No need to add multiple indicators for same purpose.
Feel free to suggest any changes to the indicator.
I hope this indicatory could help you achieve what you expect.
Thanks,
Yogesh

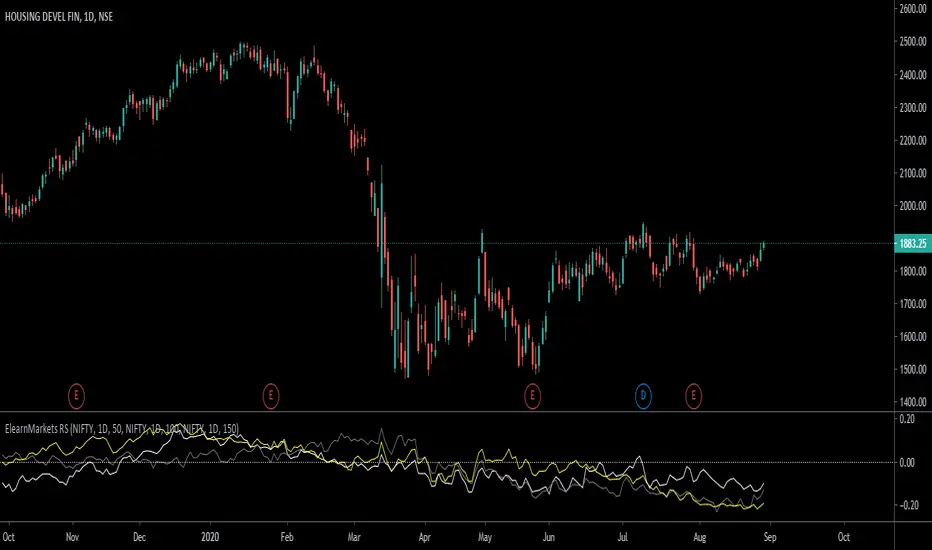
ElearnMarkets RSHow it works?
1. With this indicator you can compare any other symbol of index/security with selected symbol.
2. You can compare with three different Indices/symbols.
3. Also you can keep different timeframe and length of period to compare with the current symbol.
4. No need to add multiple indicators for same purpose.
Thanks,
Yogesh
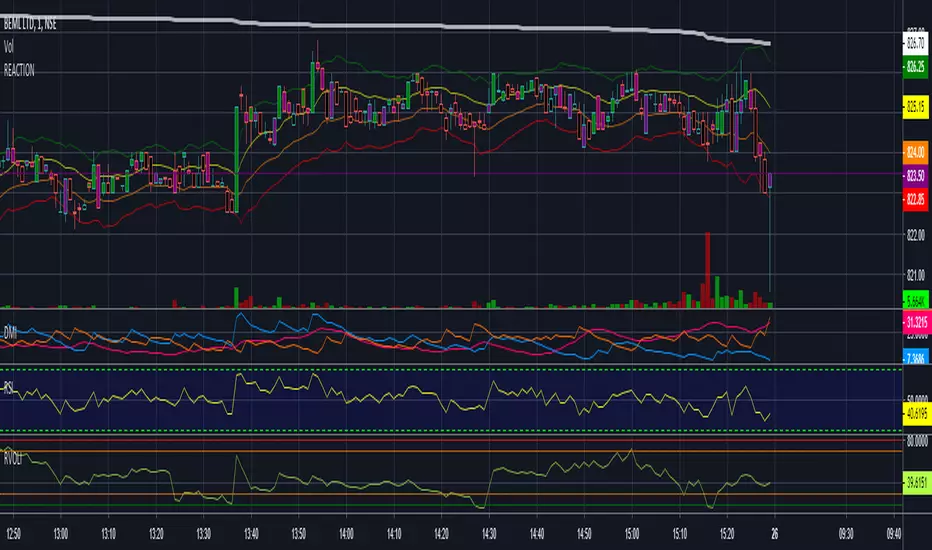
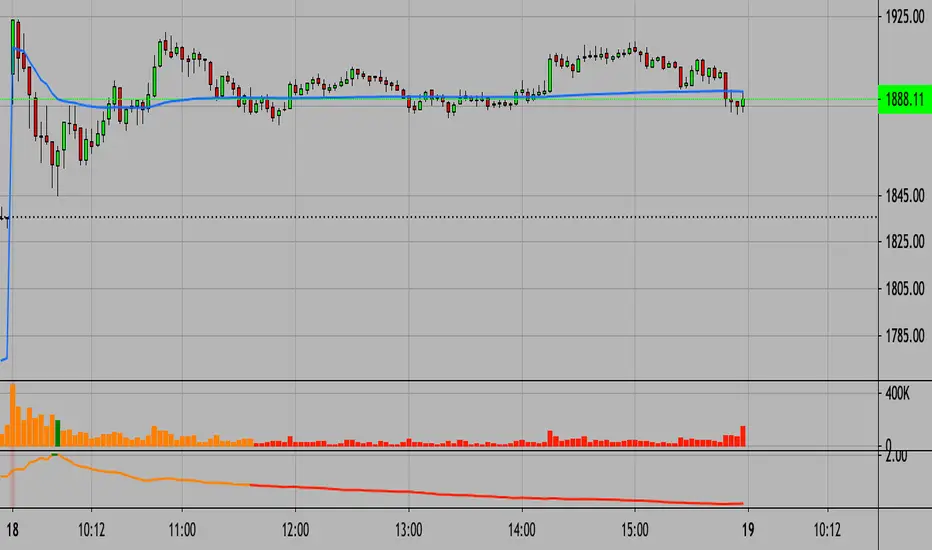
Real Relative Volume - Line Indicator - Time Adjusted - DE & EN// English description below
Die richtige Aktie zu finden, ist nich immer einfach. Eine wichtige Variable bei der Aktienauswahl stellt das relative Volumen dar, welches von vielen erfolgreichen Tradern und Trading Firmen benutzt wird. Stell es Dir so vor: Statt sich das absolute Volumen anzuschauen, schauen wir uns die tatsächliche Stärke an. Wie viel Volumen wird also heute im Vergleich zu einem regulären Tag gehandelt. Dies gibt Aufschluss darüber, ob die Aktie "In-Play" ist.
Merke: Ist das RVOL (Relative Volumen) erhöht, sind mehr Marktteilnehmer an dieser Aktie interessiert als üblich. Dies ist besonders dann wichtig, wenn die Marktrichtung und die Richtung der Aktie nicht übereinstimmen.
Wenn der Markt steigt, steigen auch die meisten Aktien. Dies kann folglich auch ohne erhöhtes RVOL passieren. Was ist aber, wenn der Markt gegen uns geht? Dann werden wir schnell bei RVOL-schwachen Aktien ausgeschüttelt. Daher wollen wir unseren Fokus immer auf Aktien setzen, die ein erhöhtes relatives Volumen haben! Dies sind die Aktien, die gerade wirklich stark gehandelt werden und wahrscheinlich einen Katalysten dafür haben.
Der Real Relative Volume - Line Indicator zeigt Dir das aktuelle relative Volumen an. Unser Algo benutzt dabei das tatsächliche kumulative Volumen des aktuellen Tages zum jeweiligen (aktuellen) Zeitpunkt und vergleicht dieses mit dem historischen Durchschnittsvolumen zum gleichen Zeitpunkt . Damit bekommen wir ein korrektes Abbild der aktuellen Stärke. Mit Hilfe des Indikators können wir ebenfalls sehen, ob diese Stärke zunimmt, gleich bleibt, oder gegebenenfalls schnell and Power verliert. Im Gegensatz zu anderen Skripten nutzen wir eine fortschrittliche Methode, die aktuelle Position am Tag erkennt und damit nicht die Session in gleiche Teile teilt. Vorteil: Der Indikator funktioniert auch in Krypto, Forex, DE-Aktien, Indizes etc.
Funktionen:
Bitte ohne verlängerte Handelszeiten nutzen!
Sessions Back: Verändert die Baseline, die Du mit dem heutigen Volumen vergleichst. Beispiel: 10 - Zur aktuellen Uhrzeit siehst Du das reale relative Volumen von heute in Relation zu den letzten 10 Sessions (zur gleichen Zeit). (*max 5000 Kerzen)
Threshold: Stelle eine bestimmte Schwelle ein, bei der Du dich über die TradingView Funktion alarmieren lassen möchtest.
T1-4: Stelle unterschiedliche RVOL Werte ein.
Use Traffic Color for Line: Die unterschiedlichen T1-4 Werte und Farben werden für das Liniendiagramm genutzt.
Dieser Indikator wird häufig mit unserer zweiten Version Real Relative Volume - Bar Indicator - Time Adjusted - DE & EN verwendet.
/////// English version
Finding the right stock is not always easy. An important variable in stock selection is the relative volume, which is used by many successful traders and trading firms. Think of it like this: Instead of looking at absolute volume, we look at actual strength. So how much volume is traded today compared to a regular day? This gives an indication of whether the stock is "in play".
Note: If the RVOL (relative volume) is increased, more market participants are interested in this stock than usual. This is especially important if the market direction and the direction of the stock do not match.
If the market rises, most shares will also rise. This can, therefore, happen without an increased RVOL. But what happens if the market goes against us? Then we are quickly shaken out of RVOL-weak stocks. Therefore, we always want to focus on stocks that have an increased relative volume! These are the stocks that are trading really strongly right now and probably have a catalyst for that.
The Real Relative Volume - Line Indicator shows you the current relative volume. Our Algo uses the actual cumulative volume of the current day at the respective (current) time and compares it with the historical average volume at the same time . This gives us a correct picture of the current strength. With the help of the indicator, we can also see whether this strength increases, remains the same, or if it loses power quickly. Unlike other scripts, we use an advanced method that recognizes the current position on the day and thus does not split the session into equal parts. Advantage: The indicator also works in crypto, forex, foreign stock markets, indices, and many more.
Functions:
Please use without extended trading hours!
Sessions Back: Changes the baseline that you compare to today's volume. Example: 10 - At the current time you see the real relative volume of today in relation to the last 10 sessions (at the same time). (*max 5000 Bars)
Threshold: Set a certain threshold at which you want to be alerted via the TradingView function.
T1-4: Set different RVOL values.
Use Traffic Color for Line: The different T1-4 values & colors are used for the line plot.
This indicator is often used with our second version Real Relative Volume - Bar Indicator - Time Adjusted - DE & EN .
Adaptive Relative StrengthAdaptive Relative Strength shows a line of relative strength with a moving period in relative to Nifty 500 for Indian Market,
by default its 45 days but you can change as per your need or change relative symbol as per your need.

Relative CandleThis script visualizes the relative movement of a single OHLC candle compared to an index (or another symbol). The vertical location of the candle indicates the general positive/negative comparison of the bar vs the index. The color of the candle indicates how the candle moved relative to the index. The wick indicates the closing range compared to the index (did the symbol close at lows of the bar while the index closed at highs).
The area graph in the background shows the average relative close over a 10-day simple moving average.
I use this to pop any behavior that is out of line with the market, whether positive or negative. For example, is a red bar day due to the market pullback or something specific to the stock. Or did the market pull back and the stock did the opposite, strong day!

Relative Strength Auto ComparisonRelative Strength Comparison with automatic selection of relevant index
Added support for most european and north american exchanges.
Momenta Relative Strength IndexThe Momenta RSI Indicator was created by William Blau (Stocks & Commodities V. 9:5 (202-205)) and is a variation of the classic RSI using his Momenta Indicator formula. I have color coded everything to make it very easy to determine buy and sell signals.
Let me know if you would like to see me write scripts for other indicators!

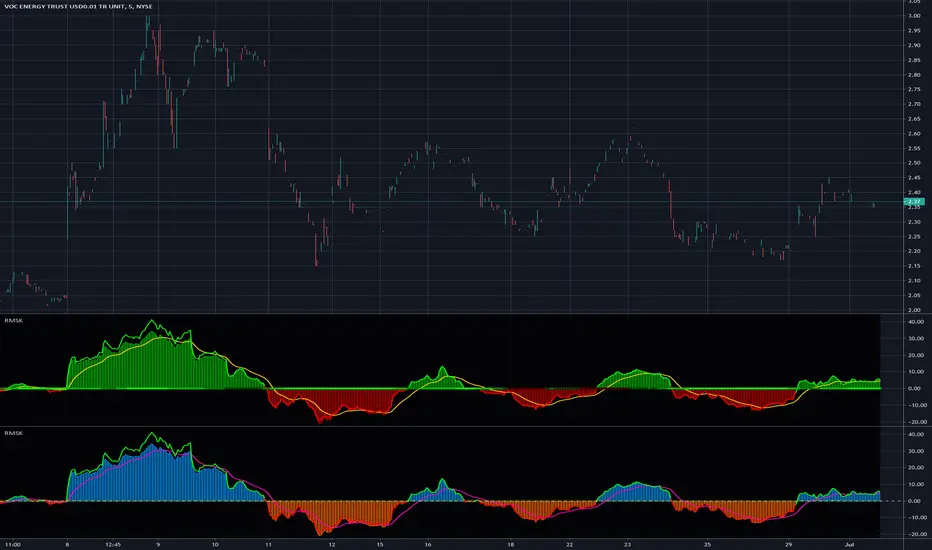
Relative Strength(RSMK) + Perks - Markos KatsanosIf you are desperately looking for a novel RSI, this isn't that. This is another lesser known novel species of indicator. Hot off the press, in multiple stunning color schemes, I present my version of "Relative Strength (RSMK)" employing PSv4.0, originally formulated by Markos Katsanos for TASC - March 2020 Traders Tips. This indicator is used to compare performance of an asset to a market index of your choosing. I included the S&P 500 index along side the Dow Jones and the NASDAQ indices selectively by an input() in "Settings". You may comparatively analyze other global market indices by adapting the code, if you are skilled enough in Pine to do so.
With this contribution to the Tradingview community, also included is MY twin algorithmic formulation of "Comparative Relative Strength" as a supplementary companion indicator. They are eerily similar, so I decided to include it. You may easily disable my algorithm within the indicator "Settings". I do hope you may find both of them useful. Configurations are displayed above in multiple scenarios that should be suitable for most traders.
As always, I have included advanced Pine programming techniques that conform to proper "Pine Etiquette". For those of you who are newcomers to Pine Script, this script may also help you understand advanced programming techniques in Pine and how they may be utilized in a most effective manner. Utilizing the "Power of Pine", I included the maximum amount of features I could surmise in an ultra small yet powerful package, being less than a 60 line implementation at initial release.
Unfortunately, there are so many Pine mastery techniques included, I don't have time to write about all of them. I will have to let you discover them for yourself, excluding the following Pine "Tricks and Tips" described next. Of notable mention with this release, I have "overwritten" the Pine built-in function ema(). You may overwrite other built-in functions too. If you weren't aware of this Pine capability, you now know! Just heed caution when doing so to ensure your replacement algorithms are 100% sound. My ema() will also accept a floating point number for the period having ultimate adjustability. Yep, you heard all of that properly. Pine is becoming more impressive than `impressive` was originally thought of...
Features List Includes:
Dark Background - Easily disabled in indicator Settings->Style for "Light" charts or with Pine commenting
AND much, much more... You have the source!
The comments section below is solely just for commenting and other remarks, ideas, compliments, etc... regarding only this indicator, not others. When available time provides itself, I will consider your inquiries, thoughts, and concepts presented below in the comments section, should you have any questions or comments regarding this indicator. When my indicators achieve more prevalent use by TV members, I may implement more ideas when they present themselves as worthy additions. As always, "Like" it if you simply just like it with a proper thumbs up, and also return to my scripts list occasionally for additional postings. Have a profitable future everyone!
(JS) Ultimate RSISo my goal here was to combine all of my RSI ideas into a single indicator in order to make kind of a "Swiss Army Knife" version of the Relative Strength Index ...
------------------------------------------------------------------------------------------------------------------------------------------------------------------------------------------------------------------------------------------------------------------
So, let's begin with the first RSI indicator I made, which is the RSIDVW (Divergence/Volume Weighted);
To rephrase my original post, the "divergence/volume weighted" portion is meant to expand upon the current RSI format by adding more variables into the equation.
The standard RSI is based off one value that you select (open, close, OHLC4, HLC3, etc.) while this version takes three variables into account.
The default setting is to have RSI normal without anything added to it (Divergence Weight = 0)
1st - it takes the standard variable that RSI normally uses.
2nd - it factors RSI divergence by taking the RSI change % and price change % to form a ratio. Using this ratio, I duplicated the RSI formula and created a divergence RS to be factored in with the standard price RS .
3rd - it takes Relative Volume and amplifies/weakens the move based upon volume confirmation. (So if Relative Volume for a price bar is 1.0, the RSI plot would be the same as it normally would)
So to explain the parameters
- Relative Volume Length: This uses the RV length you specify to determine spikes in volume (or lack of volume ), which then is added into the formula to influence the strength of the RSI move
- RV x Divergence: This is how I calculated the original formula, but you can leave this unchecked to turn Relative Volume off, or apply elsewhere.
- RV x RS: There's two sides, Divergence RS and Standard RS - these check marks allow you to select which part you prefer to be multiplied by Relative Volume .
Checking neither turns off Relative Volume , while checking both amplifies its effects by placing it on both sides of the equation.
-Divergence Weight: This controls how much the DVW portion of the formula influences the RSI plot. As I referred to earlier, default is 0 making RSI normal. The Scale is 0-2, so 1.0 would be the same as 50%.
When I do have DVW on, I generally set it to 0.5
-SMA Divergence: To smooth, or not to smooth, that is the question. UJsing an SMA here is much smoother in my opinon, but leaving it unchecked runs it through an RMA the same way standard RSI is calculated.
-Show Fractal Channel: This allows you to see the whole fractal channel around the RSI (This portion of the code, compliments of the original Ricardo Santos fractal script)
------------------------------------------------------------------------------------------------------------------------------------------------------------------------------------------------------------------------------------------------------------------
The next portion of the script is adding a "Slow RSI"...
This is rather simple really, it allows you to add a second RSI plot so that you can watch for crossovers between fast and slow lines.
-Slow RSI: This turns on the second RSI Plot.
-Slow RSI Length: This determines the length of the second RSI Plot.
------------------------------------------------------------------------------------------------------------------------------------------------------------------------------------------------------------------------------------------------------------------
Pivot Point RSI was something a friend of mine requested I make which turned out pretty cool, I thought... It is also available in this indicator.
-Pivot Points: Selecting this enables the rest of the pivot point related parts of the script
If Pivot Points isn't selected, none of the following things will work
-Plot Pivot: Plots the pivot point .
-Plot S1/R1: Plots S1/R1.
-Plot S2/R2: Plots S2/R2.
-Plot S3/R3: Plots S3/R3.
-Plot S4/R4: Plots S4/R4.
-Plot S5/R5: Plots S5/R5.
-Plot Halfway Points: Plots a line between each pivot .
-Show Pivot Labels: Shows the proper label for each pivot .
When using intraday charts, from a 15 minute interval or less the pivots are calculated based on a single days worth of price action, above that the distance expands.
Here are the current resolutions Pivot Points will work with:
Minutes - 1 , 2, 3, 5, 10, 13, 15, 20, 30, 39, 78, 130, 195
Hours - 1, 2, 3, 4, 5, 6
Daily
Weekly
Currently not available on seconds or monthly
------------------------------------------------------------------------------------------------------------------------------------------------------------------------------------------------------------------------------------------------------------------
Background Colors
Background Colors: I have six color schemes I created for this which can be toggled here (they can be edited).
Gray Background for Dark Mode: Having this on looks much better when using dark mode on your charts.
------------------------------------------------------------------------------------------------------------------------------------------------------------------------------------------------------------------------------------------------------------------
Now finally the last portion, Fibonacci Levels
-Fibonacci Levels: This is off, by default, which then uses the standard levels on RSI (30-50-70). When turned on, it removes these and marks fib levels from 0.146 through 0.886.
------------------------------------------------------------------------------------------------------------------------------------------------------------------------------------------------------------------------------------------------------------------
So the quick rundown:
Ultimate RSI contains "divergence/volume weighted" modifications, a slow RSI plot, pivot points , and Fibonacci levels all while auto-plotting divergence and having the trend illustrated in the background colors.
RSI has always been my "go to" indicator, so I hope you all enjoy this as much as I do!

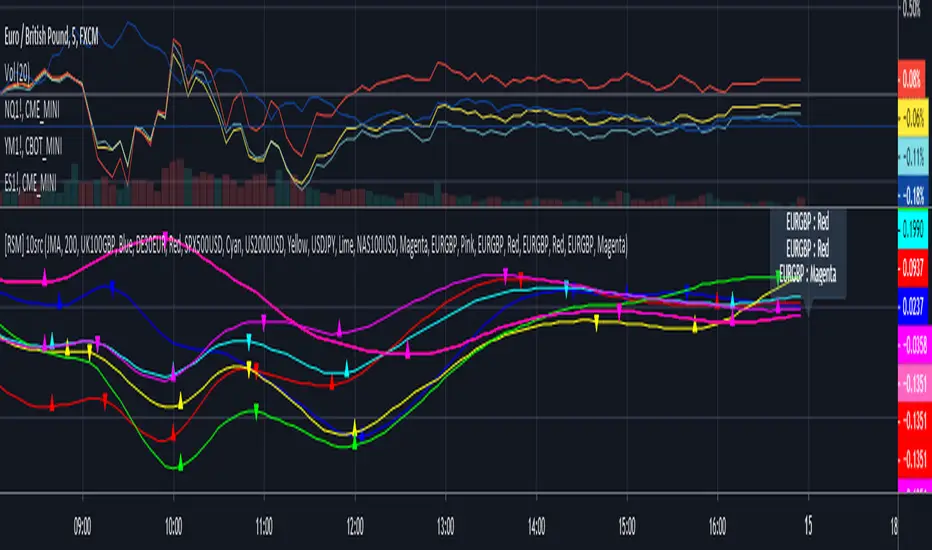
[RSM] Relative Strength Momentum 10 sources v1.1This indicator was designed to compare relative price momentum across multiple related/unrelated symbols, maximum of 10.
Each symbol's momentum/trend is determined by price movement and custom weighted moving averages.
You can use this indicator to determine changing trends by looking at correlated leading symbols.
Description of Input Parameters:
Dark theme: Turn on this checkbox if you are using the dark theme in Tradingview.
MA Type: Default is preferred, but allows you to choose different Moving Averages to determine momentum.
MA Period: Ideal period is 200 for a Chart TF of 15 minutes to 1 Hour for most symbols I've tested. (US/Euro Indexes CFD and Futures )
Symbol 1-10: Enter a valid Symbol in Tradingview otherwise indicator will return an error.
Color Symbol 1-10: Pick a unique color for each corresponding Symbol.
Display Symbol 1-10: Checkbox to turn on/off corresponding symbol's plot.
Access to Script:
Please contact me privately on Tradingview, user id: a.tesla2018
Alternatively, use the links below for method of payment/access to this indicator. Please do not forget to mention your TV name in notes.
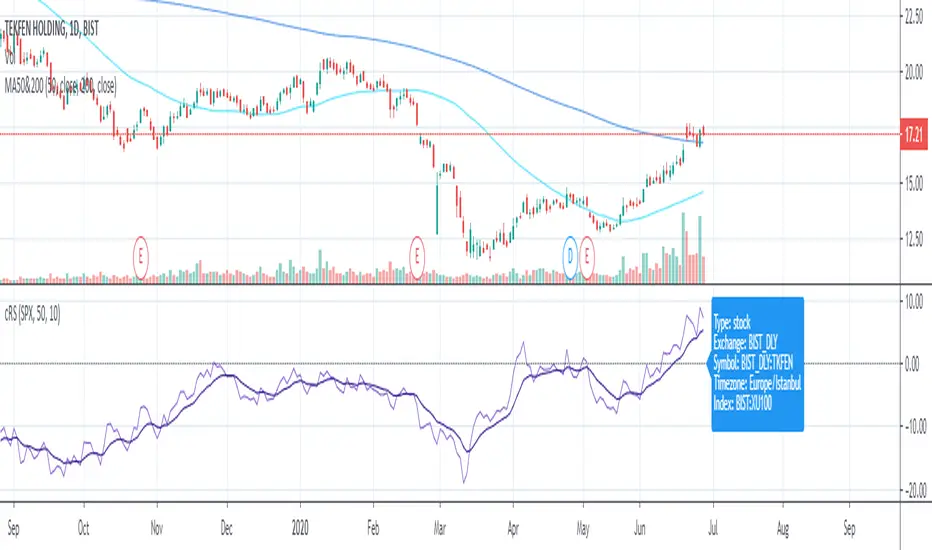
Price Relative / Relative StrengthThe Price Relative indicator compares the performance of one security to another with a ratio chart. This indicator is also known as the Relative Strength indicator or Relative Strength Comparative. Often, the Price Relative indicator is used to compare the performance of a stock against a benchmark index, S&P 500, BIST:XU100 etc.
Chartists can also use the Price Relative to compare the performance of a stock to its sector or industry group. This makes it possible to determine if a stock is leading or lagging its peers. The Price Relative indicator can also be used to find stocks that are holding up better during a broad market decline or showing weakness during a broad market advance. (Source: stockcharts)
This also can be used for Trend Identification and Bullish/Bearish Divergences.
Good Luck

[RSM] Relative Strength Momentum v1.0 [pvt]This indicator was designed to compare relative price momentum across multiple related/unrelated symbols, maximum of 6.
Each symbol's momentum/trend is determined by price movement and custom weighted moving averages.
You can use this indicator to determine changing trends by looking at correlated leading symbols.
Description of Input Parameters:
Dark theme: Turn on this checkbox if you are using the dark theme in Tradingview.
MA Type: Default is preferred, but allows you to choose different Moving Averages to determine momentum.
MA Period: Ideal period is 200 for a Chart TF of 15 minutes to 1 Hour for most symbols I've tested. (US/Euro Indexes CFD and Futures)
Symbol 1-6: Enter a valid Symbol in Tradingview otherwise indicator will return an error.
Display Symbol1-6: Checkbox to turn on/off corresponding symbol's plot.
Access to Script:
Please contact me privately on Tradingview, user id: a.tesla2018
Alternatively, use the links below for method of payment/access to this indicator.

🧬dRSI Signals Internal Beta Test by Cryptorthyhms🧬dRSI Signals Internal Beta Test by Cryptorthyhms
Test release, for internal testing only. Debut release soon!
Thank you all for your patience!

Combo Backtest 123 Reversal & Comparative Relative Strength This is combo strategies for get a cumulative signal.
First strategy
This System was created from the Book "How I Tripled My Money In The
Futures Market" by Ulf Jensen, Page 183. This is reverse type of strategies.
The strategy buys at market, if close price is higher than the previous close
during 2 days and the meaning of 9-days Stochastic Slow Oscillator is lower than 50.
The strategy sells at market, if close price is lower than the previous close price
during 2 days and the meaning of 9-days Stochastic Fast Oscillator is higher than 50.
Second strategy
Comparative Relative Strength Strategy for ES
WARNING:
- For purpose educate only
- This script to change bars colors.

Combo Strategy 123 Reversal & Comparative Relative Strength This is combo strategies for get a cumulative signal.
First strategy
This System was created from the Book "How I Tripled My Money In The
Futures Market" by Ulf Jensen, Page 183. This is reverse type of strategies.
The strategy buys at market, if close price is higher than the previous close
during 2 days and the meaning of 9-days Stochastic Slow Oscillator is lower than 50.
The strategy sells at market, if close price is lower than the previous close price
during 2 days and the meaning of 9-days Stochastic Fast Oscillator is higher than 50.
Second strategy
Comparative Relative Strength Strategy for ES
WARNING:
- For purpose educate only
- This script to change bars colors.


Relative Strength RankRelative Strength Rank Indicator
( ( Long Term Price Change + Short Term Price Change ) / 2 ) / 10 Day ATR

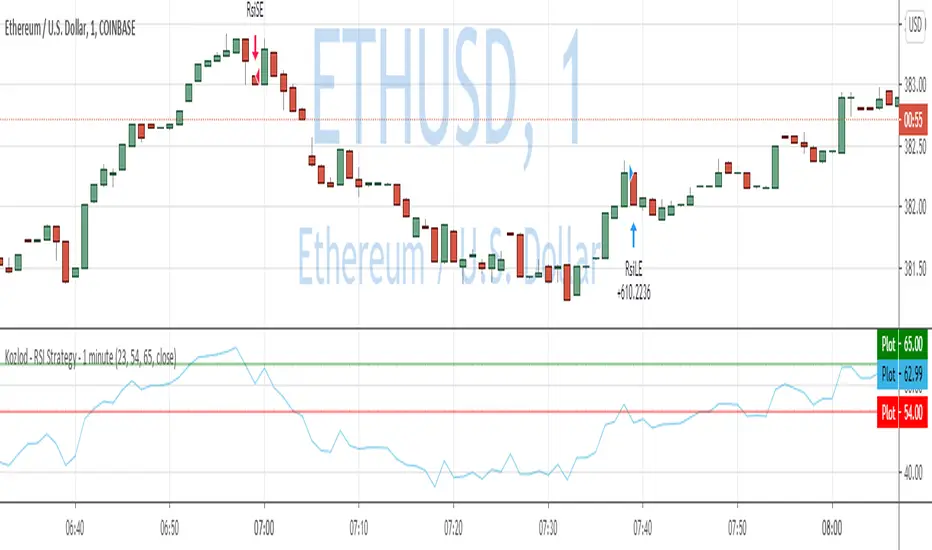
Kozlod - RSI Strategy - 1 minute - ETHUSDTrying to find simple strategies with optimal parameters which work well for certain symbols/timeframe.
Found that basic RSI strategy without any position management works pretty good for 1m chart for BTCUSDT.
It might not work very good on it's not but can give you a pretty good base for more complicated indicators.
Also, some position management as simple as static SL and PT can improve performance quite a lot.
And remember:
Past performance does not guarantee future results.
Relative Strength (MA) to KLCICompares a stock's relative strength against Malaysia market index (KLCI)

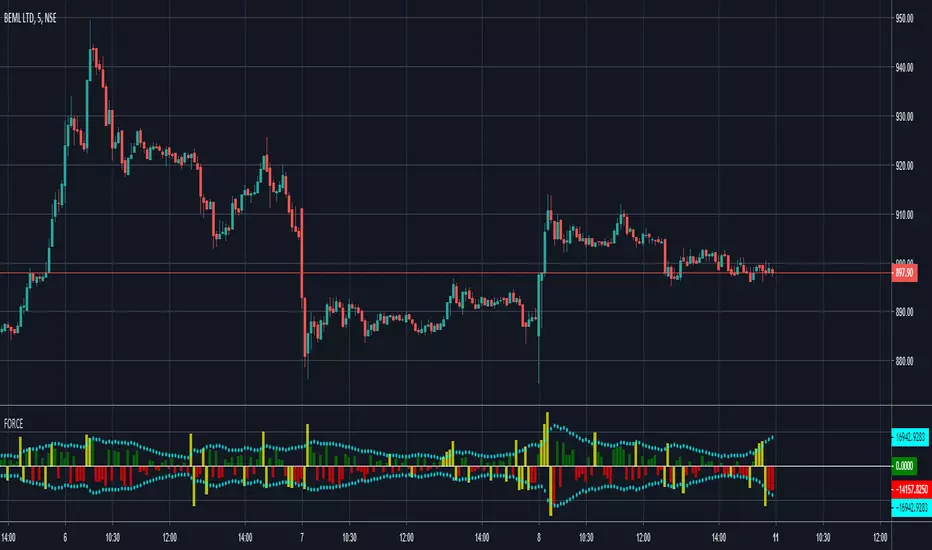
FORCEFORCE indicator calculates the pressure of buyer and seller in each candle based on volume, price, and shape. It outputs leading volume over that period and its relative strength.
Relative Volume Index(RVOLI)The RVOLI is derived from the Relative Strength Index. It is a momentum indicator that evaluates overbought and oversold conditions based on changes in volume over a specified period.