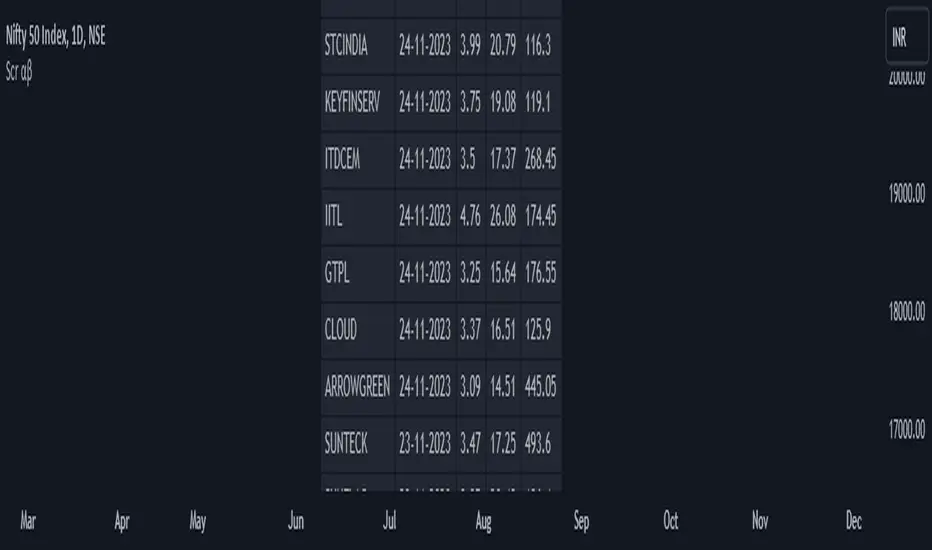
Screener: Alpha & Beta IndexThis is a Index Screener which can short list the major Sectors contributing to NIFTY movement that day.
This helps in sector based trading, in which we can trade in the stocks which falls under that particular sector.
No need to roam around all the stocks in the whole watchlist.
It is recommended to create sector wise watchlist of all sectors. It will be easier to concentrate in only one sector.
For example in IT sector index there are certain stocks which contribute to the movement of IT sector.
This will be available in NSE (or exchange website).
For detailed description check out the descriptions in my previous 2 Alpha and Beta indicators.
Combine and use this screener with my previous Alpha & Beta indicator.
Relativestrength

Screener: Alpha & BetaThis is a Live Screener for my previous Alpha & Beta indicator, which filters stocks lively based on the given values.
Use 5min timeframe for Live Intraday.
The default stocks in the screener is selected based on high beta value from F&O listed stocks. It may include other stocks also.
User can input stocks of your choice either through the menu or through the Pine editor.
The maximum number of stocks inputs is only 40. The indicator includes only 20 stocks by default.
More number of stocks can be added but it makes the screener slower to load.
Open the indicator in a sperate tab or window to avoided the loading lag.
It is recommended to choose only 10 to 20 stocks based on the weightage from each sectors.
Beta values are dynamic. It changes from day to day based on the trend and sector.
Update the sock list weekly or twice a week or monthly.
Use investing.com screener(preferably) or TradingView screener for shortlisting beta stocks.
Remember that majority of indicators fails in a sideways market, also every indicator is not 100% accurate.
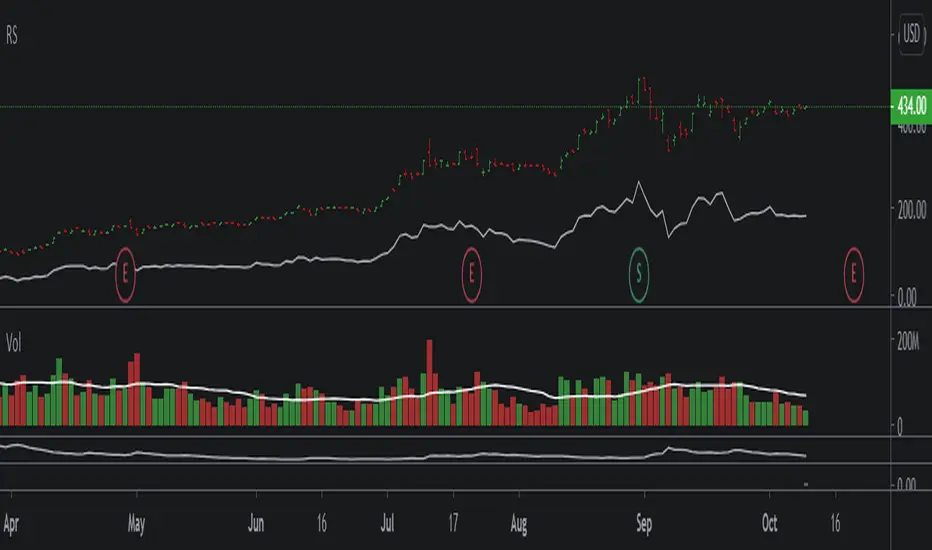
Relative Strength 52 WeeksRelative strength plot that compare strength to SPY (changeable to whatever you want)-
Small orange suns marks the 52 week high on the strength line
Color coded EMA 22 line shows the overall trend of the strength

Alpha & BetaHow to use Alpha(α)?
If Alpha is positive the stock outperforms, if the value is negative means the stock underperforms.
α < 0: The investment has earned too little for its risk (or, was too risky for the return)
α = 0: The investment has earned a return adequate for the risk taken
α > 0: The investment has a return in excess of the reward for the assumed risk
How to use Beta(β)?
β = 1: Exactly as volatile as the index
β > 1: More volatile than the index
β < 1 > 0: Less volatile than the index
β = 0: Uncorrelated to the index
β < 0: Negatively correlated to the index
β > 2: Trending stock
Higher the β higher risk/reward
Example: If the beta is 1.1, the share price is like to move by 10% more than the index
Trading Tip
Choose a stock with Alpha greater than 0 and Beta greater than 1.9 for intraday in 5min timeframe for long positions
Remember that such stocks will have high risk and high reward
Shortlist stocks with Beta greater than 1.9 for next day in 5min timeframe

Relative strength DivergenceThe following indicator uses relative comparison of two assets by the formula n/s3, where n is the t asset on the screen while s3 the underlying assets it is being compared to. The usefulness of the indicator is to primarily compare the assets being traded like BTC (most prominent crypto with largest market cap), with some other crypto like TRX(this has a relatively smaller market cap). Since we get a broader market view through relative comparison of the two assets, the most important function is to find the edge through divergences. Just like RSI the divergences rules would be the same and most important trades would be trades in the direction of the trend along accompanies by divergences that are in line with the trend. Simple divergences work for the best trades with default settings. Although BTCUSD is the default asset to compare with it can be switched with any other asset as well, but it is very much preferred that one uses some type of index as the base asset for comparison. Other than that for simple trading the trend MA crossover can also be used as a signal for simple trend following.

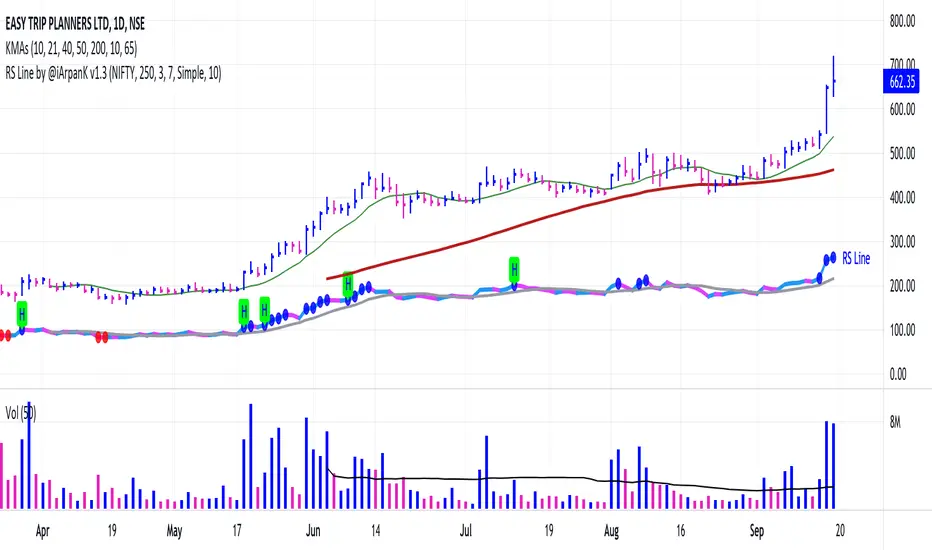
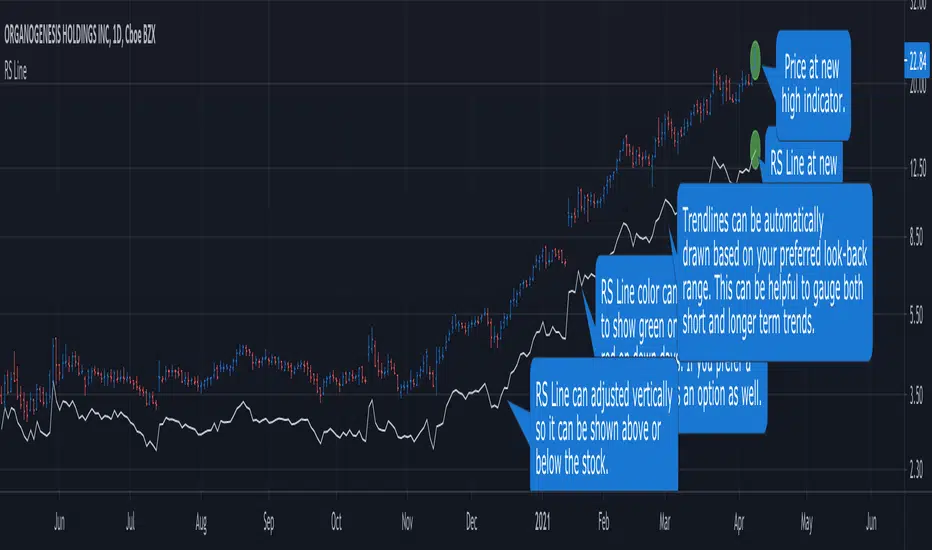
Relative Strength Line by @iArpanKHello Traders!
I'm a Momentum Trader, following the Indian & US markets. Most of us are familiar with the Relative Strength (RS) indicator, popularized by Investor's Business Daily (IBD) and available on their MarketSmith platform. So, here I'm sharing a script that does the same and additionally pops an alert label when the RS line hits a new high (similar to Blue Dot appearance on MarketSmith charts).
User Settings
Inputs tab
Base Symbol : Symbol of the security/index with which you want to compare your current active symbol.
Period : Number of days since which you want to scan for a new high (default is 250 days, which approximately pops alerts for new 52 week high in RS). For example, if you want to look for new 10 days high in RS, set the Period to 10.
Style tab
RS Line : Change color using the palette provided (default is blue).
Alert Label : Show/hide alert labels by checking/unchecking the box. Change color using the palette provided. Change alert label symbol.
Precision : Default is two decimal places. Can be changed as per requirement.
Usage
The indicator consists of two components- the Relative Strength (RS) line & alert labels on new RS highs. Relative strength gives a measure of how the underlying security is performing with respect to a base index or security. For example, how is NSE:DIXON performing w.r.t NSE:NIFTY or how is NASDAQ:AAPL performing w.r.t. the TVC:SPX .
A rising RS line tells us that the underlying entity is outperforming the base entity. Similarly, a declining RS line shows under-performance of the underlying entity. A new high in RS (especially before a new high in price) often gives valuable information about the underlying security's strength w.r.t. the general market, and can tip us off to a possible breakout in the price in near future.
Making RS lists (list of stocks making new high in RS on heavy down days in index) can be very helpful to sort out leaders that are best resisting the decline and are likely to move up aggressively when the market turns favorable.
The concept of RS is extensively used by momentum traders and growth stock traders. When used in conjunction with price & volume action, this can be a very powerful tool in your trading arsenal. You can now easily spot RS trends and new highs visually by simply adding this indicator to your chart!
Conclusion
If you like this script, click on Add to favorite indicators , so that you can easily add this indicator from your favorites tab right away.
Thanks!
Cryptos Relative Strength Oscillator
This is an oscillator made of biggest 40 cryptocurrency/USDT pairs.
* It shows relative strength and change of crypto market during certain time on given interval.
* The tool has a bunch of data put together into one oscillator:
* top and bottom lines are made of 3 strongest and 3 weakest crypto pairs (out of 40)
* has visible names of that pairs for several candles back (it cannot show more due to TV's Pine limitations)
* in settings you can set up 2 methods of calculations:
1) % change from SMA of price, default is SMA 5
2) % changes from x-candles back, to see that change from the last candle please turn of 'Moving Average' and set up 'Bars Back' to 1
* you can change source to close/hl2/ohlc2/etc
Notice 1:
- to have nicer visibility of whole oscillator make it bigger part of whole screen then you normally use for other oscillators
Notice 2:
- scroll your mouse to widen the horizontal axis, so names of certain crypto pairs will be more readable
Notice 3:
- script has 40 Pine security functions (to gather all the data from all pairs) so it can load up to several seconds
- also every change in settings will possibly result in longer loading time
ps. This script is invite-only for the members of our trading group (info in signature, group is free of charge).

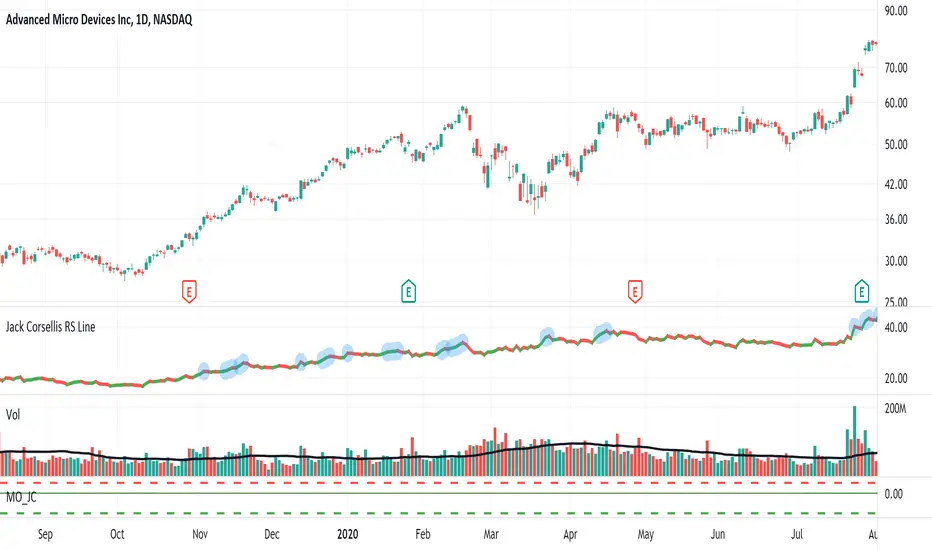
Jack Corsellis RS LineRelative Strength line which shows a blue dot for new 52 week Relative Strength highs.
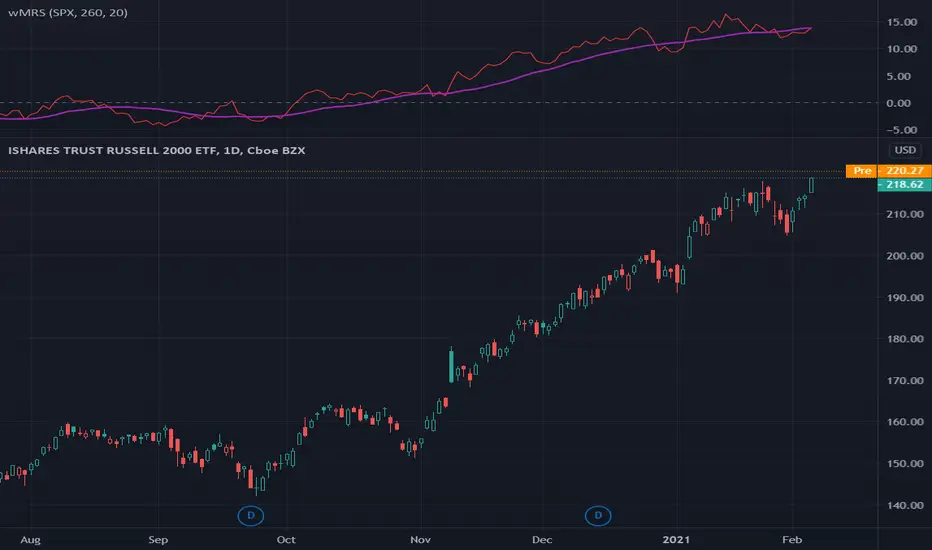
wMRS | Weighted-Mansfield Relative Strength - 4CR CUPThis version of Mansfield Relative Strength ( MRS ) weights the MRSs with different lookback periods by adding the weight of 2:1:1:1 to MRS (1Q) : MRS (2Q) : MRS (3Q) : MRS (4Q).
Typically, the lookback period of a MRS is reference to a full year, i.e. 260 trading dates or 52 weeks; to better represents the relative strength of a stock to a recent performance, someone suggested to add heavier weight on the most recent quarter MRS , i.e. MR(1Q) and the same weight to other quarters, namely, MRS (2Q), MRS (3Q), MRS (4Q).
For some of the stocks you may be interested was IPO not long ago, the lookback period is relaxed for customizing. Once you set the total lookback period, representing the 4Q, in the indicator, the other shorter lookback periods will be auto-calculated, i.e. 1Q, 2Q, 3Q.
A simple moving average of the wMRS is also added for your easier analysis on the trend development of the strength.
MRS | Mansfield Relative Strength - 4CR CUPThere are many investors referring to Relative Strength (RS) indicator published by Investor’s Business Daily (IBD) for their analysis. Since the RS published by IBD is a proprietary indicator, no exact formulation is published on it.
Many discussion suggested that an alternative to the IBD RS is the Mansfield Relative Strength .
There are 2 parameters for Mansfield Relative Strength setting, namely the market index and the lookback period, n. the default setting of Mansfield Relative Strength adopted by Stan Weinstein was “SPY” and “52” in weekly chart and “200” in daily chart .
Stan Weinstein used the Mansfield Relative Strength indicator on weekly charts. He suggested the breakouts out of a base had to go together with rising relative strength . The Mansfield RS needs to be rising and close to or above 0.
This version of Mansfield Relative Strength relaxes these input parameters for your own choice.
The market index can be set to other market index, e.g. NDX, DJI, NI255, MOEX , TAIEX , HSI , etc. and the lookback period is relaxed to integral input, e.g. 60, 90, 150, etc.
Mansfield Relative Strength
The Relative Strength indicator adopted by Stan Weinstein in his book: “Secrets For Profiting in Bull and Bear Markets” is formulated as Mansfield Relative Strength ( MRS ).
The formula of this indicator is based on the regular Dorsey RS (DRS):
DRS = Price_stock / Price_index
MRS = 100 * (DRS_today / sma (DRS, n)) - 1)
Where:
DRS = Dorsey Relative Strength
SMA = Simple moving average over n days.
The Mansfield Relative Strength formulates as the change of ratio of DRS to its own n-day moving average, this means:
MRS equals to 0 if the DRS is exactly equal to its n day moving average.
MRS is negative if the DRS is below its n day moving average.
MRS is positive if the DRS is above its n day moving average.
Using Mansfield Relative Strength
The MRS tells the relative price movement of the stock to the market index in a period of time concern. As with the Dorsey RS , you can use Mansfield RS to examine if a stock performs better than the market.
This indicator has the advantage over the Dorsey RS that in Dorsey RS only trend matters while for Mansfield RS the values whether below or above the 0 also matters. This allows us to screen for stocks with a MRS value above 0. When we see that the MRS is far above 0 and has been above 0 for some time, we have found a stock that outperforms the market heavily. We can buy this kinds of stock when dips occur.

RS.ROC | Relative Strength - Rate of Changes - 4CR CUPFor completeness of Relative Strength studies, the Relative Strength based on rate of changes (ROC) with weighting is coded and presented as well.
The RS.ROC is similar to the formulation of RS by IBD before rank among all the stocks in the market.
The lookback period is relaxed for customizing. Once you set the total lookback period, representing the 4Q, in the indicator, the other shorter lookback periods will be auto-calculated, namely, 1Q, 2Q, 3Q.
A simple moving average of the RS.ROC is also added for your easier analysis on the trend development of the strength.
To use it later at your charting later,
1. Favorite it;
2. Select from your favorite list.

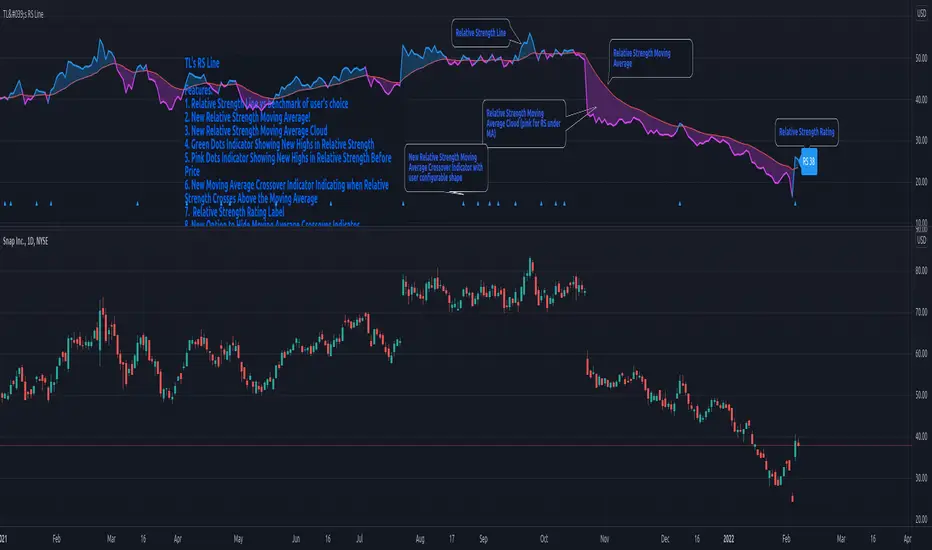
TraderLion's Relative Strength LineRelative Strength Line
Introduction
The script adds a line/candlestick to your charts that shows how well a stock is acting relative to the Index. We call this Relative Strength Line.
Relative Strength ( RS ) separates leading stocks from laggards. Stocks showing RS during a market correction phase will often be the strongest movers once the general market is ready to cooperate.
Instructions on How To Add this Script to Your TradingView Charting Platform
Step 0: Head over to www.tradingview.com
Step 1: Add “TraderLion's Relative Strength Line” to your Favorites by clicking “Add to Favorite Scripts” near the bottom of the page.
Step 2: Click “Indicators” at the very top on TradingView. Under Favorites click “Relative Strength Line”
Step 3: Hover on the Indicator name ( Relative Strength Line) on your plot under legend and click the three dots at the very right. Under the “Pin To Scale” choose a setting that works best for you (optional).
Step 4: Done. You have now plotted the Relative Strength Line
Features
1) The Pink Dot symbolizes the RS Line reaching new highs before price. RS New Highs Before Price (RSNHBP) is often indicative of a break out emerging.
2) Direction-Based Relative Strength. The RS Line can be customized to color coat depending on its most recent direction. When the line moves up it will be blue, and on the way down pink. Easily glance and see phases of relative strength on the chart.
3) Raw RS Rating - The RS Line Script features an RS Rating from 1-99 with 99 being the strongest rating. The measures the stock’s performance relative to the Index you input.
3) Custom Index Input under Settings - requested feature!
4) Candlestick Relative Strength - A different unique way to view the Relative Strength Line
5) Alerts Conditions - Relative Strength New Highs and Relative Strength New Highs Before Price (RSNHBP)
RS Line - Relative Strength Line [LevelUp]Overview:
This implementation of the RS Line mimics how Investor's Business Daily and CANSLIM investors measure growth stock performance versus the S&P 500.
If you are looking at a weekly chart, the RS Line is the performance of the stock over the past week versus the S&P 500 over that same time frame. The same logic applies to the daily and monthly charts, only the time frames are different.
If a stock moves up for the day/week/month and the S&P 500 does not, the RS Line will move up. If a stock ends the day/week/month flat, yet the S&P 500 moves up, the RS Line will go down.
Usage:
- Look for an upward sloping line.
- The steeper the line, the better.
- Can be used for viewing long-term trend.
Non-Rescaled RSI█ OVERVIEW
Relative Strength Index is a momentum oscillator developed by J. Wilder. The original version of RSI rescaled the relative strength measurement to range. While the rescaling is useful for readability, This non-rescaled version tells the exact average relative strength of the movement for the past period, and give another way to put the relative strength reading into context of current market condition.
█ Description & How To Use
1. The (+/-) in relative strength value indicates the direction
Example 1: Relative Strength of 2.33 means average gain is 2.33 bigger than average loss for the past period (Equivalent to RSI 70)
Example 2: Relative Strength of -2.33 means average loss is 2.33 bigger than average gain for the past period (Equivalent to RSI 30)
Example 3: Relative Strength of 0 means average gain is equal to average loss for the past period (Equivalent to RSI 50)
Look at comparison below:
2. You can use it exactly how you would use RSI: Overbought/Oversold state, Divergence, Trend identification, Failure Swings etc..
█ Features
- Overbought/Oversold line still maintainable as standard RSI level (70,30) in user input screen. The script will recalculate and plot the ob/os level accordingly
- Value Label to indicate the RSI and RS value
- Custom Gradient Color Scheme
█ Limitation
The Relative Strength absolute value is capped at 20 to avoid ratio value too big(or too small). This is enough to get accurate equivalent of RSI reading between 5-95
█ Disclaimer
Past performance is not an indicator of future results.
My opinions and research are my own and do not constitute financial advice in any way whatsoever.
Nothing published by me constitutes an investment/trading recommendation, nor should any data or Content published by me be relied upon for any investment/trading activities.
I strongly recommends that you perform your own independent research and/or speak with a qualified investment professional before making any financial decisions.

RSI HistogramThis an experiment to visualise the famous RSI indicator within a Histogram.
Opposed to regular RSI this RSI is plotted into a Histogram and uses different scales (100 to -100), in addition it has the ability to smooth the RSI with various moving averages like HMA, JMA and KAMA.
About RSI:
The RSI measures recent performance of a given stock against its own price history performance, by combining the average gain or loss a particular security owns over a predetermined time period.
Bars can be colored in Settings (Disabled by default)
Enjoy and like if you like :)

Percentage Relative StrengthA relative strength indicator that compares your main symbol (one on your chart) strength to another symbol by percentage.
The result is plotted as a histogram showing which symbol is rising or falling more in percentage.
In case your chart symbol is TSLA (Tesla) and the indicator 'Symbol to compare' is SPX:
GREEN area (above zero) means TSLA is rising more than the SPX.
RED area (below zero) means TSLA is falling more than the SPX.
To these who wants to understand calculation, it's pretty straightforward.
For each asset we calculate everyday percentage change based on previous close and current close.
We take main asset (chart symbol) percentage and subtract it from percent of change of the symbol we want to compare to.
Result are smoothed by SMA (Simple Moving Average)
You can select different indexes or cfds such as S&P500 (SPX), NASDAQ 100 (NSX), RUSSELL 2000 (RUT) and NASDAQ (IXIC).
Default is S&P 500 (SPX).
Enjoy and Like if you like.

Simple PVT Strength Spotter™TradeChartist Simple PVT Strength Spotter is a modified version of Price Volume Trend visualised using Relative Strength and helps spot price trends using visually engaging and appealing PVT Strength Oscillator plot and background. The Bull and the Bear background fills are highly useful for traders who like to visually understand areas of entry/exit based on PVT Strength and Oscillator Highs and Lows help spot Bull and Bear Divergences.
===================================================================================================================
What does Simple PVT Strength Spotter do?
Plots PVT Strength with visually engaging colours for Bull and Bear zones (Green and Red).
Plots PVT Strength coloured bars on main chart based on user preferred Upper and Lower PVT Strength bands (Default - 5/-5).
Plots PVT Strength based on EMA smoothing (1 for Regular PVT Strength without smoothing).
Plots Heikin Ashi PVT Strength if enabled from indicator settings.
Plots PVT Strength highs of Bull Zone and PVT Strength lows of Bear Zone. Helps visually spot divergences.
===================================================================================================================
Note:
Default Settings:
7 period PVT Strength using 5 EMA Smoothing.
For Heikin Ashi PVT Strength on normal bars, enable ᴜsᴇ ʜᴇɪᴋɪɴ ᴀsʜɪ PVT Sᴛʀᴇɴɢᴛʜ .
Works only on symbols that have Volume data.
===================================================================================================================

Spread ChartThis study does a division ("/") between the ticker to benchmark symbol works for all the time frames.
Often referred to as spread charts or ratio charts this is often used to measure the strength and performance of a script v/s a benchmark index. In this study, the comparison is plotted from a fixed reference session. On the current bar, the percentage change of the current ratio to the reference ratio is displayed as a label down icon, rounded to nearest 2 digit float value.
There are options to plot either a candle plot or line plot. Line chart can be plot as 2 different color before reference date and after reference date. The reference date can also be changed from the input dialog.
In the example above, 03-Jul-2020 is chosen as the reference date. At the latest bar, the "47.73%" displays the percentage difference between ratio on 03-July-2020 and current date, 27-Nov-2020. This means Deepak Nitrate performed 47.73% better than the benchmark NIFTY50 since 03-Jul-2020.
Basically, It gives an study that shows the strength or weakness of a ticker in comparison to benchmark symbol.

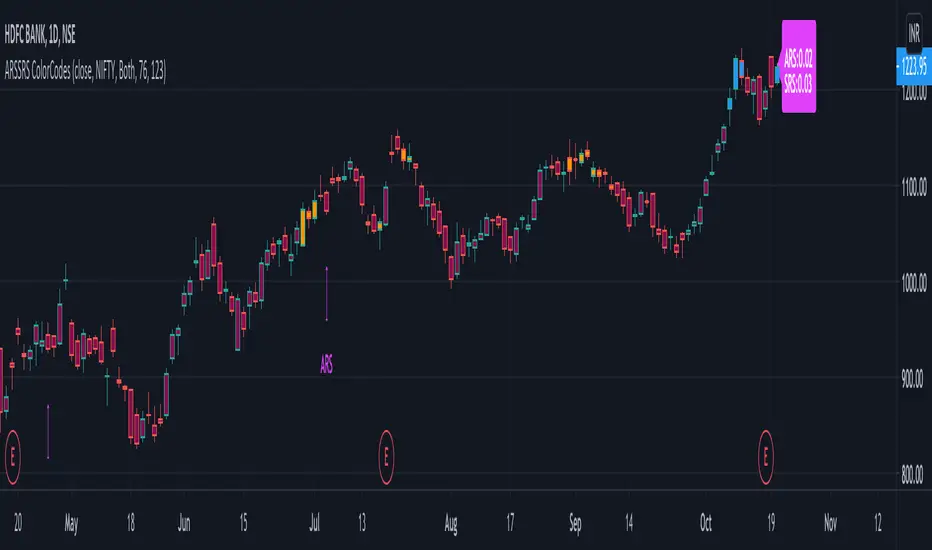
Adaptive and Static Relative Strength OverlayThis indictor combines adaptive and static relative strengths and displays the strength in a unique colour coding on the bars.
With this the one can view the performance of both the relative strengths in one indicator and overlay-ed on the price chart.
Adaptive Relative Strength - Date is identified based on market scenarios. It will change based on how the market trends in the future.
Static Relative Strength - Date is fixed (123 sessions). Roughly corresponds to 6 months.
The (default) colour coding is:
If "Both" is selected:
ars > 0 and srs > 0 = Blue
ars <=0 and srs <= 0 = Maroon
Orange otherwise (Any of ars or srs is negative)
If "Only ARS" is selected:
ars > 0 = Blue
Maroon otherwise
If "Only SRS" is selected:
srs > 0 = Blue
Maroon otherwise
Additionally the ARS and the SRS will be marked as labels on the bars corresponding to the reference dates.
The current ARS and SRS values will be market as label on the last bar.
Source can be any valid source, close is selected by default.
Default benchmark is "Nifty 50" the NSE Indian benchmark. This can be changed.
Relative Strength OverlayThis is the original script to my other Relative Strength indicator (link below) It provides a graphical overlay of the Relative Strength, compared to the QLD, a Nasdaq x2 ETF.
You can not use the value to compare to other stocks or securities, as it is scaled based on the price (so it can be used as an overlay).
If you want a value which you can use to compare with other stocks, please see my other Relative Strength indicator.
Relative StrengthA relative strength overlay, similar to that of IBD shown on Marketsmith.
The value is not from 0-100, it is compared with the Nasdaq x2 ETF, QLD. Therefore, if greater than zero it will give you a good indication that the stock has a very good relative strength.
Feel free to change the comparison ETF to one of your choosing.

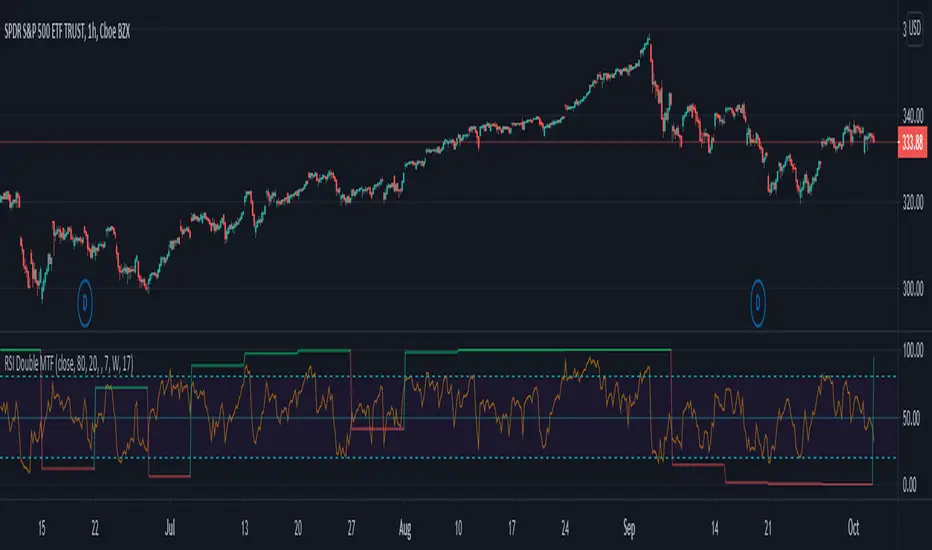
RSI Double MTFCool little gudget of Multi time frame RSI with additional RSI. Both can be set to a different time frames.
Higher time frame (Second RSI) indicates the main trend by different colors - 'red' (down trend) and 'green' (up trend), where the first RSI can act as a normal RSI.
Suggestions/Questions or a thanks below :)
Follow for more updates and new indicators follow: www.tradingview.com
Sector/Market Relative StrengthSector/Market Relative Strength Indicator (SMRS) shows in one layout the relative strength of an asset against it's Sector and Market.
By default smoothed by EMA, however EMA can be disabled to see spot on strength with 'Relative Strength steps back' set to 1.
This indicator is at experimental stage and might be updated soon.
Green column: Base asset is stronger than market/sector.
Red Column: Base asset is weaker than than market/sector.
Bottom line (squares): Green- Sector is stronger than market. Red- Sector is weaker than market. Affected only by Sector and Market symbols that are defined in indicator settings!
Notes
-------
* Useful only with securities (not forex, cryptocurrencies,etc..)
* Market and sectors needs to be defined in indicator settings.
For any suggestion/comment write me.
