[TTI] ZVR Watchlist––––History & Credit ––––––––––––––––––––––––––––––––––––––––––––––––––––––––––––––
This indicator/screener is inspired by the methodology of a great momentum master - Dan Zanger. Dan holds the world record for higher % gain in a 12month period, which was achieved in 1998 and has not been broken since. One of the secrets he has shared with the world is his famous Zanger Volume Ratio (ZVR), to which his attributes great part of his success.
–––––What it does –––––––––––––––––––––––––––––––––––––––––––––––––––––––––––––––
The script allows you to monitor your watchlist for the most important momentum indicators on an intraday basis in order to maximise your chance of jumping in the right time.
1️⃣ ZVR - pre breakout indicator
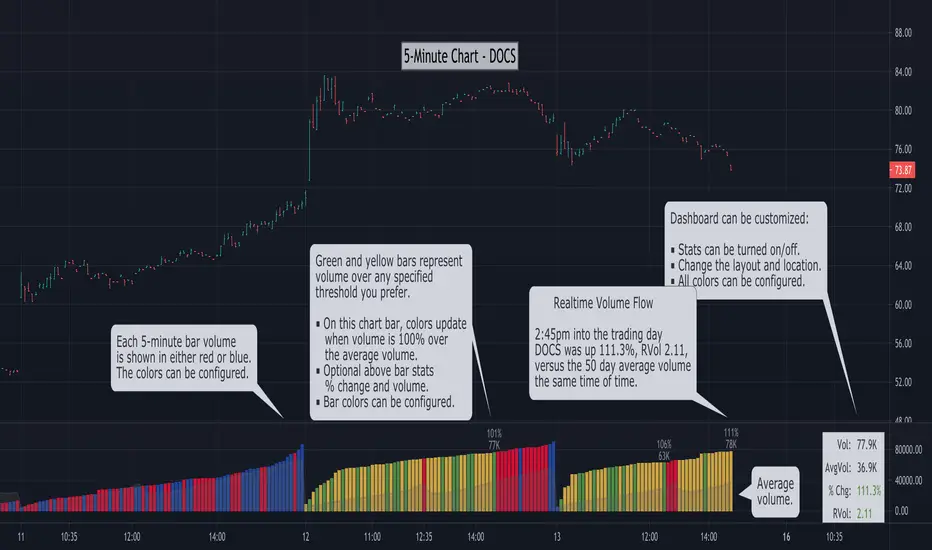
ZVR measures unusual momentum at a given time of the day.
Example
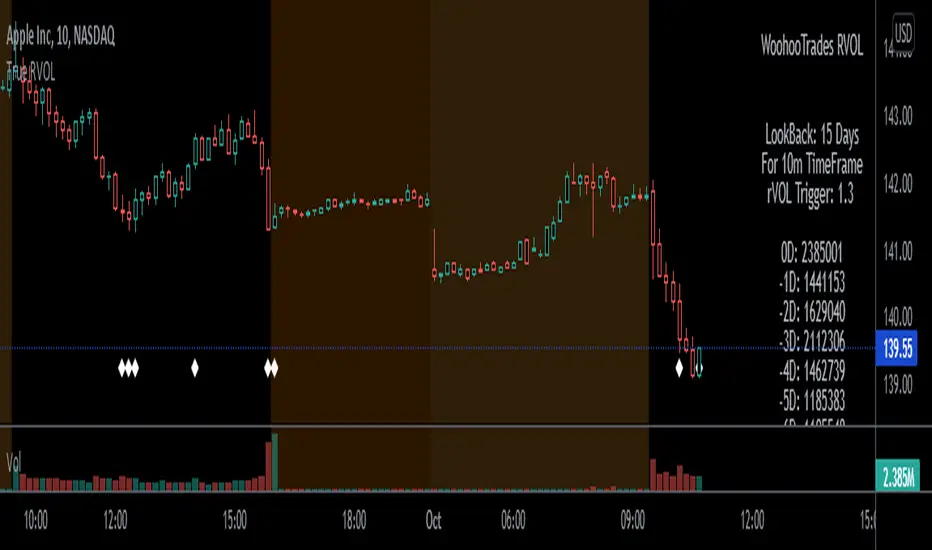
Imagine it is the first hour of the trading session and you get AAPL with a daily volume (up to that time) of 2mn shares. Is this normal or not? If you just compare it to the average volume you will be making a logical mistake, since you have 7more hours for volume to reach the "average" level. Henceforth, average volume should be compared on an end of day basis. However, the ZVR looks at the current intraday cumulative volume at any particular time of day, and compare that to the average cumulative volume that has usually traded by that time of day in the past.
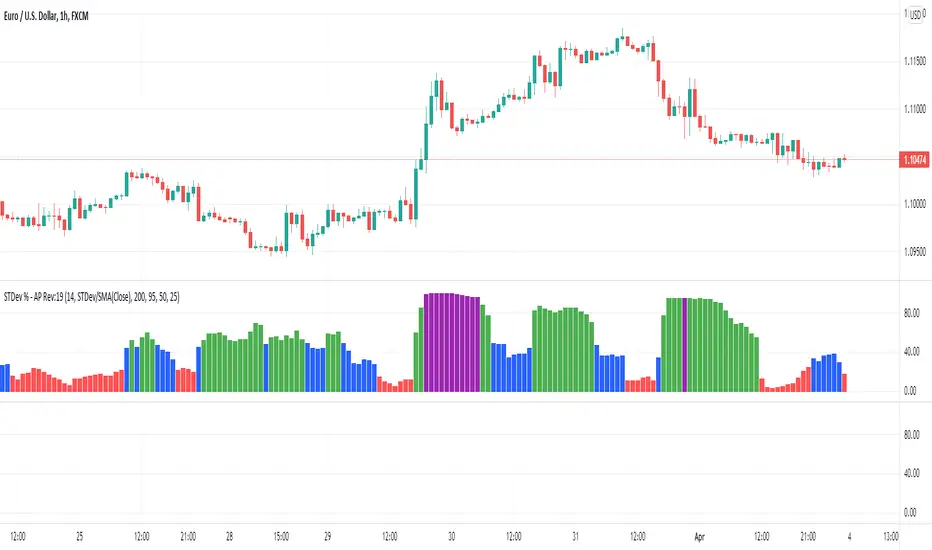
The 4 colors are 4 types:
🔴 (RED) — Volume is over 200% of the usual cumulative intraday volume for that day
🟣 (PURPLE) — Volume is between 150% and 200% of the usual cumulative intraday volume for that day
💓 (PINK) — Volume is between 100% and 150% of the usual cumulative intraday volume for that day
🟠 (ORANGE) — Volume is between 50% and 100% of the usual cumulative intraday volume for that day
🌚 (GRAY) — Volume is under 50% of the usual cumulative intraday volume for that day
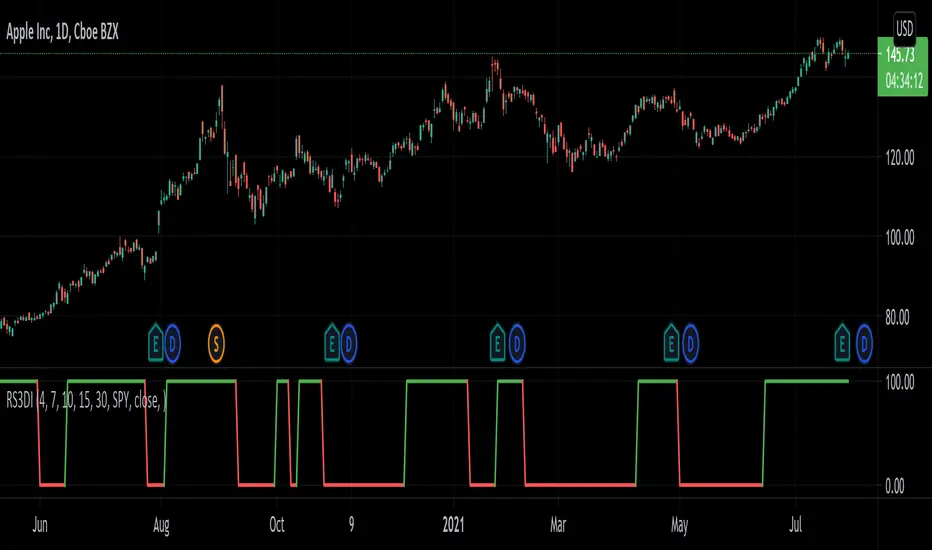
2️⃣ SQN
The SQN is defined by the late Market Wizard Dr. Van Tharp: "A measure of a market’s movement through an application of the System Quality Number calculation. To calculate, the daily changes from close to close measured in percentage terms are averaged and the standard deviation is calculated. Plugged into the SQN formula, those values and the number of days (N) provide the market SQN score."
👉 Super Bullish - denoted by SB and lime color
👉 Bullish - denoted by B and green color
👉 Neutral - denoted by N and cyan/aqua color
👉 Bearish - denoted by Br and dark red color
👉 Super Bearish - denoted by SBr and light red color
–––––How to use it –––––––––––––––––––––––––––––––––––––––––––––––––––––––––––––––
I use the indicator very much like a watchlist. I put it on a secondary chart and load up all the stocks that I have identified as a buyable. I then wait to get signs of breakout. My favourites are stocks which are in SuperBullish trend (SQN) and starting to show RED ZVR in the beginning of the day. Often these are very strong names that show institutional buying. I purchase close to pivot point and hold for a swing trade. If the stock advances too fast 5-7% on the day, I take some off into strength.
Suggested use for this indicator is to combine with any volatility contraction methodology. Some examples include the TTM Squeeze, Squeeze Pro or my personal favorite Mark Minervini's Volatility Contraction Pattern (VCP).
Look for stocks in a long term uptrend (we have another indicator for Stage 2 identification).
Pine Script® göstergesi