OPEN-SOURCE SCRIPT
Güncellendi RSI Plus
RSI [+] Plus:
☑️ Show the divergences.
☑️ Shows the approximate price of an RSI level (by default it is level 55 but it can be changed for any other level).
☑️ Shows the bulls and bears zones, in green when crossing level 50 up and red when crossing down.
☑️ Circle the highest and lowest levels as possible purchases and sales.
☑️ Includes a smoothed RSI.
RSI [+] Plus:
☑️ Muestra las divergencias.
☑️ Muestra el precio aproximado de un nivel del RSI (por defecto viene el nivel 55 pero se lo puede cambiar por cualquier otro nivel).
☑️ Muestra la zonas de toros y osos, en verde cuando cruza hacia arriba el nivel 50 y rojo cuando cruza hacia abajo.
☑️ Marca con un circulo los niveles mas alto y mas bajos como posibles compras y ventas.
☑️ Incluye un RSI suavizado.
Sürüm Notları
☑️ Added Auto Higher Time FrameSürüm Notları
Clean code Sürüm Notları
Added an option that shows the moving average of the RSI (Type: RMA, SMA, EMA, WMA, HMA, DEMA, TEMA, VWMA, ALMA) and dispersion around MA.Sürüm Notları
Migrated to Pine Script V5Reorganized the code and changed the color scheme.
Now you can choose between RSI, MFI or AVG. The AVG is the average between the RSI(close, 14) and the MFI(hlc3, 14), the number of periods can be changed.
Added several types of alerts and more types of moving averages.
Orange arrows mean that the RSI crossed below its MA.
Green arrows mean that the RSI crossed above its MA.
Now you can enable the color of the bars which is displayed in gradient color (oversold in red, overbought in green). The same color scheme is used for the "Smoothed RSI".
Sürüm Notları
Added the Ultimate RSI indicator which is a new oscillator based on the calculation of the Relative Strength Index that aims to put more emphasis on the trend, thus having a less noisy output. Opposite to the regular RSI, this oscillator is designed for a trend trading approach instead of a contrarian one. While returning the same information as a regular RSI, the Ultimate RSI puts more emphasis on trends, and as such can reach overbought/oversold levels faster as well as staying longer within these areas. This can avoid the common issue of an RSI regularly crossing an overbought or oversold level while the trend makes new higher highs/lower lows.
The Ultimate RSI crossing above the overbought level can be indicative of a strong uptrend (highlighted as a green area), while an Ultimate RSI crossing under the oversold level can be indicative of a strong downtrend (highlighted as a red area).
The Ultimate RSI crossing the 50 midline can also indicate trends, with the oscillator being above indicating an uptrend, else a downtrend. Unlike a regular RSI, the Ultimate RSI will cross the midline level less often, thus generating fewer whipsaw signals.
For even more timely indications users can observe the Ultimate RSI relative to its signal line. An Ultimate RSI above its signal line can indicate it is increasing, while the opposite would indicate it is decreasing.
Sürüm Notları
Undo the previous change. Sürüm Notları
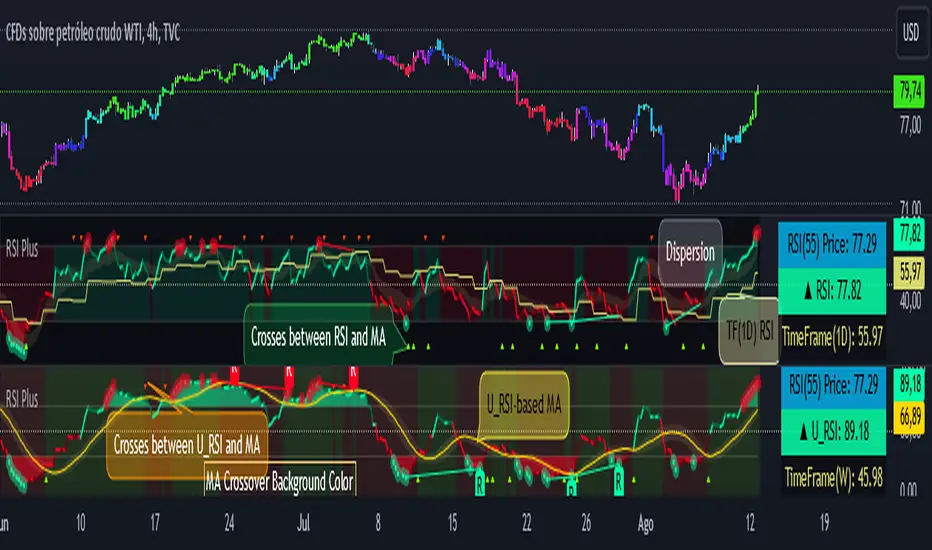
TIME library added to calculate the Higher Time Frame (HTF) of the RSI.A table has been added that displays the price if the asset reaches level 55 (this level can be changed), the slope is shown, as well as the value of the selected indicator. The last row displays the value of the selected indicator in its higher timeframe.
The RSI has been enhanced with a new color scheme. It now displays four colors: green and dark green for bullish, and red and dark red for bearish. And, dark background color option added.
Background color options for moving average crossover added: green for bullish, orange for bearish.
Added the Ultimate RSI indicator which is a new oscillator based on the calculation of the Relative Strength Index that aims to put more emphasis on the trend, thus having a less noisy output. Opposite to the regular RSI, this oscillator is designed for a trend trading approach instead of a contrarian one.
While returning the same information as a regular RSI, the Ultimate RSI puts more emphasis on trends, and as such can reach overbought/oversold levels faster as well as staying longer within these areas. This can avoid the common issue of an RSI regularly crossing an overbought or oversold level while the trend makes new higher highs/lower lows.
The Ultimate RSI crossing above the overbought level can be indicative of a strong uptrend (highlighted as a green area), while an Ultimate RSI crossing under the oversold level can be indicative of a strong downtrend (highlighted as a red area).
The Ultimate RSI crossing the 50 midline can also indicate trends, with the oscillator being above indicating an uptrend, else a downtrend. Unlike a regular RSI, the Ultimate RSI will cross the midline level less often, thus generating fewer whipsaw signals.
For even more timely indications users can observe the Ultimate RSI relative to its signal line. An Ultimate RSI above its signal line can indicate it is increasing (Uptrend), while the opposite would indicate it is decreasing (Downtrend).
Açık kaynak kodlu komut dosyası
Gerçek TradingView ruhuna uygun olarak, bu komut dosyasının oluşturucusu bunu açık kaynaklı hale getirmiştir, böylece yatırımcılar betiğin işlevselliğini inceleyip doğrulayabilir. Yazara saygı! Ücretsiz olarak kullanabilirsiniz, ancak kodu yeniden yayınlamanın Site Kurallarımıza tabi olduğunu unutmayın.
Feragatname
Bilgiler ve yayınlar, TradingView tarafından sağlanan veya onaylanan finansal, yatırım, işlem veya diğer türden tavsiye veya tavsiyeler anlamına gelmez ve teşkil etmez. Kullanım Şartları'nda daha fazlasını okuyun.