Kirshenbaum BandsThis indicator was originally developed by Paul Kirshenbaum, a mathematician with a Ph.D. in economics from New York University.
It uses the standard error of linear regression lines of the closing price to determine band width. This has the effect of measuring volatility around the current trend, rather than measuring volatility for changes in trend.
Good luck!
Regressionanalysis

Quadratic Regression Slope [DW]This is a study geared toward identifying price trends using Quadratic regression.
Quadratic regression is the process of finding the equation of a parabola that best fits the set of data being analyzed.
In this study, first a quadratic regression curve is calculated, then the slope of the curve is calculated and plotted.
Custom bar colors are included. The color scheme is based on whether the slope is positive or negative, and whether it is increasing or decreasing.

Quadratic RegressionA quadratic regression is the process of finding the equation that best fits a set of data.This form of regression is mainly used for smoothing data shaped like a parabola.
Because we can use short/midterm/longterm periods we can say that we use a Quadratic Least Squares Moving Average or a Moving Quadratic Regression.
Like the Linear Regression (LSMA) a Quadratic regression attempt to minimize the sum of squares (sum of the squared difference between a set of data and an estimator), this is why
those kinds of filters have low lag .
Here the difference between a Least Squared Moving Average ( green ) and a Quadratic Regression ( red ) of both period 500
Here it look like the Quadratic Regression have a best fit than the LSMA

LinearRegressionChannelBreakoutMy first idea about the linear regression channel... It is free and available for everybody.

Price Regression AgreggatorPrice Estimator with aggregated linear regresion
---------------------------------------------------------------------------
How it works:
It uses 6 linear regression from time past to get an estimated point in future time, and using transparency, those areas that are move "visited" by those 6 different regressions and maybe more probable to be visited by the price (in fact if you zoom out you will see that price normally is around the lighter zones) have more aggregated painted colors, the transparency is lower and well, the lighter area should be more probable to be visited by the price should we put any faith on linear regression estimations and even more when many of them coincide in several points where the color is more aggregated.
If the "I" (the previous regressions increment) is too low, then we will have huge spikes as the only info gathered from the oldest linear regresssion will be within the very same trend we are now, resulting in "predictions" of huge spikes in the trend direction. (all regressions estimating on a line pointing to infinite)
If the "I" is high enough (not very or TV won't be able to display it) then you will get somewhat a "vectorial" resultant force of many linear regressions giving a more "real prediction" as it comes from tendencies from higher timeframes. E.g. 12 hours could be going down, 4h could be going sideways, 30m could be going up.
contact tradingview -> hecate . The idea and implementation is mine.
Note: transparency + 10 * tranparencygradient cannot be > 100 or nothing will be displayed
Note2: if the Future increment (how many lines are displayed to the right of the actual price ) are excessive, it will start to do weird things.
Note3: two times the standard deviation statistically correponds to a probability of 95%. We are calculating Top and Bot with that amount above and below. So anything inside those limits is more probable and if we are out of those limits it should fall back soon. Increase the number of times the std deviation as desired. There are calculators in the web to translate number of times std dev to their correspondent probability.
Note4: As we use backwards in time linear regressions for our "predictions" we lose responsiveness. Those old linear regressions are weighted with less value than more recent ones.
Note5: In the code i have included many color combinations (some horrible :-) )
Note6: This was an experiment while i was quite bored although ended enjoying playing with it.
Have fun! :-)
I leave it here because i am getting dizzy.

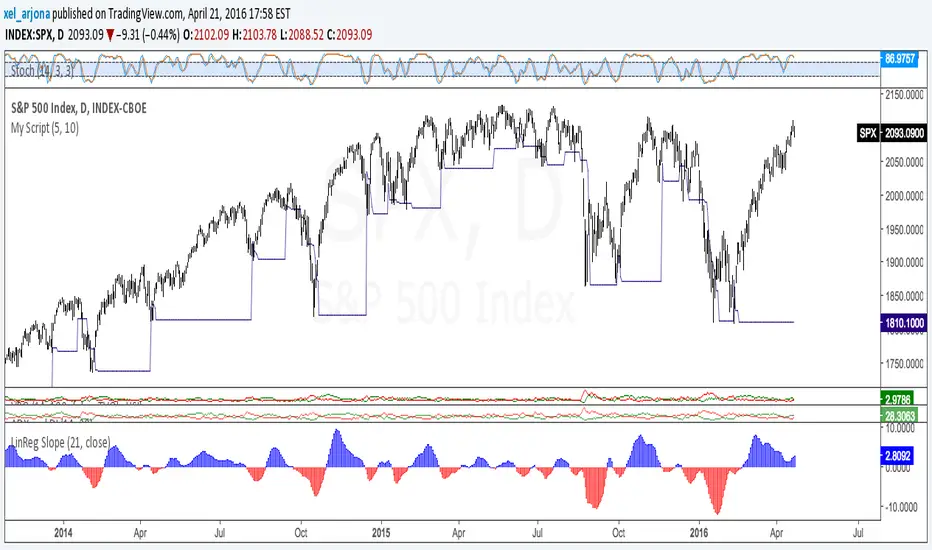
ORDINARY LEAST SQUARES Slope by @XeL_ArjonaORDINARY LEAST SQUARES Slope by @XeL_Arjona
Ver. 1 by Ricardo M Arjona @XeL_Arjona
DISCLAIMER:
The Following indicator/code IS NOT intended to be a formal investment advice or recommendation by the author, nor should be construed as such. Users will be fully responsible by their use regarding their own trading vehicles/assets.
The embedded code and ideas within this work are FREELY AND PUBLICLY available on the Web for NON LUCRATIVE ACTIVITIES and must remain as is.
WHAT'S THIS?
This is a REAL mathematically approach of an ORDINARY LEAST SQUARES LINE FITTING SLOPE as TradingView currently don't have a native one embedded, neither as a pine function. Other "Sope" indicators from this linear regression model I found on public library are currently based on "momentum" rather tan slope.
Any modifications or additions are quite welcome!
Cheers!
@XeL_Arjona
BUY & SELL PRESSURE by RegressionBUY & SELL PRESSURE by Regression Analysis at candle price/volume (Rate-Of-Change)
Ver. 3 By Ricardo M Arjona @XeL_Arjona
DISCLAIMER:
The Following indicator/code IS NOT intended to be a formal investment advice or recommendation by the author, nor should be construed as such. Users will be fully responsible by their use regarding their own trading vehicles/assets.
The embedded code and ideas within this work are FREELY AND PUBLICLY available on the Web for NON LUCRATIVE ACTIVITIES and must remain as is.
WHAT'S THIS?
This is my 3rd. revision of the original implementation for AmiBroker by Karthik Marar's of it's BUY AND SELL PRESSURE INDICATORS but this time, constructed under a complete REGRESSIVE ANALYSIS premise based in Rate Of Change (A kind of Slope but measured in % Performance).
Some minimal adaptation's (and cleaning) have been made:
Instead of simple Range calculation at price, Rate Of Change (Regressive) is used.
Oscillator of Pressure can be deactivated in favor of a simple RoC Cumulative Pressures at candle.
Oscillator can read Volume data from external tickers for accurate Index calculation. ( NYA can use TVOL as example.)
Code is small, cleaner and faster =) !
Cheers!
Any feedback will be welcome...
@XeL_Arjona

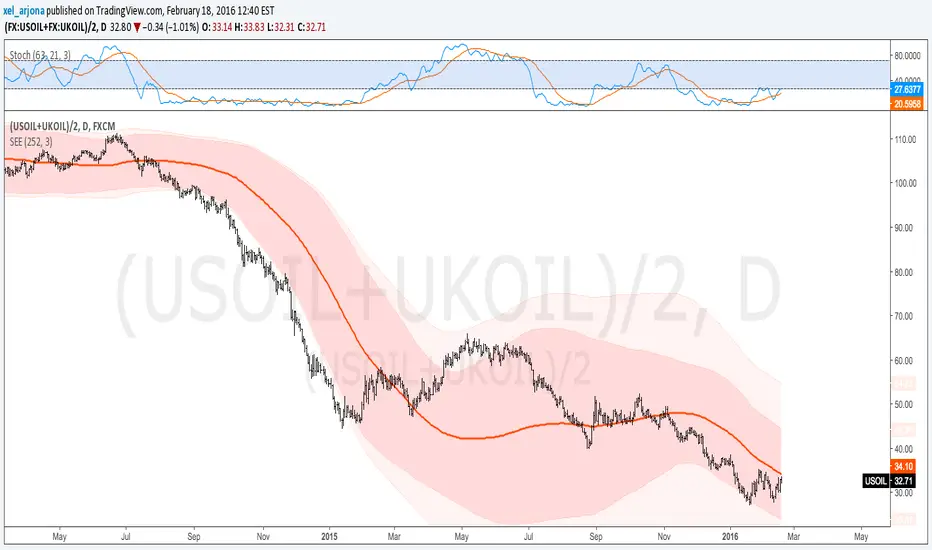
Standard Error of the Estimate -Composite Bands-Standard Error of the Estimate - Code and adaptation by @glaz & @XeL_arjona
Ver. 2.00.a
Original implementation idea of bands by:
Traders issue: Stocks & Commodities V. 14:9 (375-379):
Standard Error Bands by Jon Andersen
This code is a former update to previous "Standard Error Bands" that was wrongly applied given that previous version in reality use the Standard Error OF THE MEAN, not THE ESTIMATE as it should be used by Jon Andersen original idea and corrected in this version.
As always I am very Thankfully with the support at the Pine Script Editor chat room, with special mention to user @glaz in order to help me adequate the alpha-beta (y-y') algorithm, as well to give him full credit to implement the "wide" version of the former bands.
For a quick and publicly open explanation of this truly statistical (regression analysis) indicator, you can refer at Here!
Extract from the former URL:
Standard Error Bands are quite different than Bollinger's. First, they are bands constructed around a linear regression curve. Second, the bands are based on two standard errors above and below this regression line. The error bands measure the standard error of the estimate around the linear regression line. Therefore, as a price series follows the course of the regression line the bands will narrow, showing little error in the estimate. As the market gets noisy and random, the error will be greater resulting in wider bands.