Bitfinex Long vs Short RatiosWas impressed with the 'Longs vs Shorts Ratio' idea from the tweet below so I coded an indicator, enjoy.
twitter.com
Ratio
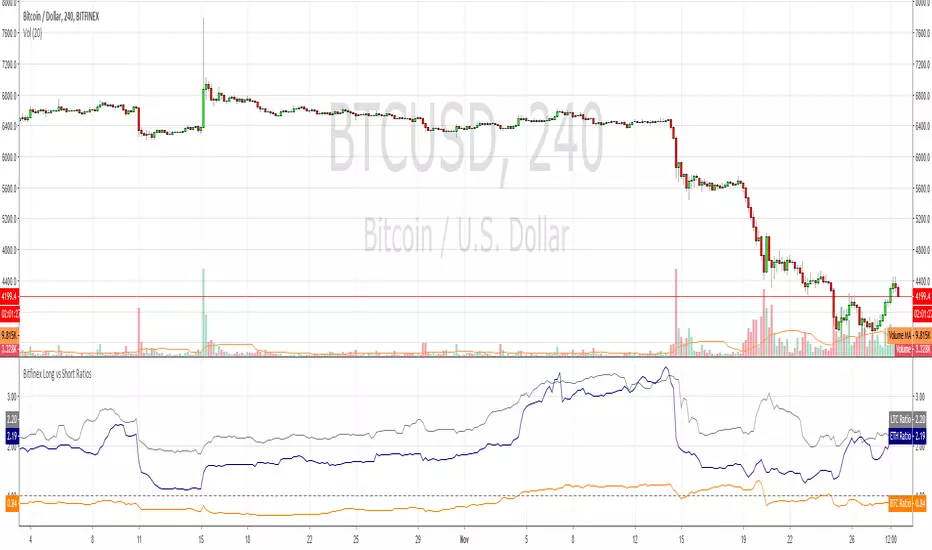
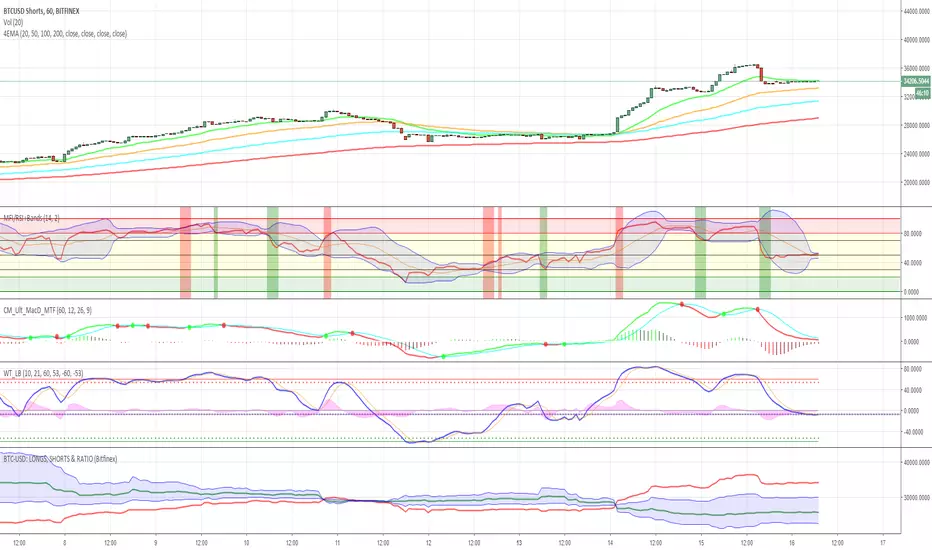
BTC-USD: LONGS, SHORTS & RATIO (Bitfinex)This script allows you
1. to plot the outstanding BTC long (green) and/or short (red) positions
2. to plot an area (blue) corresponding to the ratio between the outstanding long and short positions, shifted and rescaled, such that the zero-line corresponds to the mid-point between the long and short positions: ratio => ratio * mid + mid
OratioA simple ratio between two assets. When the ratio tops or bottoms out it can anticipate inversions in both assets.


Stupid strategyStrategy with simple stop-loss and take-profit in percentage. If last trade was a successful one then repeat it. If not successful - do a reversal trade.

BITFINEX Long to Short RatioShows the ratio of longs to shorts. Above 1.0 means more longs. Below 1.0 means more shorts. A value of 1.0 means equilibrium.

Volatility RatioVolatility Ratio indicator script. This indicator was originally developed by Jack Schwager.

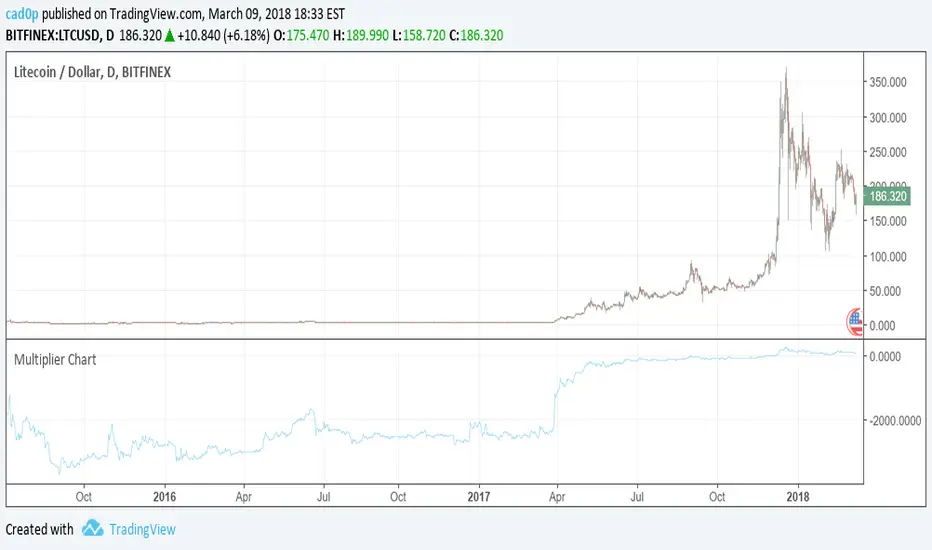
Multiplier ChartI am proposing an alternative to the percent change.
An alternative that is symmetrical to both positive and negative change, unlike percentage change.
The simple idea is to have a positive number if the reference value (called val in the script) is lower than the stock value and needs to be multiplied;
a negative number instead if the reference number is higher than the stock value, so the reference value needs to be divided.
Multiplying all by 100 to give clearer and more readable results, the Multiplier would have a huge gap between +100 and -100, because a stock multiplied by 1 or divided by 1 are the same thing.
So we need to compromise and move all positive numbers down by 100 and all negative numbers up by 100. This actually gives a similar result to percentage change, and it is actually identical in the positive range.
The fundamental difference lies on the negative range, which is completely symmetrical. So if a stock goes up 100 points one day (doubles), and the next it goes down another 100 points (halves), at the end of the second day the stock has the same value as it had at the beginning of the first day! On percentage change it would be +100% the first day and -50% the second.
We mustn't undervalue the human tendency to compare a 1% change to a -1% change, but they do not mean the same even if they seem to indicate so.
A clear example of this can be found on CMC 0.60% -3.56% -3.56% (CoinMarketCap), in which each day are shown the best and worst performing coins of the day. So you might see a +900% there in the top performing, but you'll never see a -900%, because percentage change cannot go further than -100%. It is a fundamentally asymmetric scale that can confuse people a lot especially in those fast moving new markets.ù
I am welcome to feedback and all kinds of opinions and critics.
Some interesting things to note: you can use it as a percentage change indicator or as a different perspective to a stock chart. In fact, it lets you see how big of a difference it made buying coins when they were very cheap, because when they are cheap a difference of what it might seem nothing is amplified by all the gains that the stock/coin made after. So, looking at coins charts using this indicator shows how "not flat" were the early days, which in a normal chart are flattened to 0.
EMA RatioThis system is called " EMA Ratio" . Using a special formula developed by myself, I have developed it in a view to spot trading opportunities of trend following or counter-trend.
Blue line in the TA means positive growth in prices of a security. A reading higher than 1 is somehow an indication of prices making higher highs, but in the meantime watch out for a decline in its readings, which may imply the uptrend is fading or reversing. It is just the opposite for the red line, which means negative growth in prices.
Traders can stick to either one lines, or both of them, and look for crossover signals. To make this more convenient, crossing alert is already set up. Hope you will find it helpful. Appreciate likes and comments!

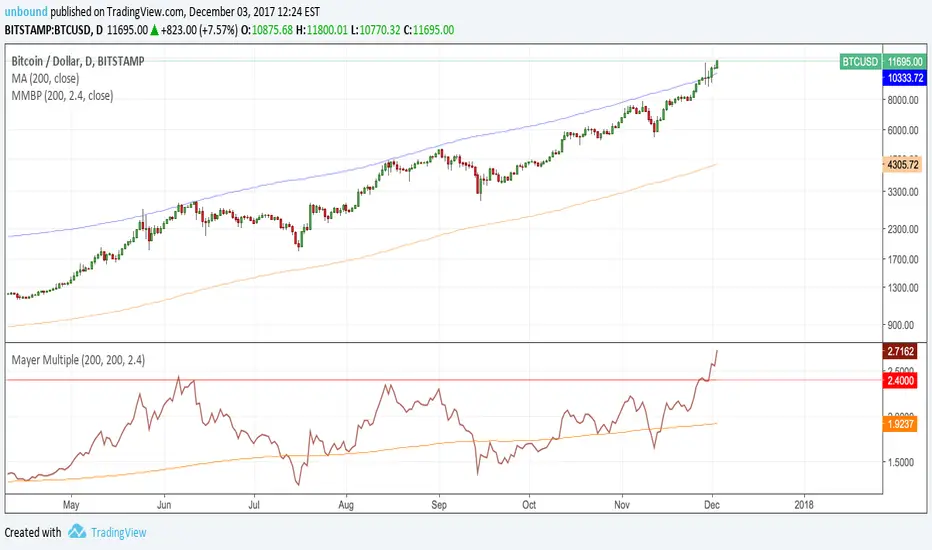
Mayer MultipleFollowing Preston Pysh's "Bitcoin Mayer Multiple" study, I made this simple script to plot the Mayer multiple by calculating the ratio between bitcoin price and its 200-day moving average. It also plots the moving average of ratio itself.
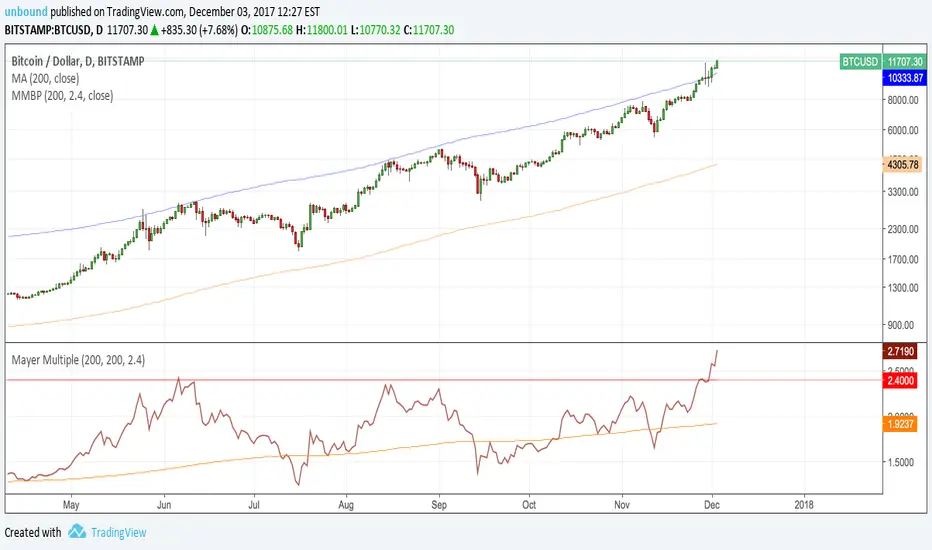
Mayer Multiple Buy PriceFollowing Preston Pysh's "Bitcoin Mayer Multiple" study, I made this simple script to plot the recommended buy price based on the calculated 2.4x ratio between bitcoin price and its 200-day moving average. The ratio and SMA length have default values of 2.4 and 200 and can be adjusted.

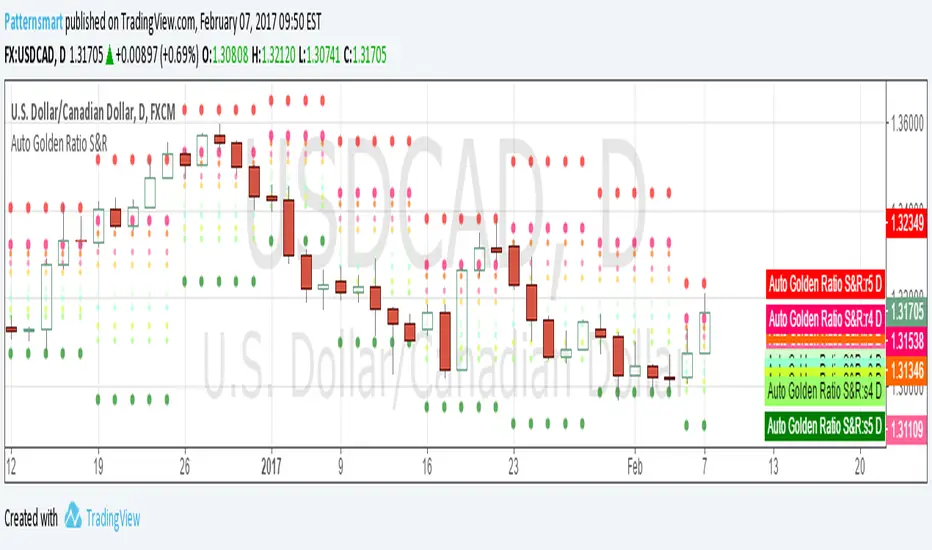
Automatic Golden Ratio Support & ResistanceThe golden ratio is also called the golden mean or golden section.
It has been used to analyze the proportions of natural objects as well as man-made systems such as financial markets.
The mathematics of the golden ratio and of the Fibonacci sequence is intimately interconnected. The Fibonacci sequence is: 1, 1, 2, 3, 5, 8, 13, 21, 34, 55, 89, 144, 233, 377, 610, 987, ....
This Golden Ratio indicator automatically plots 5 support levels and 5 resistance levels based on the golden ratio for current timeframe. It shows a possible price range for current session, you can easily identify the major and minor support/resistance levels from the chart.
The levels of support and resistance are formed at the beginning of a new session
This indicator works on all default time frames.
It will never repaint.
There is no parameter. All you need to do is to load it to your chart.
Click the image links to view it in original size.
3.bp.blogspot.com
2.bp.blogspot.com
2.bp.blogspot.com
3.bp.blogspot.com
2.bp.blogspot.com
2.bp.blogspot.com
1.bp.blogspot.com
////////////////////////////////////////////////////////////
// Technical Analysis & Research Patternsmart
//
// Custom indicators, Strategies, SCAN, Screener, Backtesting, Converting service for:
// Tradingview, NinjaTrader, Thinkorswim, MetaTrader, MetaStock, Multicharts, Prorealtime, etc.
////////////////////////////////////////////////////////////
Tarzan's spread ratio indicator - DeLuxeThis indicator plots any two securities as a spread ratio using either +,-,/, or *.
It also allows you to use a simple moving average of length 1 to n for your spread ratio.
If you know what you want to do but don't know how to code it, we can work it out, you can float me some cheese on paypal and I'll do a nice job. This indicator is yours for free.
Tarzan = noprism@hushmail.com
Peace

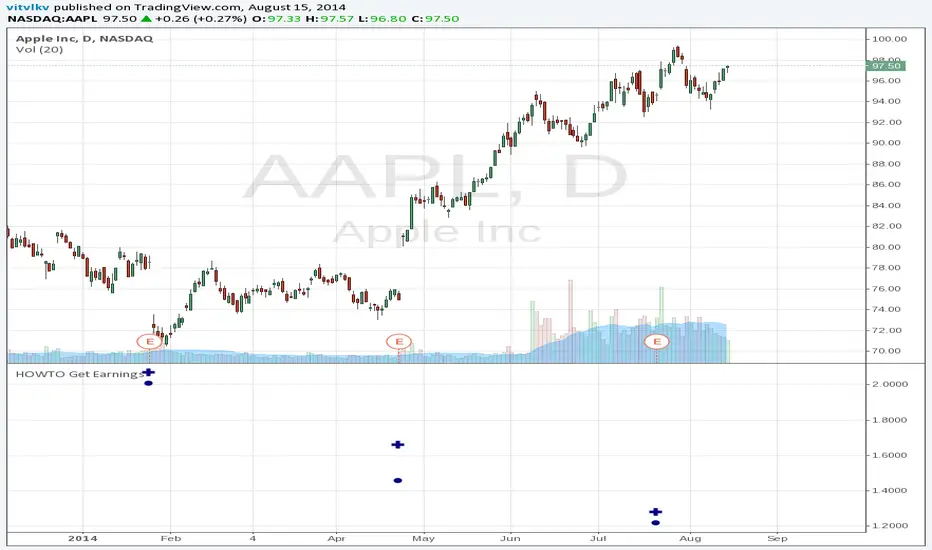
Earnings S/R Levels [LazyBear]These levels are based on price around earnings day. I have implemented support for 2 calculation modes:
Mode 1: Level = (low of 1 day prior to earnings + high of 1 day after earnings) / 2.0
Mode 2: Level = (hl2 of 1 day prior to earnings + hl2 of 1 day after earnings + close from earnings day) / 3.0
Chart above shows "Mode 1". Mode can be changed via options page.
This indicator was requested by user @mika2k1ff. I learnt more about this idea from @DanV and @TimWest (Thanks guys :)). BTW, TimWest has an indicators package, "Key Hidden Levels", that has this and more.
Do let me know how you use this, I am very intrigued by the potential this idea shows. Thanks.
For a complete list of my indicators:
- GDoc: docs.google.com
- Chart:

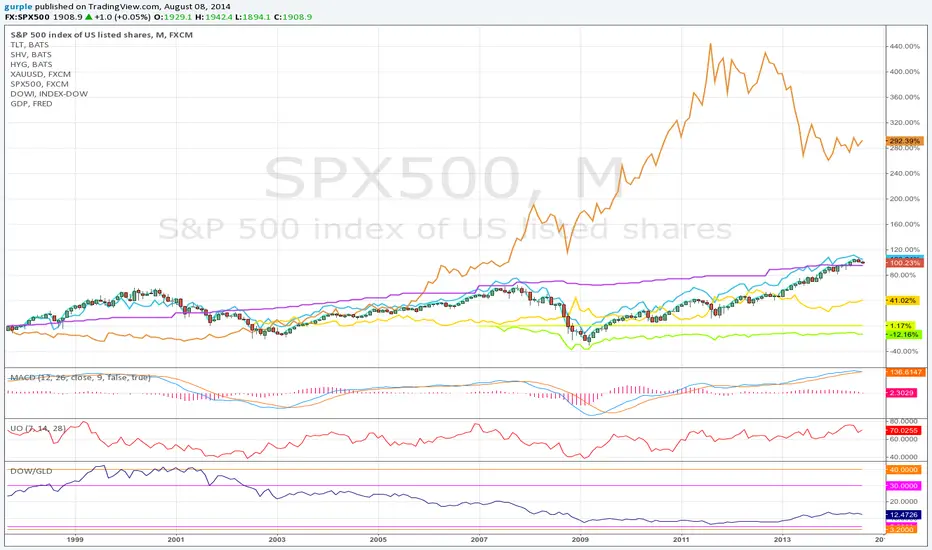
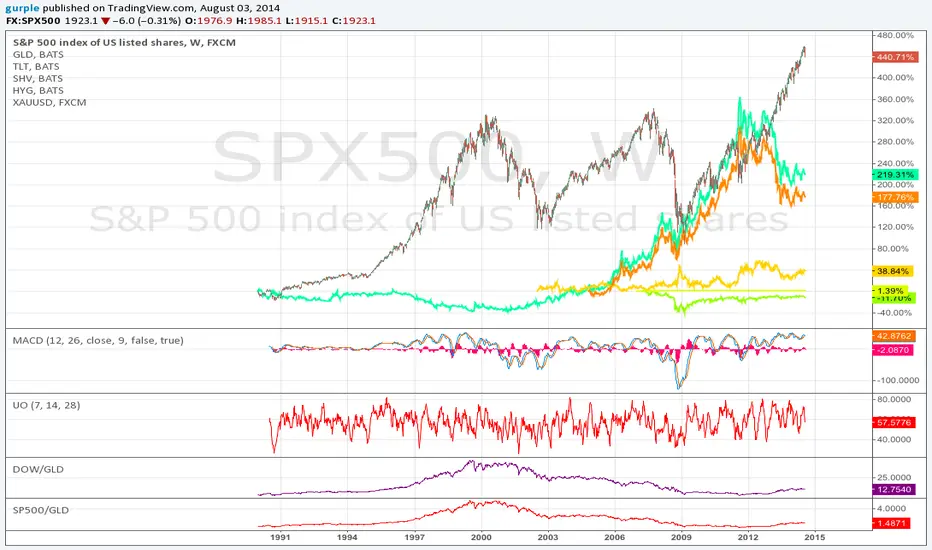
DOW / GOLD RatioThis indicator shows the ratio between the DJIA and the price of gold. When the ratio is below 5 it is generally accepted that a rotation from commodities to equities should be investigated. When the ratio is above 30 it is, likewise, advised to consider rotating from equities to commodities.
This is a modest improvement of the script to mark the key thresholds where equities/commodities holdings rotations could be prudent. I’m sure I’ll be submitting a number of instances of these scripts as I learn the syntax and features while developing them.