Position Sizing Tool - Fixed Loss - Multi Asset [RSC]
This script is an Multi Asset measurement tool that can be used to evaluate or keep track of trades. Like the long and short position drawing tools, it calculates a risk reward ratio and a risk-adjusted position size from multiple entries (4 maximum), stop and take profit multiple levels ( 4 maximum) , but it also does much more:
• It can be used to configure long or short trades.
• All monetary values can be expressed in any number of currencies.
• The value of tick/pip movement (which varies with the position's size) is displayed in the currency you have selected.
• It does live tracking of the position.
• You can configure alerts on entries and exits.
█ HOW TO USE IT
Load the indicator on an active chart.
When you first load this script on a chart, you are able specify following parameter
• Account Balance
• Account currency.
And for each asset (Max 8):
• Symbols Ticker (and Exchange)
• Risk per trade (% or Amount base on Account Currency)
• Account Size
• Entry Time
• Entry levels (Max. 4)
• Leverage (only works for crypto) (same leverage for all entries)
• Stop loss level.
• Take profit level (Max. 4)
• Exit level percentage (Max. 4)
Once you have entered (or modify) parameters, the script will draw trade zones and levels labels containing the trade metrics:
• determines if the trade is a long or short from the position of the take profit and stop loss levels in relation to the entry price. If the take profit level is above the entry price, the stop must be below and vice versa, otherwise an error occurs.
• You can change levels by entering new values in the script's settings.
Once you place the position tool on a chart, it will appear at the same levels on symbols that you selected in script setting and nothing showed up for other symbols.
If your scale is not set to "Scale price chart only", the position tool's levels will be taken into account when scaling the chart, which can cause the symbol's bars to be compressed. If your scale is set to "Scale price chart only", the position tool will still be there, but it will not impact the scale of the chart's bars, so you won't see it if it sits outside the symbol's price scale.
█ FEATURES
Display
The position tool displays the following information for entries:
• The price level with “ Stoploss/Entry/Target” sign before it.
• Open or Closed P&L: For an open trade, the "Open P&L" displays the difference in money value between the entry level and the chart's current price.
For a closed trade, the "Closed P&L" displays the realized P&L on the trade.
• Quantity: The trade size, which takes into account the risk tolerance you set in the script's settings.
• RR: The reward to risk ratio expresses the relationship of the distance between the entry and the take profit level vs the entry and the stop level.
Example: A $100 stop with a $100 target will have a ratio of 1:1, whereas a $200 target with the same stop will have a 2:1 ratio.
• Per tick/pip: Represents the money value of a tick or pip movement.
• Their distance from the entry in money value, percentage and ticks/pips.
• The projected end money value of the position if the level is reached. These values are calculated based on the trade size and the currency.
█ Currency adjustments
This indicator modifies the trade label's colors and values based on the final Profit and Loss (P&L), which considers the dynamic exchange rate between base and conversion currencies in its calculations when the conversion currency is a specified value other than the default. Depending on the cross rate between the base and account currencies, this process can yield a negative P&L on an otherwise successful simulated trade.
For instance, if your account is in currency XYZ, you might buy 10 Apple shares at $150 each, with the XYZ to USD exchange rate being 2:1. This purchase would cost you 3000 units of XYZ. Suppose that later on, the shares appreciate to $170 each, and you decide to sell. One might expect this trade to result in profit. However, if the exchange rate has now equalized to 1:1, the return on selling the shares, calculated in XYZ, would only be 1700 units, resulting in a loss of 1300 units XYZ.
The indicator will mark the P&L and the target labels in red in such cases, regardless of whether the market price reached the profit target, as the trade produced a net loss due to reduced funds after currency conversion. Conversely, an otherwise unsuccessful position can result in a net profit in the account currency due to conversion rate fluctuations. The final losses or gains appear in the label metrics, and the corresponding color coding reflects the trade's success or failure.
█ Settings
The settings in the "Trade sizing" section are used to calculate the position size and the monetary value of trades. Two types of risk can be chosen from the menu; a percentage based risk calculation, or a fixed money value. The risk is used to calculate the quantity of units to purchase to achieve that level of risk exposure. Example: An account size of $1000 and 10% risk will have a projected end amount of $900 if the stop loss is hit. The quantity is a product of this relationship; a projected number of units to allow for the equivalent of $100 of risk exposure over the change in price from the entry to the stop value.
You can control the appearance of the tool and the values it displays in the settings following these first two sections.
Position

EntryPrice Gain&Loss IndicatorThis indicator takes (1) an entry price or average position price and (2) position size (denominator) to calculate current gain or loss and returns those as well as the position change in percent. It will also draw into the Chart and show relevant data in a table.
It is mainly supposed to help tracking an (average) spot position easily.
It is recommended to switch it to invisible when switching to other charts.
You can also use several instances of the indicator to track your positions in different assets.
Features:
- table position and text size can be adjusted
- colors can be changed
(recommending 25% opacity for plot backgrounds)
- several instances possible
(recommended to tuen indicator invisible when switching to other charts or analyzing
Version 1.0
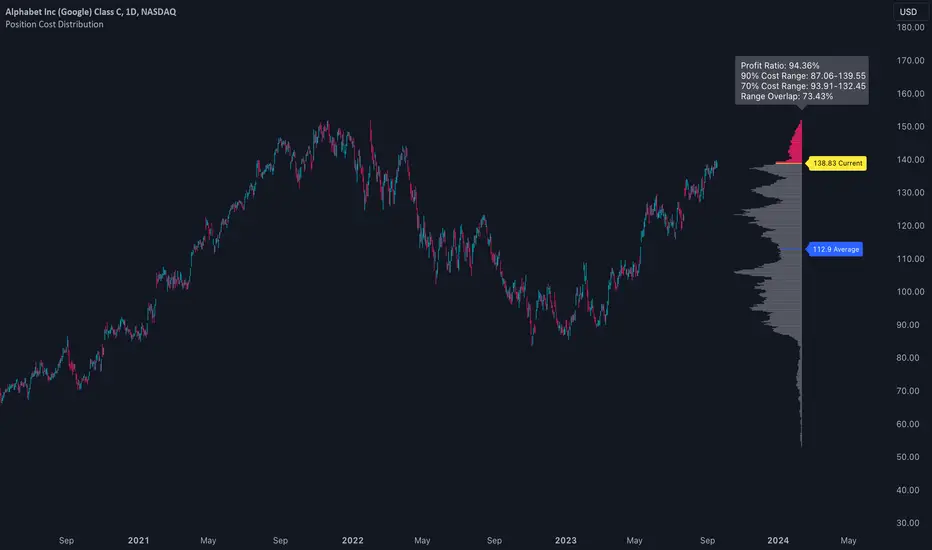
Position Cost DistributionThe Position Cost Distribution indicator (also known as the Market Position Overview, Chip Distribution, or CYQ Algorithm) provides an estimate of how shares are distributed across different price levels. Visually, it resembles the Volume Profile indicator, though they rely on distinct computational approaches.
🟠 Principle
The Position Cost Distribution algorithm is based on the principle that a security's total shares outstanding usually remains constant, except under conditions like stock splits, reverse splits, or new share issuance. It views all trading activity as simply exchanging share positions between holders at different price points.
By analyzing daily trade volume and the prior day's distribution, the algorithm infers the resulting share distribution after each day. By tracking these inferred transpositions over time, the indicator builds up an aggregate view of the estimated share concentration at each price level. This provides insights into potential buying and selling pressure zones that could form support or resistance areas.
Together with the Volume Profile, the Position Cost Distribution gives traders multiple lenses for examining market structure from both a volume and positional standpoint. Both can help identify meaningful technical price levels.
🟠 Algorithm
The algorithm initializes by allocating all shares to the price range encompassed by the first bar displayed on the chart. Preferably, the chart window should include the stock's IPO date, allowing the model to distribute shares specifically to the IPO price.
For subsequent trading sessions, the indicator performs the following calculations:
1. The daily turnover ratio is calculated by dividing the bar's trading volume by total outstanding shares.
2. For each price level (bucket), the number of shares is reduced by the turnover amount to represent shares transferring from existing holders.
3. The bar's total volume is then added to buckets corresponding to that period's price range.
Currently, the model assumes each share has an equal probability of being exchanged, regardless of how long ago it was acquired or at what price. Potential optimizations could incorporate factors like making shares held longer face a smaller chance of transfer compared to more recently purchased shares.
────────────────────────────────────────────
中文介绍:该指标为“筹码分布”的一个 TradingView 实现 :)
Position and Risk Calculator (for Indices) [dR-Algo]Position and Risk Calculator : Your Ultimate Risk Management Tool for Indices
The difference between a novice and a seasoned trader often comes down to one essential element: risk management. While trading indices, the challenges are even more intense due to market volatility and leverage. The Position and Risk Calculator steps in here to bridge the gap, providing you with an efficient tool designed exclusively for indices trading.
Key Features:
User-Friendly Interface: Designed to integrate effortlessly with your TradingView chart, this tool's interface is intuitive and clutter-free.
Dynamic Price Level Adjustment: Move your Entry, Stop Loss, and Take Profit levels directly on the chart for an interactive experience.
Account Balance Input: Customize the tool to understand your unique financial situation by inputting your current account balance.
Trade Risk Customization: Define how much you're willing to risk per trade, and the tool will do the rest.
Automated Calculations: The indicator calculates the maximum monetary risk and translates it into the maximum lot size you can afford. It delivers a full-integer lot size to make your trading decisions easier.
Comprehensive Risk Evaluation: Beyond lot sizes, it provides you with the Cost-to-Reward Ratio (CRV) of your trade, the actual monetary risk according to the calculated lot size, and the potential profit.
How To Use:
Once you add the Position and Risk Calculator to your TradingView chart, a new interactive panel appears. Here’s how it works:
Set Price Levels: Using draggable lines on the chart, set your Entry Price, Stop Loss, and Take Profit levels.
Account Details: Go to settings and enter your Account Balance and your desired risk percentage per trade.
Automatic Calculations: As soon as the above details are set, the indicator goes to work. It first calculates your maximum risk in monetary terms and then translates that into the maximum lot size you can take for the trade.
Review and Trade: The indicator shows you all the vital statistics - CRV of the trade, the money at risk according to the calculated lot size, and the possible profit.
Why Choose This Tool?
Informed Decisions: Your trading decisions will be based on concrete numbers, removing guesswork.
Time-saving: No need for manual calculations or using separate tools; everything is in one place.
Focus on Trading: By automating the risk management aspect, this tool allows you to focus more on your trading strategy and market analysis.
Tailor-Made for Indices: Unlike many other tools that try to serve all markets, the Position and Risk Calculator is designed specifically for indices trading.
Remember, effective risk management is what separates successful traders from those who burn out. The Position and Risk Calculator not only helps you define your risk but also helps you understand it, empowering you to trade with confidence.
So why not give yourself the best chance of success? Add the Position and Risk Calculator to your TradingView setup and experience the difference it can make.

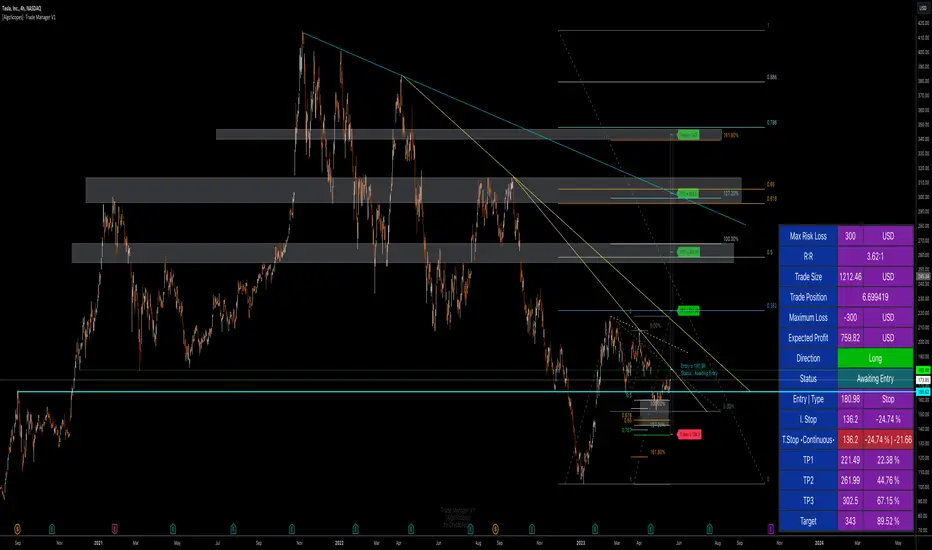
Trade Manager & Position Size Tool & PnL Tracker [AlgoScopes] V1Position size tool, leverage calculator, trade tracker, money management, trade presentation, risk reward management, margin position, live profit and loss, that's all in this one Trade Manager indicator.
The idea for this indicator comes from two years ago when I was helping a friend who, at the request of 15-20 members from our telegram group, wanted to create a paid group and share our ideas for trade with them (it started as an experiment for just a month or two and ended with 15 months with over 500 trading ideas and signals, with a complete TA chart). If I had time to create this indicator back then for members, it would have been much easier for them to be able to understand and follow the trade idea that was presented through a classic chart, with all the things that a TA must have:
Entry (as well as the reason for entry),
Stop (where the idea for the trade is no longer valid),
Target (with the reason why it is the target for that trade),
Take profits (taking part of the profit on the way to the target).
The majority of members still did not understand how much position to trade, what is the possible profit or loss, if the margin trade is how much leverage to use, in one word “money management”. The most important rule that every trader must follow is "Plan your trade and trade your plan". Learn money management and you are halfway there to becoming a successful trader. It is only after all that, you learn to use some of the "holy grail" indicators. When you have mastered those first two rules, find and master your favorite indicator or trading style (the most important thing is to stick to those two rules). The margin | leverage is also included in the script, for which there are so many dilemmas, arguments and discussions. (that many who still do not understand margin, would trade that it is not passionate if it is controlled). Too much for an introduction, especially since this indicator has so much to explain.
Most importantly, this is an invite-only indicator, and there are so many free indicators on tradingview that can also serve you very well. As far as I know, all exchanges have a calculator tool to calculate the possible profit and loss for each trade you plan to take.
*This indicator is not recommended for scalping on a 1min chart because the script, as you will see, is very complex, so the loading time is longer than with simpler indicators.
💠 ABOUT THE SCRIPT
This script is made to help manage trade. In this one indicator you have the possibility to do technical analysis, calculation for trade (four types: account size risk, trade investment, maximum to lose or position size), monitor 'PnL' (profit and loss in real time) do the calculation in the second, maybe local currency, and set an alert (from entry to any other change in trade). As the script is made for general use, some slight differences are possible for real time 'PnL' or 'ROI'. Always do a test before you start trading with larger amounts. The script is recommended for intra day trading and above. The script is not recommended for scalping on the 1min chart
💎 PROCESS TO ADD SCRIPT TO CHART
Possible trade on break example trade
As this script is invite-only, to add it to the chart you need to click on Indicators and find it under the 'Invite-Only' section. When you add the script to the chart (as it is interactive), you will be asked to do 4 steps.
🔸 'SET TRADE TIME'
Click on the chart where the last vertical bar is.
If you are already in the trade, then find the bar|time where the trade started
(you want to follow trade or trade presentation)
🔸 1) 'SET ENTRY'
Click on the horizontal level where you want to place the Entry
🔸 2) 'SET STOP'
Click on the horizontal level where you want to set the Stop
🔸 3) 'SET TARGET
Click on the horizontal level where you want to place the Target
💎 CONFIRM INPUTS
After you have done those 4 steps, a popup will appear with the relevant inputs for the trade.
You will see that some inputs are already filled (done in those 4 steps before, Entry, Stop and Target). You can correct them if you want (you will sometimes notice a longer 'space decimal' for the trade ticker, but this will not affect the calculator or other parts of the script). You can do the rest of the inputs for trade or finish it later when the script is loaded on the chart (it is recommended to fill in 'Trade Type' and 'Amount'. Don't forget to click on the "Apply" button to load the script on the chart.
💎 INDICATOR LOADED ON CHART
• When the indicator is loaded on the chart (regardless of whether it is a new trade or a trade that has already started), the following items are displayed by default:
🔸 ' Trade Table ' shows all relevant information for the trade
🔸 ' Trade Box ' with lines for Entry, Stop and Target (Take Profits if enabled)
🔸 ' Trade Box Labels ' with relevant data
• The Entry label is also the trade status label, and if the trade is not active, by default it is the Entry color
If the trade is active or when a new trade reached Entry, several new things are noticeable:
• Entry|Status label as well as status row in table will change color as well as 'Entry Reached' text
• Several extra columns relative to trade will be added to the Entry|Status label
• 3 new columns will also appear on the Trade Table (Live PnL, Live min PnL and Live ROI)
• If Trail Stop is enabled, the label will change the text to T.Stop and change color depending on whether it is in loss or profit.
• If Trail Stop is enabled, inside Trade Box trail line it will follow price action inside the box, while the label will always be fixed at the initial level
• A vertical colored line will appear on the right side of the Trade Box (depending on whether the trade is in profit or loss) which shows as in the Trade Table like Live PnL
⚪ SETTINGS
💎 Trade Account Setup
🔸 ‘Trade Type’
• 'Account Capital' or portfolio (with combination '% Capital Risk')
• 'Investment' (how much you want to invest in the trade)
• 'Risk To Lose' (how much you want to risk losing)
• 'Position Size' (exact position size, units|share for trade)
🔸 ‘Account Type’
• If the account is in another currency or you want to see possible profit | loss in local currency
• Around 150 world and local currencies supported by ICE exchange
🔸 ‘Amount’
• Amount for ‘Trade Type’
🔸 ‘% Capital Risk’
• Only for ‘Account Capital’ trade type
(i.e. 10.000 account capital with ‘% Capital Risk’ 4 is 10.000 x 4% = maximum loss 400)
🔸 ‘Leverage’
• Enable|Disable for margin trade i size of leverage (maximum 125x)
(be sure to study how and when to use margin trade through the tutorial, because margin trade can be very dangerous. If you have not perfected margin trade, there is a great possibility of losing most or even all of your account capital).
💎 TRADE ENTRY & TARGET & STOP & T.STOP & DATE | TIME
🔸 ‘Trade Date & Time’
🔸 ‘Entry’
🔸 ‘Stop’
🔸 ‘Target’
• (all was set in the previous step but can be correct/adjusted if needed)
🔸 ‘Market Entry’
• Enabled will move Entry on that bar close
🔸 ‘Liquidation’ (enabled by default)
• Show ‘Warning’ if trade Stop is close or invalid (trade will hit liquidation before reached Stop level)
🔸 ‘Trailing Type’ (4 trailing stop type)
• ‘Disabled’ (Stop will stay the entire time at the initial stop level)
• ‘Continuous’ (I.Stop follow price by distance or percent when price reached Trail start level)
• ‘Stepped’ (I.Stop moves to previous level when price reached Trail start level)
• ‘Breakeven’ (I.Stop moves to Entry when price reached Trail start level)*
* (least one Take Profit enabled)
🔸 ‘Trailing Active’ (Entry, TP1, TP2 and TP3)
• Trailing stop starts level if ‘Trailing Type’ is enabled
🔸 ‘Trailing by’ (distance or percent)
• ‘Distance’ (T.Stop will follow price action by distance)
• ‘Percent’ (T.Stop will follow price action by percent)
(this is a good example to see the difference between trailing by initial distance and initial percentage)
🔸 ‘T.Stop Distance & Percent’ (initial distance and percent for table trade only)
• Useful for bot or exchange
🔸 ‘Stop, T.Stop, Target and TP’s in PIP’s’
• Distance in PIP’s
💎 TAKE PROFIT
🔸 ‘Split Target’ (enabled by default to three take profits (TP) with auto split)
🔸 ‘Number of Take Profits’ (up to three take profits)
🔸 ‘Type’ (auto or manual)
• For manual type fill all prices to preferred level. TP percent (TP1%, TP2% and TP3% ) and Target% is how much profit you want to take on a specific level.
• PLEASE NOTE sum of all enabled ‘TP’ and targets = 100 (e.g. two TP and sets TP1% to 25 and TP2% to 35, then Target% should be 40% i.e. 25 + 35 + 40 = 100)
💎 TRADE BOX & LINES
🔸 ‘Target Line’ (color for target line and trade table ‘direction’)
🔸 ‘Stop Line’ (color for initial line and trail line)
🔸 ‘Entry Line’ (color for entry line and label & table status)
🔸 ‘To Trade Time’ (‘trade box’ left vertical line)
• By default is set to trade date and time
• Unchecked will be moved to the last bar (live time)
🔸 ‘Extended Left’ (extend Entry, Stop, Target and TP’s lines to left)
• To check for possible support|resistance
🔸 ‘Size’ (Entry, Stop, Target and TP’s lines size)
🔸 ‘PnL Box Size’ (line size for vertical box lines)
🔸 ‘Offset’ (right vertical line offset from last bar)
🔸 ‘PnL Box Color’ (right vertical line and trail fill color)
• Color changes for profit & loss
🔸 ‘Box Line Color’ (box base color)
💎 LABELS
🔸 ‘Stop & Target Labels’ (enable|disable stop and target labels)
• By default is set to small (tiny, small, normal, large, huge and auto option)
• Disabled will move all information on Entry|Status label
🔸 ‘Offset’ (label offset from trade box)
🔸 ‘Target Label’ (label color for target and all enabled tp’s)
🔸 ‘Stop Label’ (label color for initial stop and enabled trailing stop)
🔸 ‘Label Text’ (color for label text)
🔸 ‘Status Label Color’ (label table entry|status color when trade is not active)
🔸 ‘PnL’ (entry|status color for profit and loss)
🔸 ‘Size’ (by default set to normal, option tiny, small, normal, large, huge and auto)
🔸 ‘Risk to Reward’ (show risk to reward on labels)
🔸 ‘Extra Info’ (by default disabled, show extra related info for trade on labels)
• Useful if Trade Table disabled
🔸 ‘Close Trade Stats’ (by default disabled, show all info when trade is closed)
• By default is white text color for close trade stats label
💎 ALERTS
🔸 ‘Failed Trade’ (alert if price reached Stop before is active, reached Entry)
• Useful if trade need adjustment but it can also be left as it is
and alert is just warning
🔸 ‘New & Update Alert’ (alert when price reached Entry or change status to enabled Take Profits)
🔸 ‘Trade Closure Alert’ (alert when trade closed, reached Stop, Target or enabled Trail Stop)
• Alert can be in modified or default preset jSon format as well as in plain text format
• Place holders for creating alerts are :
{type}, {symbol}, {exchange}, {ticker}, {base}, {quote}, {timeframe}, {price}, {direction}, {entry}, {stop}, {tstop}, {tp1}, {tp2}, {tp3}, {target}, {tstopstatus}, {status}, {result}
* {type} placeholder is set to ‘Trade Active’, ‘Trade Update’ and ‘Trade Closed’
💎 TABLE DISPLAY
🔸 ‘Trade Table’ (enable|disable trade table)
🔸 ‘Position’ (by default set to bottom right with option bottom, middle and top with left, center and right)
🔸 ‘Size’ (by default set to normal, option tiny, small, normal, large, huge and auto)
🔸 ‘Full Table’ (by default enabled, disabled show small table without some info*)
* check picture for reference
🔸 ‘Presentation’ (by default disabled, hide all info related to PnL in trade currency)
• Useful if trade shared for presentation, hidden trade fiat|currency info)
🔸 ‘Header’ (color for trade table first row)
🔸 ‘Stats’ (color for trade table statistics row)
🔸 ‘Text’ (color for trade table text)
🔸 ‘Error’ (color for all errors if is made when trade is setup)
• Color for errors is for trade table and trade labels
🔸 ‘Fiat Price’ (by default enabled, show info for second fiat*
* if trade is in crypto and ‘quoted’ currency is not stable coin, like ETHBTC, or ‘Account Type’ is set to different currency
🔸 ‘Live Fiat Price’ (if ‘quoted’ currency enabled will show live exchange conversion)
🔸 ‘All Errors’ (enabled by default, show all error if trade setup is wrong)
• When error shows on trade, disabled this to see what|where is error
• Check below for more details
🔸 ‘Tool Tip (chart)’ (enabled show all tooltip on chart)
• Check below for more details
• When you are familiar with indicator, disable popup tooltip
💎 TOOLTIP
All possible tooltips have been added for easier understanding, especially for traders who are just learning how to place a trade. (when you perfect this indicator, you can turn off the tooltip in settings, and you can also normally use the lite version of this indicator, which does not contain all these futures)
🔸 ' Settings Tooltips’
🔸 ‘Chart Tooltips’
🔸 ‘Table Tooltips’
🔴 ERRORS
When you setup trade, not only a novice in trading, but also experienced traders can make a mistake and for this reason all possible errors are included in the indicator which will be shown on the chart by changing the color of the labels as well as on the trade table and in most of the cases and error text.
If the tooltip is enabled in the settings, you can see the reason for the error as well as the solution.
Here are some examples of possible errors.
Stay safe
PLAN YOUR TRADE AND TRADE YOUR PLAN
TradeMaster SignalsTrading effectively requires a range of techniques, experience, and expertise. From technical analysis to market fundamentals, traders must navigate multiple factors, including market sentiment and economic conditions. However, traders often find themselves overwhelmed by market noise, making it challenging to filter out distractions and make informed decisions. To address this, we present a powerful indicator package designed to assist traders on their journey to success.
The TradeMaster indicator package encompasses a variety of trading strategies, including the SMC (Supply, Demand, and Price Action) approach, along with many other techniques. By leveraging concepts such as price action trading, support and resistance analysis, supply and demand dynamics, these indicators can empower traders to analyze entry and exit positions with precision. Unlike other forms of technical analysis that produce values or plots based on historical price data, Price Action brings you the facts straight from the source - the current price movements.
The indicator package consists of three powerful indicators that can be used individually or together to maximize trading effectiveness.
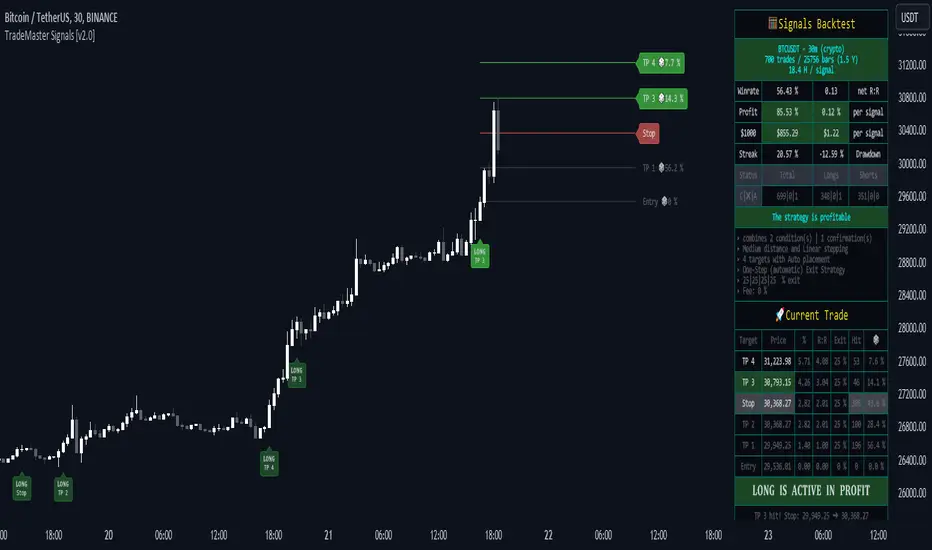
⭐ About the Signals Indicator
This indicator offers a unique opportunity for traders to design their own personalized trading strategy. It has a built-in backtesting system, which allows you to thoroughly analyze the performance of your strategy before implementing it in live trading. With the ability to customize and test your strategy using historical data, the Signals indicator empowers you to make data-driven decisions and refine your trading approach.
👉 How does it work?
The Signals indicator provides users with the ability to select trigger conditions and further narrow them down using confirmations.
Conditions are quantitative factors that influence the generation of signals on the chart and in the backtest table. You can enable multiple conditions to create a comprehensive set of criteria for signal generation.
Confirmations, on the other hand, are qualitative factors that selectively filter out conditions based on their alignment with the chosen confirmations. This helps refine the signals and provide more targeted trading opportunities. Multiple confirmations can be enabled to further enhance the precision of the signals.
A well-balanced strategy in the Signals indicator involves carefully selecting a combination of conditions and confirmations to generate accurate trading signals. Finding the right balance between them is crucial for consistent and profitable trading.
To offer even more flexibility, the Signals indicator includes two powerful main functions:
Target Placement System: This feature allows you to set up to 6 targets with a stop loss level and partial exit percentages. You can choose between automatic target creation or manual customization, giving you control over your profit targets.
Exit Strategy: With this feature, you can define your preferred trailing stop strategy, allowing you to implement a systematic approach to exiting trades. By setting appropriate trailing stop levels, you can limit potential losses, while the system secures profits by automatically closing positions partially when certain price targets are reached. This may help you to maintain discipline in your trading and optimize your risk-reward ratio.
With over 30 unique conditions, 10 confirmations, and the deep Target Placement and Exit Strategy systems, the Signals indicator offers a vast array of possibilities. In fact, there are potentially millions of different strategy outputs available for each ticker. Despite its complexity, the script remains lightweight and fast, ensuring smooth performance.
The Signals Backtest table provides a comprehensive overview of your strategy's performance. You can track your current position with all the necessary details, allowing you to monitor your trades effectively and make informed decisions based on the backtest results.
⚠️ WARNING!
Backtest results do not guarantee future performance. Strategies tested on synthetic data may not accurately represent real-world results. Testing should be conducted on charts that reflect actual closing prices.
The indicator displays buy/sell signals intended to support traders' analysis. There are numerous possibilities and combinations available to create your own unique strategies, whether trading with or against the trend or capturing oversold bounces. These are just a few of the many options! Our indicator can easily be tailored to fit your trading strategy.
The settings that influence the signal-generating algorithm play a crucial role in effectively utilizing the signals. We provide users with the flexibility to modify the settings to align with their trading style, while also offering simple adjustment methods using various techniques.
Each method for modifying the signal settings has been designed to meet specific user needs. It is important to understand that one method is not necessarily more accurate than another.
It is essential to understand that signal indications generally serve as trend confirmations, rather than direct entry and exit points. Focusing on the easy use of signal settings and utilizing other functionalities in our toolkit will likely be a better decision than attempting to find the "holy grail" of optimized signal settings and solely relying on following the signals.
⭐ Conclusion
We hold the view that the true path to success is the synergy between the trader and the tool, contrary to the common belief that the tool itself is the sole determinant of profitability. The actual scenario is more nuanced than such an oversimplification. Our aim is to offer useful features that meet the needs of the 21st century and that we actually use.
🛑 Risk Notice:
Everything provided by trademasterindicator – from scripts, tools, and articles to educational materials – is intended solely for educational and informational purposes. Past performance does not assure future returns.
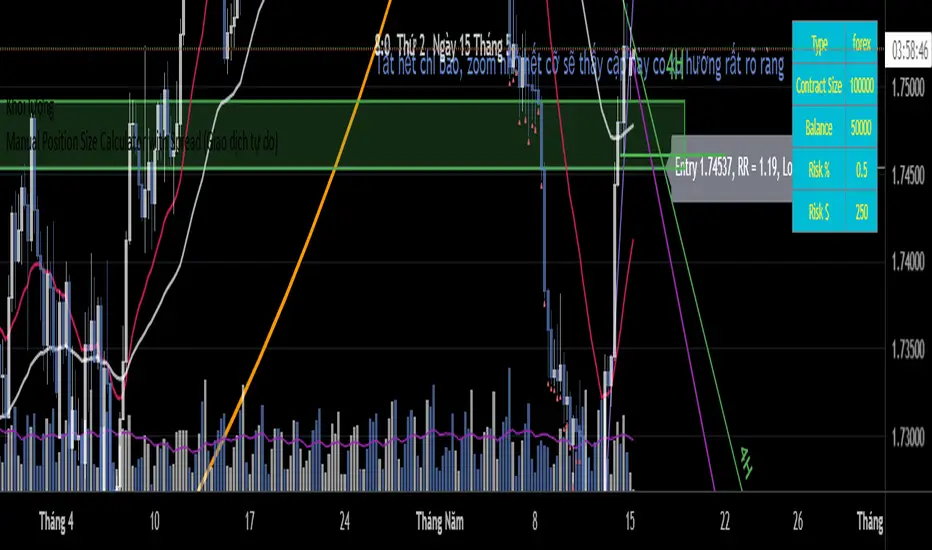
Position Size Calculator (EzAlgo)Upon adding the indicator to the chart, you will be prompted to place entry price lines, stop loss price line, and multiple take profit price lines by clicking at the desired price level on the chart.
Section Summaries
Table Settings: Allows users to select position and font size from drop-down menus. Displays current settings and potential profit/loss values.
Price Points: Users can set their Entry and select whether they want to include a DCA entry, Stop Loss price, Liquidation Buffer %, Take Profit levels and the amount of position to close at each level.
Risk Management: Users fill out their Account Size, set their Risk % (or fixed $ amount) for each Entry, set Manual Leverage, or allow the indicator to automatically choose the leverage based on the Stop Loss price distance from Entry and the Risk % per Entry.
User-Input Descriptions
DCA Price: The price at which users initiate their second, equally sized and leveraged position when using a Dollar-Cost Averaging (DCA) strategy. Upon reaching the DCA Price, the Entry Price adjusts to the Avg Price, calculated as the midpoint between initial and DCA entries.
Liquidation Buffer: A pre-set percentage that determines how close to the Stop Loss a position can get before it's liquidated. This assists the Auto Leverage feature in optimizing the leverage amount according to risk tolerance.
Risk per Entry: The proportion of the account, in % or a fixed dollar amount, that users are willing to risk for each trading position. If DCA is checked, this will assume users are entering with half of the total position size per entry.
Automatic Leverage: Auto Leverage automatically determines the optimal leverage level for a trade based on the user's Stop Loss price distance from the Entry point and the user-defined risk percentage per Entry. It also considers a user-defined Liquidation Buffer, which is a preset percentage determining how close to the Stop Loss a position can get before it's liquidated. This tool allows traders to optimize their leverage amount according to their risk tolerance.
Max Leverage: The highest leverage level users are willing to use, even if the exchange permits higher. This limit applies when the Auto Leverage feature is enabled.

Limit Order + ATR Stop-Loss [TANHEF]This indicator enables interactive placement of limit or stop-limit orders with a trailing ATR stop-loss and optional profit target (with alerts). Refer to the images below for further clarification.
Why use a trailing stop-loss?
A trailing stop-loss serves as an exit strategy when price moves against you, while also allowing you to adjust the exit point further into profit when price moves favorably. The ATR (Average True Range), a reliable measure of volatility, acts as an effective risk management tool, functioning as a trailing stop-loss.
Indicator Explanation
Initial indicator placement: Select Long Limit or Long-Stop Limit order.
Change Entry Type: Switch between Long and Short within settings.
Modify entry price: Drag circle, adjust in settings, or re-add indicator to chart.
Optional Profit Target: Use Risk/Reward ratio or specify price.
Entry anticipation: Estimated ATR stop-loss and profit target as blue circles (fluctuates with volatility changes).
Entry triggered: Actual ATR stop-loss and profit target plotted.
Exit conditions: Stop-loss or profit target hit, exit entry.
Update Frequency: Continuously, Bar Open, or Bar Open on entry then continuously.
ATR Overlap: no entry occurs if the ATR overlaps with price (stop-loss 'hit' already on entry bar)
Table: Displays input settings selected.
Show Only On Ticker: Ability to hide indicator on other tickers.
Long Limit
Long Stop-Limit
Short Limit
Short Stop-Limit
Alerts
1. 'Check' alerts to use within indicator settings (entry, trailing stop hit, profit target hit, and failed entry).
2. Select 'Create Alert'
3. Set the condition to 'Limit Order + ATR Stop-Loss''
4. Select create.
Additional details can be added to the alert message using these words in between Curly (Brace) Brackets:
{{trail}} = ATR trailing stop-loss (price)
{{target}} = Price target (price)
{{type}} = Long or Short stop-loss (word)
{{traildistance}} = Trailing Distance (%)
{{targetdistance}} = Target Distance (%)
{{starttime}} = Start time of position (day:hr:min)
{{maxdrawdown}} = max loss
{{maxprofit}} = max profit
{{update}} = stoploss update frequency
{{entrysource}} = entry as 1st bar source (yes/no)
{{triggerentry}} = Wick/Close Trigger entry input
{{triggerexit}} = Wick/Close Trigger exit input
{{triggertarget}} = Wick/Close Trigger target input
{{atrlength}} = ATR length input
{{atrmultiplier}} = ATR multiplier input
{{atrtype}} = ATR type input
{{ticker}} = Ticker of chart (word)
{{exchange}} = Exchange of chart (word)
{{description}} = Description of ticker (words)
{{close}} = Bar close (price)
{{open}} = Bar open (price)
{{high}} = Bar high (price)
{{low}} = Bar low (price)
{{hl2}} = Bar HL2 (price)
{{volume}} = Bar volume (value)
{{time}} = Current time (day:hr:min)
{{interval}} = Chart timeframe
{{newline}} = New line for text

Position TrackerEnter your purchase price & the quantity.
It'll display a line at that value, with a label indicating the current gain/loss

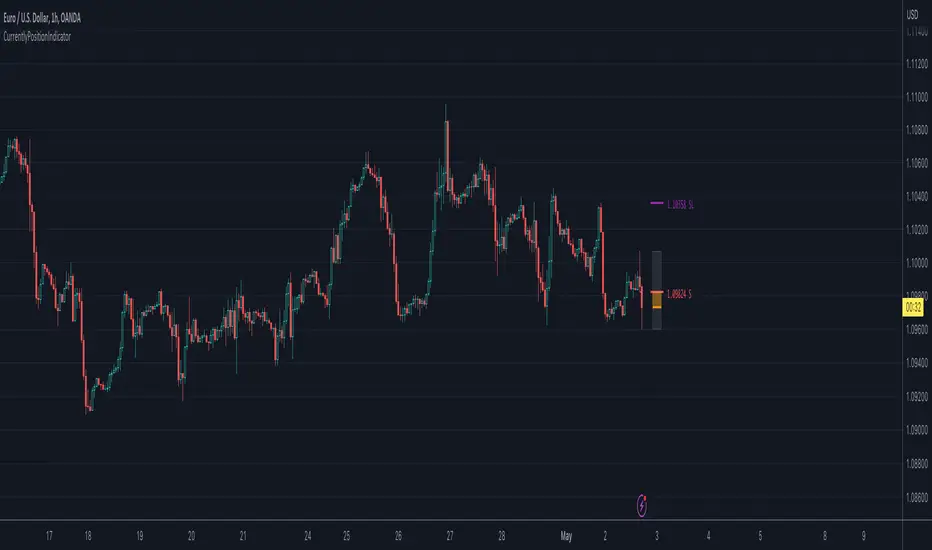
CurrentlyPositionIndicatorLibrary "CurrentlyPositionIndicator"
Currently position indicator
run(_index, _price, _stoploss, _high, _low, _side, _is_entered, _colors, _position_left, _box_width)
Currently positions indicator
Parameters:
_index (int) : entry index
_price (float) : entry price
_stoploss (float) : stoploss price
_high (float) : range high
_low (float) : range low
_side (int)
_is_entered (bool) : is entered
_colors (color ) : color array
_position_left (int) : Left position
_box_width (int) : box's width
Returns: TODO: add what function returns
Regression Channel Alternative MTF V2█ OVERVIEW
This indicator is a predecessor to Regression Channel Alternative MTF , which is coded based on latest update of type, object and method.
█ IMPORTANT NOTES
This indicator is NOT true Multi Timeframe (MTF) but considered as Alternative MTF which calculate 100 bars for Primary MTF, can be refer from provided line helper.
The timeframe scenarios are defined based on Position, Swing and Intraday Trader.
Suppported Timeframe : W, D, 60, 15, 5 and 1.
Channel drawn based on regression calculation.
Angle channel is NOT supported.
█ INSPIRATIONS
These timeframe scenarios are defined based on Harmonic Trading : Volume Three written by Scott M Carney.
By applying channel on each timeframe, MW or ABCD patterns can be easily identified manually.
This can also be applied on other chart patterns.
█ CREDITS
Scott M Carney, Harmonic Trading : Volume Three (Reaction vs. Reversal)
█ TIMEFRAME EXPLAINED
Higher / Distal : The (next) longer or larger comparative timeframe after primary pattern has been identified.
Primary / Clear : Timeframe that possess the clearest pattern structure.
Lower / Proximate : The (next) shorter timeframe after primary pattern has been identified.
Lowest : Check primary timeframe as main reference.
█ FEATURES
Color is determined by trend or timeframe.
Some color is depends on chart contrast color.
Color is determined by trend or timeframe.
█ EXAMPLE OF USAGE / EXPLAINATION

PositionLibrary "Position"
Allows for simulating trades within an indicator.
newTrade(size, price, timestamp)
Creates a new trade object.
Parameters:
size : The size of the trade (number of shares or contracts).
price : The price at which the trade took place.
timestamp : The timestamp of the trade. Defaults to the current time.
Returns: A new trade object.
start(size, price, timestamp)
Starts a new position.
Parameters:
size : The size of the position (number of shares or contracts).
price : The price at which the position was started.
timestamp : The timestamp of the start of the position. Defaults to the current time.
Returns: A new position object.
trade(pos, size, price, timestamp)
Modifies an existing position.
Parameters:
pos : The position to be modified.
size : The size of the trade (number of shares or contracts).
price : The price at which the trade took place.
timestamp : The timestamp of the trade. Defaults to the current time.
Returns: The modified position object.
exit(pos, price, timestamp)
Closes a position by trading the entire position size at a given price and timestamp.
Parameters:
pos : The position being closed.
price : The price at which the position is being closed.
timestamp : The timestamp of the trade, defaults to the current time.
Returns: The updated position after the trade.
unrealized(pos, price)
Calculates the unrealized gain or loss for a given position and price.
Parameters:
pos : The position for which to calculate unrealized gain/loss.
price : The current market price.
Returns: The calculated unrealized gain or loss.
Trade
Represents a single trade.
Fields:
size : Size of the trade in units.
price : Price of the trade in currency.
value : Total value of the trade in currency units.
time : Timestamp of the trade.
Position
Represents a single position.
Fields:
size : Size of the position in units.
price : Average price of the position in currency.
value : Total value of the position in currency units.
start : Timestamp of the first trade that opened the position.
net : Realized gains and losses of the position in currency units.
history : Array of trades that make up the position.

Position Tools [Lot,Profit,Loss,Entry,RR,Balance][Mir Nader]This indicator is the advanced version of the position tool in Trading View. When I opened a trade in Metatrader, I had to switch between the MetaTrader and Trading View programs for the amount of profit or loss, that's why I thought of writing an indicator that shows the exact amount of profit, loss, size and other values of the open trade. It came to my mind.
Also, when you use the reply section for backtesting, this indicator helps you to use all the necessary information in each Trade to accurately calculate Trades.
To enter, it is enough to specify the three entry points, target and stop loss according to the message that is displayed to you, so that all the necessary information will be displayed for you.
Well, let's get to the main explanation about how the indicator works :
The indicator consists of two parts :
1 - the calculation table
2 - trade on the chart
Calculation table
This table shows the exact calculations of your trade live.
As you can see, this table consists of 10 sections, which I will describe each.
1 - Your trade entry point on the chart
2 - Your Stop Loss point along with the loss Pip amount
3 - Your Take Profit point along with the Profit Pip amount
4- The fourth part of the table, which is the most important part in my view, shows your current profit amount according to the risk percentage and your Broker Commission per Lot you have defined for Trade, and according to the balance, risk, Tp and Sl value, just like a Risk Management. It suggests the volume of your input based on the lot.
5 - Show the percentage change of the main market according to your trade live
6 - Display the value of Risk to Reward both according to Target Profit and live
7 - This section and the next section of the table show the amount of profit live according to the amount of the lot determined by you and without the risk of the transaction.
8 - Display the current amount of your balance according to whether the trade is in profit or loss
trade on the chart
The second part of the indicator includes the events that are being displayed on your chart
This section supports three types of display modes for buying or selling trades.
The first condition of your trade is that the price has not yet reached the entry point.
The second state is your trade that has not yet hit your target or stop
And the third state of your trade is that your target or stop has been hit.
Further Details :
I am still working on many conditions to add to the indicator and this will take more time.
For example, showing RR live on the chart after each touch has been added for buying Trade but this part is still problematic for selling Trade In the picture below, you can see that your Trade has already passed 3R profit
I have placed three labels next to each Trade for you so that you can see the values of Tp, Stop and Live without needing a table. These values will soon be visible with more options.
All calculations with precise mathematical formulas for accurate performance have been done by myself.
I will be at your service soon with more updates, I will be happy if you send me your suggestions to improve the indicator.

Cuban's Range PositioningCuban's Range Positioning is the primary backbone of Cuban's Asset Screener and a fantastic standalone market screening tool.
Range Positioning allows the trader to monitor the positioning of over 200+ Binance and Bybit Futures assets within a single window, with a standard measurement of performance, and also with custom watchlist support.
The range calculation itself uses the unique logic of Cuban's Donchian Suite, retaining highs and lows until the opposite side of the range is tagged.
When viewed historically, the Range Positioning screener allows traders to monitor any assets that are continually pushing range highs and lows, identify outliers, and track trending sectors relative to the rest of the market. This script makes this identification easier for the user by making assets that aren't approaching highs or lows, transparent.
Included within this indicator is the option to redenominate the quote asset of all assets on screen using the current chart ticker.
Within the user inputs, the user gains the ability to customize the following:
Range lookback
Asset redenomination
Location of the asset table
Percentage of assets highlighted or made transparent
Dynamic labelling offset
Over 200+ Binance and Bybit Futures assets
TO DO:
Customize number of assets on screen
Allow values beyond the initial range

Cuban's Asset ScreenerCuban's Asset Screener is a tool designed to view the health of the entire market in a single charting window, using a multi-timeframe, real-time heatmapped asset screener built natively within Tradingview.
You can use this tool to aggregate and display critical information required to identify your favorite trade ideas using other Cuban's Edge tools. Although the screener currently uses pre-built lists for over 200+ Binance and Bybit Futures pairs, the tool comes with custom watchlist support, allowing you to add as many additional assets as your screen and browser will support.
Currently tracking range positions and a custom cross asset delta function from Cuban's Pair Trading Index, the screener has an in-built sorting function which orders assets by similar market structure and colors them relative to their performance against the user's comparison asset -- their current chart ticker.
Cuban's Asset Screener is also valuable as a tool to monitor performance of your portfolio against any benchmark asset, by using the 'Asset Redenomination' option within the settings. This allows the user to redenominate the entire screener easily using their current chart ticker.
In order to setup the Asset Screener, the user will need to select an 'Asset List' and a 'Screen Location' value. This will load the screener into a set position on screen, from right to left. In order to add additional assets, multiple instances of the asset screener will need to be loaded on screen.
With this indicator, users get the option to adjust the following:
range positioning lookback
asset redenomination for range positioning
asset sorting order
screen location
multi-timeframe support
live pricing for PTI values
in-built asset lists for 200+ assets
TO DO:
add market filters to the coloring
add tradfi asset lists

Position Size ToolUpdated - Version 2
This tool is used to calculate the size of a trade.
Settings - Type in total account size and % of capital that can be risked on each trade.
The table will display:
Column 1 - Stop placement based on low, mid or high value of the current candle.
Column 2 - Percent risk on the trade.
Column 3 - Amount of shares that can be traded (calculated from account size, risk and selected stop placement).
Green color is intended for long position, stop at the low of the candle.
Red color is intended for short position, stop at the high of the candle.
Middle value can shift between either color since its measured from open to close.

Position Size Calculator (FX, Crypto, CFD)Visual display for information:
-Account capital
-Type of asset, for example forex or cfd or crypto...
-Display Contract Size
-Display the risk level in % and amount
-Show Entry, Stoploss, TakeProfit
-Display Risk Reward Ratio, Risk and Reward in Pips
-Calculating the volume of the entry position
-Display 3 red labels when the order of Stoploss - Entry - Profit is not correct to warn.
**Note:
1-This tool is only available for the following assets: Forex, USOIL, UKOIL, XAUUSD, BTCUSD, ETHUSD
2-Using with other asset pairs will cause errors due to the difference in contract size and exchange rate
3-Please close the indicator and reopen it after switching to another
Entry helperHello traders,
This is a script I use daily as a scalper and it helps me a lot, maybe it can help you, this is why I am sharing it!
PART 1 - DESCRIPTION
This program is specifically designed to help scalpers but can be used for all types of trading but won't be as useful.
This script is what I call an entry helper as it calculates dynamically the position size, stop loss and take profit levels and more.
When scalping and placing market entry orders, the price can move significantely while you are calculating your position size according to your stop loss, capital, risk and especially close price that changes very quickly, this results in a risk that is not ideally controlled and personally was a source of frustration and stress. I wanted to enter my quantity and stop loss values as fast as possible and make the process easier.
This script automates the calculation of the position size, stop loss and take profit levels according the the users input and prints the data visibly on the screen so it is easy to copy by the trader. It allows the trader to be confident that his risk is as controlled as possible.
The script is easy to use and set up, this guide will help you if you have any difficulies or questions.
PART 2 - HOW TO USE THE SCRIPT
- SET THE CAPITAL SETTINGS
1 - Set your capital value in $
- SET THE TRADE SETTINGS
2 - Set your trade side (BUY or SELL)
3 - Set you desired risk in % of your capital
- ENTRY SETTINGS
4 - Set your entry from 2 different options
|MARKET| (default option)
This option will place the entry level at the last available price
|LIMIT|
This option allows you to input a fixed price level for the entry
- STOP LOSS SETTINGS
5 - Select your stop loss placement from 4 different options
|EXTREMA STOP LOSS| (default option)
This option will place the stop loss at the highest/lowest (extrema) price level within the last N candles
|ATR EXTREMA|
This option uses the same price level as the EXTREMA STOP LOSS but will add/soustract the last ATR value (calculated on the N last candles) multiplied by a coefficient that you input
|TICKS EXTREMA|
This option uses the same price level as the EXTREMA STOP LOSS but will add/soustract a number of ticks that you input
|PRICE LEVEL|
This option allows you to input a fixed price level for the stop loss
- TAKE PROFIT SETTINGS
6 - Select your take profit from 3 different options
|NONE| (default option)
This option will not display any take profit level, I have added this option as I don't have take profit targets
|RR|
This option uses a risk to reward ratio (reward/risk) that you input, it will automatically calculate the take profit level that corresponds
|PRICE LEVEL|
This option allows you to input a fixed price level for the take profit
- QUANTITY AND FEE SETTINGS
7 - Set the quantity settings, it represents the quantity in a lot (usually 100 000 in forex, 100 in stocks 1 for crypto currencies)
8 - Set the fee per quantity (turning lot)
- VISUAL SETTINGS
9 - Show or remove the tab
- TAB SETTINGS
10 - Select the data that you want to display in the tab (the tab will adapt automatically)
NOTES:
The vertical dashed line shows what candle has been used for the calculation of the stop loss, it allows you to visualize what candle the script has selected in case of an EXTREMA stop loss option.
I hope this helps you out! Any suggestions are welcome and I hope that the guide is clear enough.
Happy trading!

Position Sizing CalculatorThis script calculates the position size base on the stop loss price, entry price, and the percent of equity willing to risk.
Formula:
(Asset Quantity) = (Amount Risk at Trade) / (Price Difference Between Entry Price and Stop Loss)
or
Position size = (% Equity at Risk) * (Equity) / (Entry Price - Stop Loss Price)
Bollinger Band strategy with split, limit, stopEntering a short position after breaking the upper Bollinger Band, entering a long position when entering after breaking the lower Bollinger Band
Provides templates for how to display position average price, stop loss, and profit price using the plot function on the chart, and how to buy splits
After entering the position, if the price crosses the mid-band line, the stop loss is adjusted to the mid-band line.

Interactive Lot/Position Calculator FTX/OKX DCA [RDM13-NOSTRA] Interactive script to calculate lot and position size when you use TradingView to trade on FTX or OKX. You can also use multi positions for DCA strategy.
After adding an indicator and making an initial interactive selection on the chart, you can modify the selection points by selecting the indicator and moving the points on the chart.
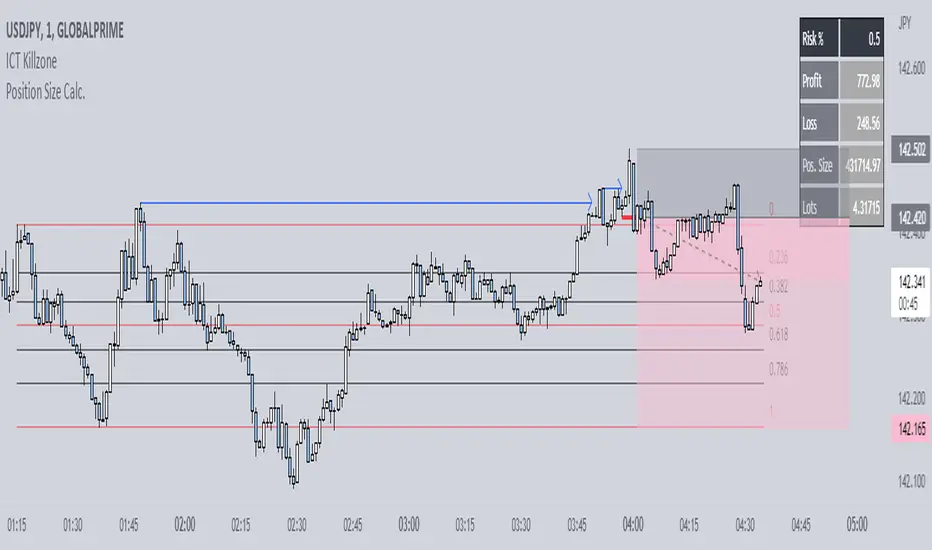
Position Size Calc. (Minimalist)This is a simplified position size calculator in the form of a table.
The reason I published this script is because all other position size calculator scripts try to provide way too much when it should be much simpler, position in strange areas of the chart and leave unwanted chart pollution.
This is a bare-bones functional table that takes your risk level, entry, stop and take profit as inputs, and calculates your loss, profit and required position size for your chosen risk level as a result.
Inspired by a table type position size calculator made by DojiEmoji design/color-wise. Functionally different however.
I hope you find this script useful and include it on your trading journey.
Regression Channel Alternative MTF█ OVERVIEW
This indicator displays 3 timeframes of parallel channel using linear regression calculation to assist manual drawing of chart patterns.
This indicator is not true Multi Timeframe (MTF) but considered as Alternative MTF which calculate 100 bars for Primary MTF, can be refer from provided line helper.
The timeframe scenarios are defined based on Position, Swing and Intraday Trader.
█ INSPIRATIONS
These timeframe scenarios are defined based on Harmonic Trading : Volume Three written by Scott M Carney.
By applying channel on each timeframe, MW or ABCD patterns can be easily identified manually.
This can also be applied on other chart patterns.
█ CREDITS
Scott M Carney, Harmonic Trading : Volume Three (Reaction vs. Reversal)
█ TIMEFRAME EXPLAINED
Higher / Distal : The (next) longer or larger comparative timeframe after primary pattern has been identified.
Primary / Clear : Timeframe that possess the clearest pattern structure.
Lower / Proximate : The (next) shorter timeframe after primary pattern has been identified.
Lowest : Check primary timeframe as main reference.
█ EXAMPLE OF USAGE / EXPLAINATION
