Quarterly Dollar Volume Table (Dark Mode Optimized) Ogdn AmesThis is a visual reporting tool that gives you a historical view of how much dollar volume a stock had each quarter. Useful for spotting seasonal volume trends or changes in trading activity.
Think of it like an accountant's spreadsheet for stock liquidity—just with better automation and no coffee stains.
Pine yardımcı programları

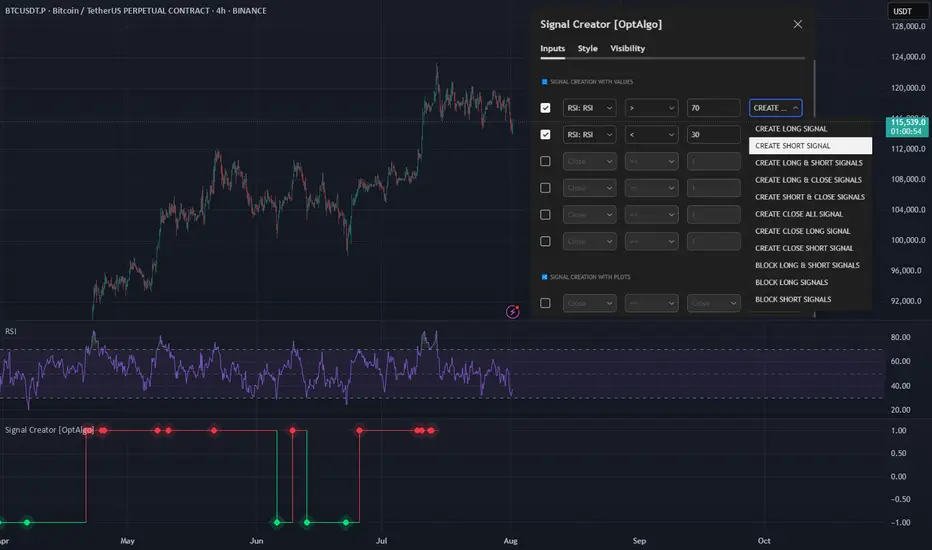
Signal Creator [OptAlgo]The Signal Creator is designed to convert complex market analysis into clear, actionable signals. Whether you're developing automated trading strategies, backtesting systems, or simply need reliable entry, exit, and block points, this tool bridges the gap between trading ideas and signal execution. It exports signal plots in an importable format compatible with backtesting strategies.
🛠 Signal Creation System:
→ Dual configuration groups: Values-based and Plot-based signal creation
→ Up to 12 customizable conditions (6 per group) for comprehensive signal logic
🛠 Comparison Operators:
→ Multiple criteria types: equal, greater/less than, crossover/crossunder
→ Shifted comparisons (↩️) for historical data analysis
→ Crossing detection for dynamic market condition identification
🛠 Signal Types:
→ LONG/SHORT entry signals with customizable triggers
→ CLOSE ALL, CLOSE LONG, CLOSE SHORT exit strategies
→ Signal blocking system to prevent unwanted entries
→ Combined signal modes (LONG & SHORT, LONG & CLOSE, SHORT & CLOSE)
🛠 Signal Count Merge Rules:
→ MIN LONG CONDITION COUNT: Number of long conditions to trigger long signal
→ MIN SHORT CONDITION COUNT: Number of short conditions to trigger short signal
→ MIN CLOSE CONDITION COUNT: Number of close conditions to trigger close all signal
→ Prevents false signals by ensuring multiple confirmations before execution
→ Customizable thresholds for each signal type (default: 1 condition each)
🛠 Smart Signal Logic:
→ Automatic conflict resolution when opposing signals occur
→ Position-aware closing (only closes relevant side)
→ Counter-based signal validation requiring all conditions to be met
→ Signal hierarchy: Block signals override entry signals, close signals override all others
🛠 Numeric Output for Backtesting:
→ Importable plot signal values: 1 (LONG), -1 (SHORT), 0 (CLOSE)
→ Compatible with backtest templates and strategy builders
→ Clean data window output for easy integration with other indicators
→ Perfect for automated trading systems and signal forwarding
🛠 Visual Output:
→ Color-coded position visualization (green=long, red=short, white=close)
→ Step-line diamond plot style for clear signal identification
→ Separate pane display for easy signal monitoring
🛠 Alarm Output:
→ Alarm for LONG -> Can be importable as plot, value is 1. (LONG == 1)
→ Alarm for SHORT -> Can be importable as plot, value is 1. (SHORT == 1)
→ Alarm for CLOSE -> Can be importable as plot, value is 1. (CLOSE == 1)
Modular Range-Trading Strategy (V9.2)# 模块化震荡行情策略 (V9.2)
# Modular Range-Trading Strategy (V9.2)
## 策略简介 | Strategy Overview
该策略基于布林带 (Bollinger Bands)、RSI、MACD、ADX 等经典指标的组合,通过多逻辑模块化结构识别震荡区间的价格反转机会,支持多空双向操作,并在相同逻辑下允许智能加仓,适用于震荡市场的回测和研究。
This strategy combines classic indicators such as Bollinger Bands, RSI, MACD, and ADX to identify price reversal opportunities within ranging markets. It features a modular multi-logic structure, allowing both long and short trades with intelligent pyramiding under the same logic. It is designed for backtesting and research in range-bound conditions.
---
## 功能特点 | Key Features
- **多逻辑结构**:支持多套震荡逻辑(动能确认均值回归、布林带极限反转等)。
- **加仓与仓位互斥**:同逻辑下可智能加仓,不同逻辑间自动互斥,避免冲突。
- **回测可调时间范围**:可自定义回测起止时间,精准评估策略表现。
- **指标可视化**:布林带、RSI、MACD 及动态 ATR 止损线实时绘图。
- **K线收盘确认信号**:通过 `barstate.isconfirmed` 控制信号,避免未收盘的虚假信号。
- **Multi-logic structure**: Supports multiple range-trading logics (e.g., momentum-based mean reversion, Bollinger Band reversals).
- **Pyramiding with mutual exclusion**: Allows intelligent pyramiding within the same logic while preventing conflicts between different logics.
- **Adjustable backtesting range**: Customizable start and end dates for accurate performance evaluation.
- **Visual indicators**: Real-time plotting of Bollinger Bands, RSI, MACD, and dynamic ATR stop lines.
- **Close-bar confirmation**: Uses `barstate.isconfirmed` to avoid false signals before bar close.
---
## 使用说明 | Usage
1. 将该脚本添加到 TradingView 图表。
2. 在参数中设置回测时间段和指标参数。
3. 仅用于学习与策略研究,请勿直接用于实盘交易。
1. Add this script to your TradingView chart.
2. Configure backtesting dates and indicator parameters as needed.
3. For educational and research purposes only. **Not for live trading.**
---
## ⚠️ 免责声明 | Disclaimer
本策略仅供学习和研究使用,不构成任何形式的投资建议。
作者不参与任何实盘交易、资金管理或收益分成,也不保证策略盈利能力。
严禁将本脚本用于任何非法集资、私募募资或与虚拟货币相关的金融违法活动。
使用本策略即表示您自行承担所有风险与法律责任。
This strategy is for educational and research purposes only and does not constitute investment advice.
The author does not participate in live trading, asset management, or profit sharing, nor guarantee profitability.
The use of this script in illegal fundraising, private placements, or cryptocurrency-related financial activities is strictly prohibited.
By using this strategy, you accept all risks and legal responsibilities.
---

Breackout V8 MomentumBreakout V6 Strategy with Fibonacci TPs
Description
Developed by Coton, this automated trading tool is designed to identify and capitalize on breakouts from consolidation zones, supported by momentum indicators. It leverages technical indicators to detect significant price movements and enters positions with take-profits based on Fibonacci levels and a trailing stop to protect profits. Optimized for crypto trading , it operates in Scalping (1m) or Intraday (5m) modes.
Indicators Used
Volatility Bands : Identify price compression and expansion zones to detect consolidations and breakouts.
Momentum Indicators : Measure the strength and direction of price movements to confirm breakouts.
Volume Indicators : Validate breakouts with significant increases in trading activity.
Dynamic Levels : Define entry and exit points based on adaptive calculations.
Features
Breakout Detection : Identifies exits from consolidation zones with quality filters.
Fibonacci Take-Profits : Profit targets calculated using extension levels to maximize gains.
Trailing Stop : Protects profits by dynamically adjusting the stop-loss based on volatility.
Visualization : Displays consolidation zones, entry levels, stop-losses, and take-profits on the chart.
Alerts : Notifications for confirmed and ongoing breakouts with a minimum risk/reward ratio.
Table : Shows the strategy status and estimated leverage in real-time.
Input Parameters
Trading Mode: Scalping (1m) or Intraday (5m) (default: Intraday)
Fibonacci Level for TP: 1.618 (adjustable 0.5-5.0)
Minimum RR for Alerts: 1.2 (filters alerts)
Alerts
Confirmed Breakout (validated movement with quality criteria).
Ongoing Breakout (tracked with minimum risk/reward ratio, every 5 candles).
Disclaimers
Not financial advice; test in demo mode.
Past performance is not indicative of future results.
High risk in crypto trading; use proper risk management (1-2% per trade).
Commission (0.1%) may impact results; adjust for your broker.
Contact
Coton for questions or improvements.

MPBA checklist indicator in TradingView is a customizable tool designed to help traders maintain discipline and follow their trading strategy by providing a visual checklist directly on their chart. It allows users to define their own criteria and mark them as confirmed or not, helping to avoid overtrading and impulsive decisions.
Yo can edit in pine editor and creat your privet checklist.

MTF EMA Pane with Diagnostics30 sec chart, 1 min EMA goes flat, I buy, 1 min EMA stays inside the group, I stay in the trade.
Not financial advice. I am working on an Algo killer, stay tuned. I am dedicating the rest of my life, as short as it my be, to beating the Men behind the Algo's. Buy me some coffee.
Send USDT thru ETH or Base to BYDFi 0x20391e32afd61dc9e1ec027651391b56ceade4e0
Join BYDFi
Referral Link: Spin for a possible $100
partner.bydfi.com
Deposit: USDT via;
ETH (ERC20) 0x20391e32afd61dc9e1ec027651391b56ceade4e0
Tron (TRC20)
TUs5u2YxtQrQfRwYK2CsMmSDGvND6Uopdj
BNB/Base (BEP20)
0x20391e32afd61dc9e1ec027651391b56ceade4e0
Solana
696LAngiQBbdk4m6k1ZBiKZrFtjTJo6dxCnVXMEePQea


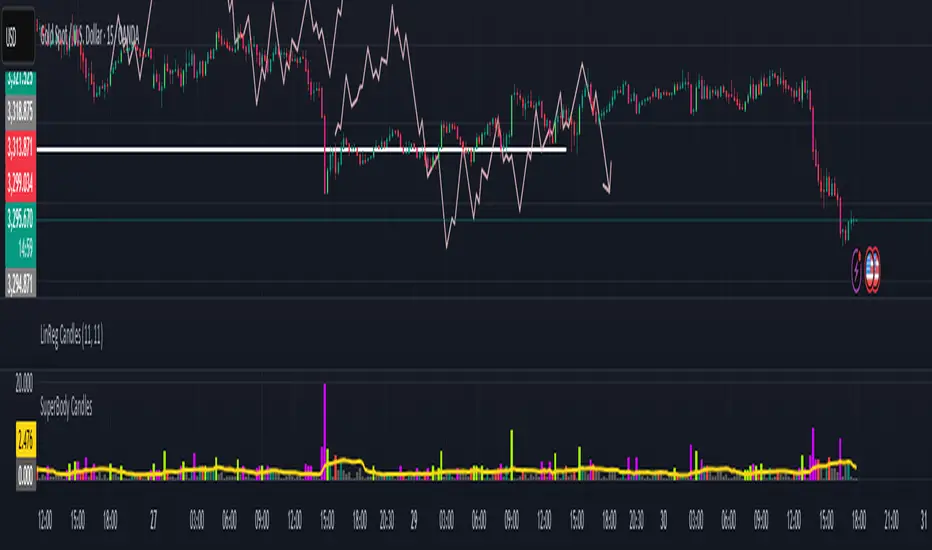
SuperBody CandlesInspired by the original script by Gautam_Dixit.
Updated to the latest Pine Script v6, now featuring fully customizable color settings so users can tailor hues to their preference.
Description:
The Momentum Candle indicator highlights bars whose real body significantly exceeds the 15-period average. 'Super' bullish and bearish candles (body ≥ 1.5× avg) receive standout colors, while above-average and below-average bars are tinted differently to reflect momentum strength.
Trading Report Generator from CSVMany people use the Trading Panel. Unfortunately, it doesn't have a Performance Report. However, TradingView has strategies, and they have a Performance Report :-D
What if we combine the first and second? It's easy!
This script is a special strategy that parses transactions in csv format from Paper Trading (and it will also work for other brokers) and “plays” them. As a result, we get a Performance Report for a specific instrument based on our real trades in Paper or another broker.
How to use it :
First, we need to get a CSV file with transactions. To do this, go to the Trading Panel and connect the desired broker. Select the History tab, then the Filled sub-tab, and configure the columns there, leaving only: Side, Qty, Fill Price, Closing Time. After that, open the Export data dialog, select History, and click Export. Open the downloaded CSV file in a regular text editor (Notepad or similar). It will contain a text like this:
Symbol,Side,Qty,Fill Price,Closing Time
FX:EURUSD,Buy,1000,1.0938700000000001,2023-04-05 14:29:23
COINBASE:ETHUSD,Sell,1,1332.05,2023-01-11 17:41:33
CME_MINI:ESH2023,Sell,1,3961.75,2023-01-11 17:30:40
CME_MINI:ESH2023,Buy,1,3956.75,2023-01-11 17:08:53
Next select all the text (Ctrl+A) and copy it to the clipboard.
Now apply the "Trading Report Generator from CSV" strategy to the chart with the desired symbol and TF, open the settings/input dialog, paste the contents of the clipboard into the single text input field of the strategy, and click Ok.
That's it.
In the Strategy Tester, we see a detailed Performance Report based on our real transactions.
P.S. The CSV file may contain transactions for different instruments, for example, you may have transactions for CRYPTO:BTCUSD and NASDAQ:AAPL. To view the report is based on CRYPTO:BTCUSD trades, simply change the symbol on the chart to CRYPTO:BTCUSD. To view the report is based on NASDAQ:AAPL trades, simply change the symbol on the chart to NASDAQ:AAPL. No changes to the strategy are required.
How it works :
At the beginning of the calculation, we parse the csv once, create trade objects (Trade) and sort them in chronological order. Next, on each bar, we check whether we have trades for the time period of the next bar. If there are, we place a limit order for each trade, with limit price == Fill Price of the trade. Here, we assume that if the trade is real, its execution price will be within the bar range, and the Pine strategy engine will execute this order at the specified limit price.

Ultimate Global Trading Hours📊 Global Markets Pro - Summary
What it does:
Shows real-time trading hours for 11 major stock markets worldwide
Displays countdown timers for when each market opens/closes
Includes Forex sessions and US extended hours (pre-market/after-hours)
Features advanced market sentiment analysis with Fear/Greed indicators
Key Features:
✅ Chronological market order (Sydney → Tokyo → London → NYSE, etc.)
✅ Customisable times for each market in HH:MM format
✅ Multi-factor sentiment (VIX, Bonds vs Stocks, Weekly trends, Volume)
✅ Clean interface with emoji indicators and colour coding
✅ Your timezone display with GMT+/- options
Perfect for:
Day traders tracking global market sessions
Swing traders gauging market sentiment
Anyone wanting to know when major markets are active
Result: One comprehensive dashboard showing when to trade and market mood across all time zones!

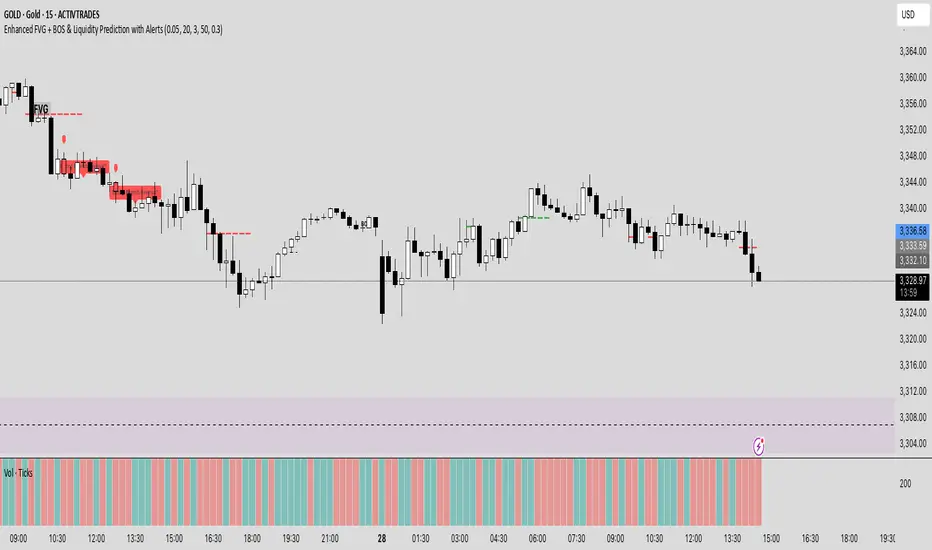
Enhanced FVG + BOS & Liquidity Prediction with Alerts### How to use:
1. Add this script to TradingView.
2. Go to the **Alerts** tab.
3. Create new alerts:
- Choose **"Enhanced FVG + BOS & Liquidity Prediction with Alerts"**.
- Select **"Bullish Reversal Alert"** or **"Bearish Reversal Alert"**.
- Set the trigger to **"Once"** or **"Every time"** based on your preference.
### Summary:
- The alerts fire when the combined signals (BOS, Liquidity Sweep, trend, candlestick pattern) strongly suggest a reversal.
- The **labels** and **shapes** give visual confirmation on your chart.
All Candlestick-Patterns - by FibonacciFuel
Overview
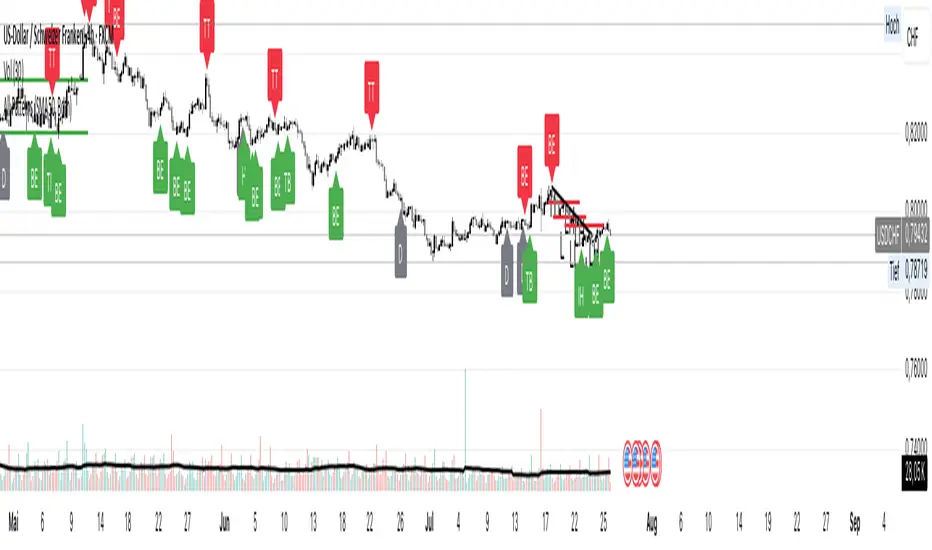
The indicator "All Candlestick-Patterns - by FibonacciFuel" is a comprehensive tool for traders and analysts, originally designed in German, that recognizes and visualizes a wide variety of candlestick patterns on a chart. Developed with Pine Script™, this indicator provides a detailed analysis of bullish, bearish, and neutral candlestick patterns, commonly used in technical analysis to identify potential reversal or continuation signals. It is particularly useful for both novice and experienced traders looking to enhance their market assessment through visual pattern recognition.
Functionality
The indicator continuously monitors the price action and detects over 30 different candlestick patterns, including classic patterns like "Doji," "Hammer," "Engulfing," and more complex formations such as "Morning Star" or "Falling Three Methods." Each detection is marked with a label on the chart indicating the pattern type (e.g., "H" for Hammer or "ES" for Evening Star). Additionally, detailed tooltips are provided, which appear when hovering over a label, offering a description of the pattern in German, including its significance and interpretation.
Detection Logic
Trend Detection: The indicator can configure trend detection based on the 50-day SMA (Simple Moving Average), a combination of 50-day and 200-day SMA, or no trend detection.
Criteria: Each pattern is identified using specific criteria such as candlestick body size, shadow length, and position relative to the previous price action.
Customizability: Users can choose to display only bullish, only bearish, or both types of patterns, as well as enable or disable individual patterns.
Visual Representation
Labels: Each detected pattern is marked with a short code (e.g., "TB" for Tweezer Bottom), placed above or below the candlestick depending on its bullish or bearish nature.
Color Coding: Bullish patterns are displayed in blue, bearish in red, and neutral patterns in gray, enabling quick visual differentiation.
Tooltips: Hovering over a label triggers a tooltip with a detailed German description, explaining the context and potential market implication.
Supported Candlestick Patterns
The indicator covers a broad range of patterns, including:
- **Bullish**: Hammer, Inverted Hammer, Morning Star, Piercing, Rising Three Methods, Tweezer Bottom, among others.
- **Bearish**: Hanging Man, Shooting Star, Evening Star, Dark Cloud Cover, Falling Three Methods, Tweezer Top, among others.
- **Neutral**: Doji, Spinning Top, Harami Cross, among others.
Configuration
Trend Rule: Choose between "SMA50," "SMA50, SMA200," or "No detection" to define the trend basis.
Pattern Activation: Enable or disable individual patterns (e.g., Abandoned Baby, Engulfing) via input fields.
Display Options: Select between "Bullish," "Bearish," or "Both" to limit the pattern display.
Colors: Customize the label colors for bullish, bearish, and neutral patterns.
Application
Installation: Add the indicator to your chart.
Customization: Adjust settings to your preferences, such as the trend rule or desired patterns.
Analysis: Use the labels and tooltips to identify potential trading signals. For example, a "Hammer" in a downtrend might indicate a reversal.
Confirmation: Combine the patterns with other indicators (e.g., RSI, MACD) for a well-informed decision.
Advantages
Comprehensiveness: Detects a wide variety of patterns covering the full spectrum of candlestick analysis.
User-Friendliness: Intuitive labels and detailed tooltips simplify interpretation.
Flexibility: Customizable settings allow for tailored usage.
Conclusion
"All Candlestick-Patterns - by FibonacciFuel" is a powerful tool for traders aiming to master the art of candlestick pattern analysis. With its ability to recognize and visually represent a broad range of patterns, it provides valuable support for trading decisions. Whether you are a beginner learning the basics or an experienced trader refining strategies, this indicator is an indispensable asset in your toolkit.
Developed by FibonacciFuel, this indicator is released under the Mozilla Public License 2.0 and is freely usable. Feedback or improvement suggestions are welcome!
# All Candlestick-Patterns - by FibonacciFuel
## Overview
The indicator "All Candlestick-Patterns - by FibonacciFuel" is a comprehensive tool for traders and analysts, originally designed in German, that recognizes and visualizes a wide variety of candlestick patterns on a chart. Developed with Pine Script™, this indicator provides a detailed analysis of bullish, bearish, and neutral candlestick patterns, commonly used in technical analysis to identify potential reversal or continuation signals. It is particularly useful for both novice and experienced traders looking to enhance their market assessment through visual pattern recognition.
## Functionality
The indicator continuously monitors the price action and detects over 30 different candlestick patterns, including classic patterns like "Doji," "Hammer," "Engulfing," and more complex formations such as "Morning Star" or "Falling Three Methods." Each detection is marked with a label on the chart indicating the pattern type (e.g., "H" for Hammer or "ES" for Evening Star). Additionally, detailed tooltips are provided, which appear when hovering over a label, offering a description of the pattern in German, including its significance and interpretation.
## Detection Logic
- **Trend Detection**: The indicator can configure trend detection based on the 50-day SMA (Simple Moving Average), a combination of 50-day and 200-day SMA, or no trend detection.
- **Criteria**: Each pattern is identified using specific criteria such as candlestick body size, shadow length, and position relative to the previous price action.
- **Customizability**: Users can choose to display only bullish, only bearish, or both types of patterns, as well as enable or disable individual patterns.
## Visual Representation
- **Labels**: Each detected pattern is marked with a short code (e.g., "TB" for Tweezer Bottom), placed above or below the candlestick depending on its bullish or bearish nature.
- **Color Coding**: Bullish patterns are displayed in blue, bearish in red, and neutral patterns in gray, enabling quick visual differentiation.
- **Tooltips**: Hovering over a label triggers a tooltip with a detailed German description, explaining the context and potential market implication.
## Supported Candlestick Patterns
The indicator covers a broad range of patterns, including:
- **Bullish**: Hammer, Inverted Hammer, Morning Star, Piercing, Rising Three Methods, Tweezer Bottom, among others.
- **Bearish**: Hanging Man, Shooting Star, Evening Star, Dark Cloud Cover, Falling Three Methods, Tweezer Top, among others.
- **Neutral**: Doji, Spinning Top, Harami Cross, among others.
## Configuration
- **Trend Rule**: Choose between "SMA50," "SMA50, SMA200," or "No detection" to define the trend basis.
- **Pattern Activation**: Enable or disable individual patterns (e.g., Abandoned Baby, Engulfing) via input fields.
- **Display Options**: Select between "Bullish," "Bearish," or "Both" to limit the pattern display.
- **Colors**: Customize the label colors for bullish, bearish, and neutral patterns.
## Application
1. **Installation**: Add the indicator to your chart.
2. **Customization**: Adjust settings to your preferences, such as the trend rule or desired patterns.
3. **Analysis**: Use the labels and tooltips to identify potential trading signals. For example, a "Hammer" in a downtrend might indicate a reversal.
4. **Confirmation**: Combine the patterns with other indicators (e.g., RSI, MACD) for a well-informed decision.
## Advantages
- **Comprehensiveness**: Detects a wide variety of patterns covering the full spectrum of candlestick analysis.
- **User-Friendliness**: Intuitive labels and detailed tooltips simplify interpretation.
- **Flexibility**: Customizable settings allow for tailored usage.
## Conclusion
"All Candlestick-Patterns - by FibonacciFuel" is a powerful tool for traders aiming to master the art of candlestick pattern analysis. With its ability to recognize and visually represent a broad range of patterns, it provides valuable support for trading decisions. Whether you are a beginner learning the basics or an experienced trader refining strategies, this indicator is an indispensable asset in your toolkit.
Developed by FibonacciFuel, this indicator is released under the Mozilla Public License 2.0 and is freely usable. Feedback or improvement suggestions are welcome!
6FG Trading Plan Checklist & Setups6FG Trading Plan Checklist & Setups
Trend context (4H & H1)
Candle confirmations on 15M (bull/bear engulfing & pin bar)
Your two A+ setups:
• H1 Break of Structure (BxOxS)
• Trap Break (with last LH/HL break logic)
Alerts for both setups

Sessions with timeframe filter🕒 Smart Timeframe Filtering
This session indicator includes an automatic filter that disables all session boxes when the chart timeframe is greater than the user-defined input. This helps keep higher-timeframe charts clean and focused by hiding intraday sessions when they’re no longer relevant — especially helpful for multi-timeframe traders.
🔍 Features:
📦 Draws up to 3 customizable session boxes with dynamic high/low tracking.
⏱️ Auto-disables on higher timeframes (Smart Timeframe Filter).
🌍 Fully customizable session times, box colors, and time zone (GMT-based).
⚡ Optimized for performance using lightweight, non-overlapping box logic.
👨🍳 UI is organized like a chef’s kitchen: clean, intuitive, and easy to navigate. Settings are grouped and filtered to avoid clutter.
✅ Best Use:
This indicator is most useful for intraday traders on 1m–15m charts.
It’s designed to keep your workspace clean on 30m+ charts or whatever threshold you define.

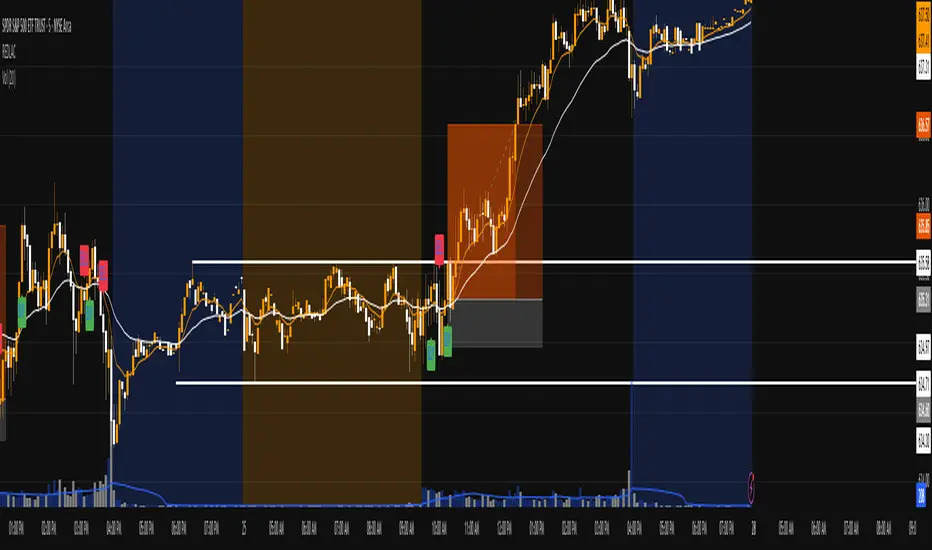
ORB Range Indicator with Fibonacci Targets
This script plots the Opening Range (ORB) high and low based on a configurable time window (5–45 minutes from the U.S. session open at 9:30 AM EST).
Once the ORB window closes, the indicator draws horizontal lines marking:
ORB High and Low
The size of the range in price and %
Fibonacci-based price targets above and below the range (0.382, 0.618, 1.000, 1.618, 2.000)
You can control:
Which Fibonacci levels to display
Whether to show long targets, short targets, or both
All drawings are automatically cleared at the start of each trading day.
Ideal for breakout traders using ORB and Fibonacci extensions for target planning.

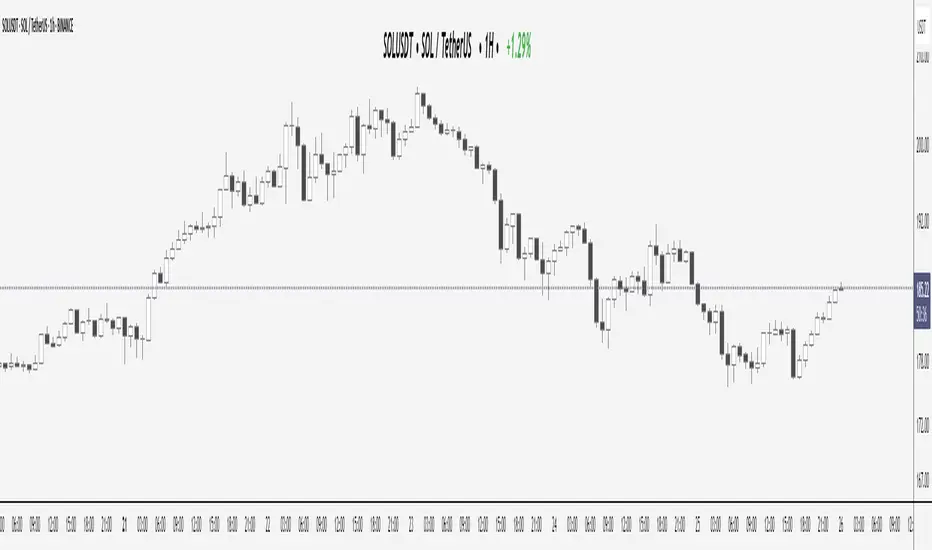
Elite Display# 😎 Elite Display - Simple Chart Info with Style
**Never lose track of what you're looking at!**
A clean, fun way to display your asset name, timeframe, and daily performance directly on your chart. Created by ** ** for traders who like their charts both informative and stylish.
## 📊 **What it shows:**
- Asset name (BTCUSDT) or description (Bitcoin/TetherUS)
- Current timeframe (1H, 4H, 1D, etc.)
- Daily % change with green/red colors
**Example:** `BTCUSDT | 1H | +2.45%`
## 🎨 **Make it yours:**
- **60+ separator styles** - From classic `|` to fun emojis 🚀💎⚡
- **Mood mode** - Separators react to your performance (😄 for gains, 😢 for losses)
- **Position anywhere** - 9 spots on your chart
- **Custom styling** - Colors, fonts, sizes, bold/italic
## 🎯 **Perfect for:**
- Multi-timeframe analysis (never forget which TF you're on!)
- Taking clean screenshots for social media
- Avoiding "wait, what symbol is this?" moments
- Adding a bit of personality to your workspace
## ⚙️ **Super simple setup:**
1. Add to chart
2. Pick what to show (asset/timeframe/both)
3. Choose your style (classic, fun, or reactive mood)
4. Position it wherever you want
5. Done!
**It's just chart info... but way more fun!** 😊
*Works on all markets: Stocks, Crypto, Forex, Commodities*# 📊 TradingHUD - Your Smart Chart Companion
**Transform your charts with the ultimate context display!** Never lose track of your symbol, timeframe, and performance again. This highly customizable indicator brings personality and clarity to your trading workspace.
## 🚀 **Key Features:**
✅ **5 Display Modes:**
- Asset Name (ticker only)
- Full Description (complete name)
- Both combined
- Timeframe Only
- Daily Variation Only
✅ **60+ Separator Styles in 3 Categories:**
- 🎨 **Classic** (15): Professional symbols (|, •, →, ★, etc.)
- 🎉 **Fun** (20): Colorful objects (🚀, 💎, ⚡, 🎯, 💰, etc.)
- 🎭 **Mood** (40+): Reactive yellow faces!
- 😄 **Happy** (21): 😀😊🥰😎🥳 (for green gains)
- 😢 **Sad** (23): 😢😭🥺😞😩 (for red losses)
✅ **Intelligent Variation Display:**
- Daily % change with smart color coding
- Green/red performance tracking
- Only appears on relevant timeframes (intraday + daily)
- Automatically hidden on weekly/monthly
✅ **Ultimate Customization:**
- 9 positioning options anywhere on chart
- Font families: Default or Monospace
- Bold/italic text formatting
- Custom colors and sizes
- Flexible element ordering
## 🎭 **Mood Mode Magic:**
Watch your separators celebrate wins with 😄🤑🚀 or empathize with losses using 😢😭💸. Toggle this emotional feature on/off anytime!
## 💡 **Perfect For:**
- Multi-timeframe analysis
- Screenshot documentation with context
- Avoiding symbol confusion
- Real-time performance tracking
- Adding personality to professional charts
- Social media trading posts
## ⚙️ **Quick Setup:**
1. Add TradingHUD to your chart
2. Select display mode (Asset/Description/Both/etc.)
3. Choose separator style (Classic/Fun/Mood)
4. Position anywhere you want
5. Customize colors, fonts, and formatting
6. Trade with confidence and style!
## 🎯 **Live Examples:**
- **Classic**: `BTCUSDT | 1H | +2.45%`
- **Fun**: `AAPL 🚀 4H 🚀 -1.23%`
- **Happy Mood**: `Gold 😄 1D 😄 +3.67%`
- **Sad Mood**: `BTC 😢 15min 😢 -5.12%`
**Professional meets personality. Context meets creativity. This is TradingHUD.** 📈✨
*Compatible with all markets: Stocks, Crypto, Forex, Commodities, Indices*
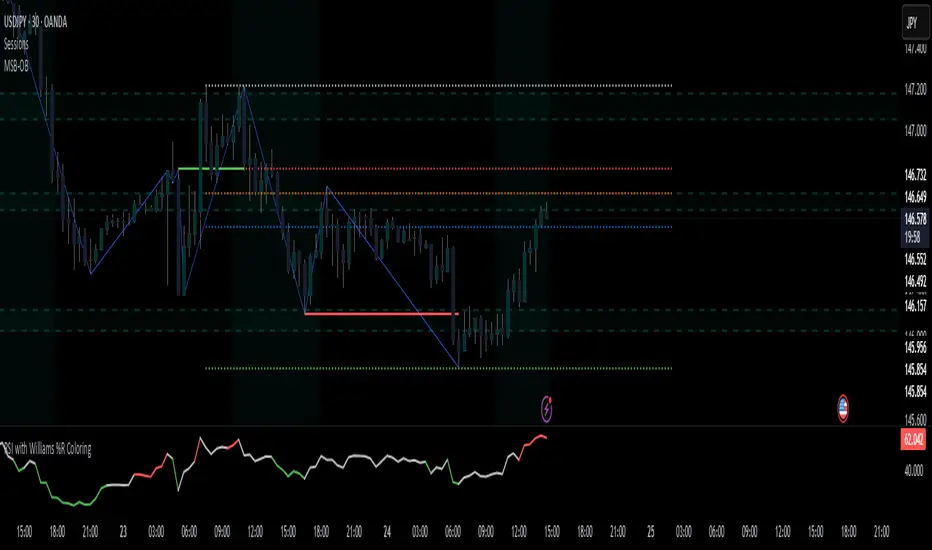
RSI with Williams %R Coloringsimple fusion of RSI to seek divergence and williams % R coloring to see overbought/oversold price.
not my own work, just merely took two standard indicators and infused them.
BookYourTradeHappy trade,
This is a semi-automated tool that allows you to define a trade setup in advance, including multiple exit levels. It incorporates a proven method for managing risk and reward. You specify a fixed entry price, an initial stop loss, two take profit levels, and a trailing stop loss for the remaining position—aiming to maximize gains from the trend. Alerts are included so you can step away from the screen and still be notified when any predefined price level is reached. The tool sends trade orders as market orders to your exchange or broker via webhooks. You provide the general webhook format, and the script automatically fills in the correct values.
How to Use
This tool is intended for manual day traders.
Define Entry Conditions:
Set your planned entry price and, optionally, a start and end time for trade activation. The script will not run unless the price reaches your specified level during this time window.
Set Stop Loss:
Define the stop loss as a fixed number of points from the entry price (above or below). This also determines whether the trade is long or short.
Configure Take Profits:
Specify the risk-reward ratio and position size for Take Profit 1.
Do the same for Take Profit 2.
Trailing Stop Loss:
For the remaining position after Take Profit 2, set a trailing stop loss. This is also defined in points, relative to the previous bar's closing price.
Time and Session Filters:
Set the earliest date to begin trading and the latest date by which all positions should be closed.
Optionally, define specific time windows (daily and or weekly) during which trading should be disabled. These off-times will be visually grayed out.
Define Capital and Fees:
Input the dollar amount you want to invest, along with any applicable percentage-based fees or fixed fees per trade. This is useful since different brokers, exchanges, or webhook service providers may charge in different ways (fixed, percentage, or both).
Configure Webhooks:
Enter your broker- or exchange-specific webhook for each trade event: entry, Take Profit 1, Take Profit 2, Stop Loss, and trailing exit. You’ll need to include placeholder strings in the webhook that the script will replace with actual trade values. The script provides a helper table to display these placeholders directly on the chart.
Some values you can deliver to the webhook service provider as an $ value or a deviation in percentage. For example the quantity of a trade or the take profit price. choose the correct replacement accordingly.
The script sends all orders as market orders.
Multiple Instances:
If you want to run multiple instances of this script, you must assign a unique name to each one. This ensures that the webhook service provider can correctly route trade signals to the appropriate bot.
Here is an evolution of one trade in images:
The trade setting are defined but the trade has not started
The trade has started
The price reached the first take profit level and a part of the investment was liquidated.
The trade reached it's end date and the remaining investment was liquidated.
cheers

Apex Edge - RSI Trend LinesThe Apex Edge - RSI Trend Lines indicator is a precision tool that automatically draws real-time trendlines on the RSI oscillator using confirmed pivot highs and lows. These dynamic trendlines track RSI structure in motion, helping you anticipate breakout zones, reversals, and hidden divergences.
Every time a new pivot forms, the indicator automatically re-draws the RSI trendline between the two most recent pivots — giving you an always-current view of momentum structure. You’ll instantly see when RSI begins compressing or expanding, long before price reacts.
Key Features: • Dynamic RSI trendlines drawn from the last 2 pivots
• Auto re-draws in real-time as new pivots form
• Optional "Full Extend" or "Pivot Only" modes
• Slope color-coded: green = support, red = resistance
• Built-in dotted RSI levels (30/70 default)
• Alert conditions for RSI trendline breakout signals
• Ideal for spotting divergence, compression, and early SMC confluence
This is not your average RSI — it’s a fully reactive momentum edge overlay designed to give you clarity, structure, and timing from within the oscillator itself. Perfect for traders using Smart Money Concepts, divergence setups, or algorithmic trend tracking.
⚔️ Built for precision. Built for edge. Built for Apex.

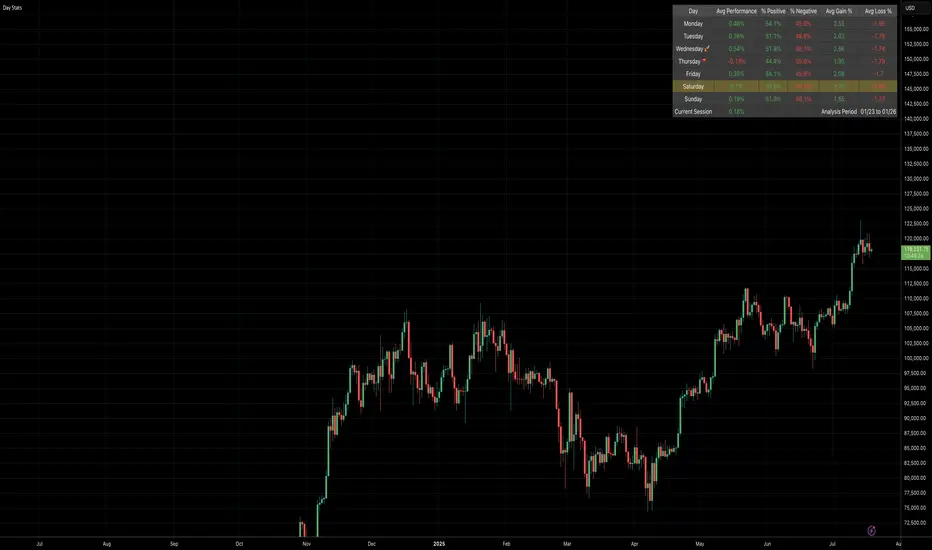
Daily Gain/Loss Statistics by Day of WeekDaily Gain/Loss Statistics by Day of Week
Overview
This Pine Script indicator analyzes historical price data to provide comprehensive day-of-week performance statistics, helping traders identify patterns and optimize their trading strategies based on which days historically perform better or worse.
Key Features
📊 Day-of-Week Analysis
7-day breakdown showing Monday through Sunday statistics
Average Gain % - Average percentage gains on winning days for each day of the week
Average Loss % - Average percentage losses on losing days (displayed with minus sign)
Median High % - Typical percentage move from open to daily high
Median Low % - Typical percentage move from open to daily low
🎯 Visual Performance Indicators
🚀 Rocket symbol - Marks the best performing day (highest average gains)
🔻 Red triangle down - Marks the worst performing day (lowest average gains)
Current day highlighting - Today's row highlighted in yellow (#ffdd444b)
⚡ Real-Time Session Tracking
Current Session row - Shows today's performance percentage in real-time
Color-coded gains/losses - Green for positive, red for negative
🎨 Professional Themes
⚙️ Customization Options
Date range selection - Choose specific time periods for analysis
Table positioning - 9 different screen positions
Table sizing - 6 size options from tiny to huge
Timeframe protection - Works only on 1D timeframe with user-friendly warnings
How It Works
Data Collection - Analyzes daily OHLC data within your selected date range
Day Classification - Categorizes each trading day by day of the week
Statistical Calculation - Computes averages and medians for each day type
Performance Ranking - Identifies best and worst performing days
Real-Time Display - Shows current session performance vs historical patterns
Trading Applications
Entry/Exit Timing - Identify optimal days for opening/closing positions
Risk Management - Avoid trading on historically poor-performing days
Strategy Optimization - Align trading strategies with day-of-week patterns
Market Timing - Understand weekly market cycles and seasonality
This indicator transforms raw price data into actionable intelligence, helping traders make more informed decisions based on proven historical day-of-week performance patterns.
UniversalPositionCalculatorV5🚀 Universal Position Calculator v5 (with Margin-Check) 🚀
Stop using calculators and complicated Excel sheets! 🤯 With the Universal Position Calculator v5, you have the ultimate tool right on your TradingView chart to manage your position size perfectly. Whether it's Forex, Gold, or Indices – this indicator does all the work for you!
✨ What does this indicator do? ✨
This indicator is your personal risk manager. It calculates the exact lot size for your next trade based on your capital, your desired risk, and your leverage. The best part? It immediately checks if your trade is even possible with your margin and warns you if you're about to over-leverage your account! 🚦
🌟 Key Features at a Glance 🌟
Automatic Lot Calculation: Just enter your risk in percent, and the indicator calculates the perfect lot size.
Margin Check: Instantly detects if your desired position size is limited by your margin and adjusts it. No more margin calls due to oversized positions!
For All Asset Classes: Works perfectly for Forex pairs (e.g., EURUSD) and other assets like commodities (XAUUSD) or indices (GER30). 💹
Currency Conversion: Automatically converts between your account currency and the asset's currency. It doesn't matter if you trade in EUR, USD, CHF, or JPY. 💱
Interactive Lines: Simply drag and drop the Entry and Stop Loss lines directly on the chart to plan your trade. 🎯
Clear Info Panel: All important information (lot size, required margin, risk in €/$/...) is displayed cleanly and clearly on your chart.
🛠️ How to Use: It's This Easy! 🛠️
The setup is a piece of cake and done in two simple steps.
Step 1: Configure Your Setup
Go to the indicator settings and fill out the "1. Setup" section:
Asset Type: Choose Forex for currency pairs or Other for everything else (e.g., Gold, Oil, Indices).
Account Currency: Enter the currency of your trading account (e.g., USD).
Account Capital: Enter your current account capital.
Risk in % per Trade: How much of your capital do you want to risk per trade? (e.g., 1.0 for 1%).
Leverage: Enter your account's leverage (e.g., 30 for 30:1).
Contract Size for 'Other': IMPORTANT! Only for the Other type. For Gold (XAUUSD), this is often 100; for the DAX (GER30), it's often 1 or 25. Check your broker's specifications for this!
Step 2: Plan Your Trade
Now for the fun part in the "2. Trade Control" section:
Entry Line (Blue Line): Click on the blue line and drag it to your desired entry level. You can also enter the value manually in the settings.
Stop Loss Line (Red Line): Click on the red line and drag it to your stop-loss level.
Step 3: Read the Results
As soon as you've set your Entry and Stop Loss, the Info Panel in the top-right corner will instantly show you the results:
Correct Lot Size: This is the lot size you need to enter with your broker for this trade.
⚠️ Heads up: If it says "Lot Size (Margin Limited!)" in orange, it means your desired risk was too high for your leverage. The indicator has automatically reduced the lot size to the maximum possible to avoid a margin call.
Required Margin: This is how much capital will be blocked on your account as a security deposit (margin) for this trade.
Risk in : The exact amount of money you will lose if your stop loss is triggered.
With this tool, you can make disciplined and mathematically sound trading decisions. Good luck and Happy Trading! 📈💰
