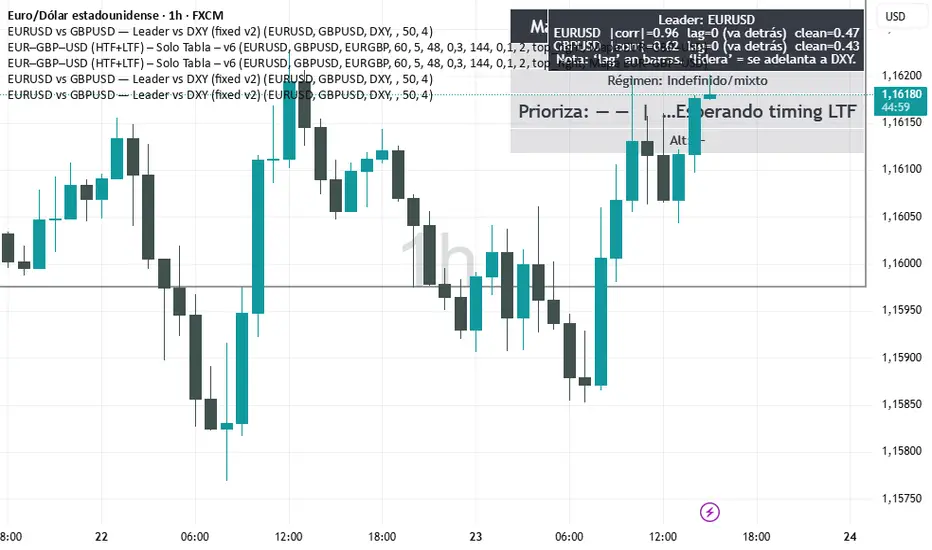
EURUSD vs GBPUSD — Alexio Script que muestra que par es más fuerte entre GBP y EUR vs USD en un rango determinado.
Pine yardımcı programları
Name of tickerDescription:
This indicator displays the instrument’s ticker symbol and the current chart timeframe at the top center of the chart.
Features:
• Shows the ticker (e.g., BTCUSDT, AAPL, etc.).
• Displays the current timeframe (1m, 5m, 1H, 1D, etc.).
• Positioned at the top center of the chart for easy reference.
• Transparent background for minimal interference with price action.
• Lightweight and simple, no extra settings required.
Usage:
• Works with any instrument: stocks, crypto, futures.
• Useful for traders who want to always see the ticker and timeframe while analyzing the chart.
Settings:
• Text size can be adjusted in the script (text_size).
• Text and background colors can be customized (text_color, bgcolor).

Multi-Entry Position SizerMulti-Entry Position Sizer (with Risk, Margin & Tables)
This tool is designed for traders who manage multiple staggered entries (scaling in) with fixed risk allocation. It calculates position sizes, margin requirements, and liquidation levels for up to 5 custom entry points, based on a defined stop loss and wallet risk.
🔧 Features
Entry Management
Supports up to 5 entries.
Use 0 to ignore an entry, -1 to auto-use current price.
Valid entries are drawn as colored dashed lines.
Invalid entries (e.g., entry on wrong side of stop loss) are flagged with red dotted lines and labels.
Risk Control
Risk defined in Direct USDT or % of wallet size.
Risk automatically split across all valid entries.
Per-entry quantity and margin calculated dynamically.
Visualization
Stop loss line in red.
Liquidation levels drawn as faded dotted lines.
Entry labels show price and required margin in USDT.
Summary table (top-right) with symbol, side, risk, SL, leverage.
Entries table (bottom-right) listing each valid entry with:
Price
Quantity
Margin in USDT
Risk/entry in USDT
Liquidation level
Alerts
Alerts trigger when price touches a valid entry.
Separate alert for stop loss hit.
📊 How to Use
Select Side (Long or Short).
Enter your Wallet Size, Risk Parameters, and Leverage.
Define your Stop Loss Price.
Configure up to 5 Entry Points.
0 = disabled
-1 = current market price
Any positive value = custom entry price
Watch tables and chart update automatically:
Invalid entries turn red (ignored in sizing).
Valid entries show correct margin and liquidation prices.
✅ Who Is It For?
Traders who scale in with multiple orders.
Traders who want precise risk per trade.
Anyone who needs to see margin requirements and liquidation prices before placing orders.
⚠️ Disclaimer:
This script is for educational purposes. It does not place orders automatically and should not be considered financial advice. Always double-check calculations with your exchange before trading.

Major Trading Sessions IndicatorsThis indicator displays vertical lines on your chart to mark the opening times of the major global trading sessions (Tokyo, Shanghai/HK, London, and New York). As a crypto trader I want to find price action patterns after sessions open.
It's fully customizable and extendable (you could add closing time for sessions as well)
Works best on short timeframes.
Features:
6 configurable vertical lines (4 preset for major sessions + 2 custom)
Each line shows a customizable label (e.g., "Tokyo", "London")
Individual time and color settings for each line
UTC offset for each line to handle Daylight Saving Time
Option to fix all labels at a specific price level for cleaner appearance (need to set and save it for each chart, it becomes a mess if you don't). Default behavior and limit of Pine Script is that it will be attached to the price wick.
Default Sessions:
Tokyo: 00:00 UTC (midnight)
Shanghai/HK: 01:30 UTC
London: 08:00 UTC (winter) - adjust offset to +1 for summer
New York: 13:00 UTC (winter) - adjust offset to -4 for summer
DST Adjustments:
Simply change the UTC offset when daylight saving time begins/ends:
London: 0 (winter) or +1 (summer)
New York: -5 (winter) or -4 (summer)
Lines extend from top to bottom of the chart and appear precisely when each session opens.
My preferred configuration: shorten names and reduce opacity of colors to 20-30%.

Realtime RenkoI've been working on real-time renko for a while as a coding challenge. The interesting problem here is building renko bricks that form based on incoming tick data rather than waiting for bar closes. Every tick that comes through gets processed immediately, and when price moves enough to complete a brick, that brick closes and a new one opens right then. It's just neat because you can run it and it updates as you'd expect with renko, forming bricks based purely on price movement happening in real time rather than waiting for arbitrary time intervals to pass.
The three brick sizing methods give you flexibility in how you define "enough movement" to form a new brick. Traditional renko uses a fixed price range, so if you set it to 10 ticks, every brick represents exactly 10 ticks of movement. This works well for instruments with stable tick sizes and predictable volatility. ATR-based sizing calculates the average true range once at startup using a weighted average across all historical bars, then divides that by your brick value input. If you want bricks that are one full ATR in size, you'd use a brick value of 1. If you want half-ATR bricks, use 2. This inverted relationship exists because the calculation is ATR divided by your input, which lets you work with multiples and fractions intuitively. Percentage-based sizing makes each brick a fixed percentage move from the previous brick's close, which automatically scales with price level and works well for instruments that move proportionally rather than in absolute tick increments.
The best part about this implementation is how it uses varip for state management. When you first load the indicator, there's no history at all. Everything starts fresh from the moment you add it to your chart because varip variables only exist in real-time. This means you're watching actual renko bricks form from real tick data as it arrives. The indicator builds its own internal history as it runs, storing up to 250 completed bricks in memory, but that history only exists for the current session. Refresh the page or reload the indicator and it starts over from scratch.
The visual implementation uses boxes for brick bodies and lines for wicks, drawn at offset bar indices to create the appearance of a continuous renko chart in the indicator pane. Each brick occupies two bar index positions horizontally, which spaces them out and makes the chart readable. The current brick updates in real time as new ticks arrive, with its high, low, and close values adjusting continuously until it reaches the threshold to close and become finalized. Once a brick closes, it gets pushed into the history array and a new brick opens at the closing level of the previous one.
What makes this especially useful for debugging and analysis are the hover tooltips on each brick. Clicking on any brick brings up information showing when it opened with millisecond precision, how long it took to form from open to close, its internal bar index within the renko sequence, and the brick size being used. That time delta measurement is particularly valuable because it reveals the pace of price movement. A brick that forms in five seconds indicates very different market conditions than one that takes three minutes, even though both bricks represent the same amount of price movement. You can spot acceleration and deceleration in trend development by watching how quickly consecutive bricks form.
The pine logs that generate when bricks close serve as breadcrumbs back to the main chart. Every time a brick finalizes, the indicator writes a log entry with the same information shown in the tooltip. You can click that log entry and TradingView jumps your main chart to the exact timestamp when that brick closed. This lets you correlate renko brick formation with what was happening on the time-based chart, which is critical for understanding context. A brick that closed during a major news announcement or at a key support level tells a different story than one that closed during quiet drift, and the logs make it trivial to investigate those situations.
The internal bar indexing system maintains a separate count from the chart's bar_index, giving each renko brick its own sequential number starting from when the indicator begins running. This makes it easy to reference specific bricks in your analysis or when discussing patterns with others. The internal index increments only when a brick closes, so it's a pure measure of how many bricks have formed regardless of how much chart time has passed. You can match these indices between the visual bricks and the log entries, which helps when you're trying to track down the details of a specific brick that caught your attention.
Brick overshoot handling ensures that when price blows through the threshold level instead of just barely touching it, the brick closes at the threshold and the excess movement carries over to the next brick. This prevents gaps in the renko sequence and maintains the integrity of the brick sizing. If price shoots up through your bullish threshold and keeps going, the current brick closes at exactly the threshold level and the new brick opens there with the overshoot already baked into its initial high. Without this logic, you'd get renko bricks with irregular sizes whenever price moved aggressively, which would undermine the whole point of using fixed-range bricks.
The timezone setting lets you adjust timestamps to your local time or whatever reference you prefer, which matters when you're analyzing logs or comparing brick formation times across different sessions. The time delta formatter converts raw milliseconds into human-readable strings showing days, hours, minutes, and seconds with fractional precision. This makes it immediately clear whether a brick took 12.3 seconds or 2 minutes and 15 seconds to form, without having to parse millisecond values mentally.
This is the script version that will eventually be integrated into my real-time candles library. The library version had an issue with tooltips not displaying correctly, which this implementation fixes by using a different approach to label creation and positioning. Running it as a standalone indicator also gives you more control over the visual settings and makes it easier to experiment with different brick sizing methods without affecting other tools that might be using the library version.
What this really demonstrates is that real-time indicators in Pine Script require thinking about state management and tick processing differently than historical indicators. Most indicator code assumes bars are immutable once closed, so you can reference `close ` and know that value will never change. Real-time renko throws that assumption out because the current brick is constantly mutating with every tick until it closes. Using varip for state variables and carefully tracking what belongs to finalized bricks versus the developing brick makes it possible to maintain consistency while still updating smoothly in real-time. The fact that there's no historical reconstruction and everything starts fresh when you load it is actually a feature, not a limitation, because you're seeing genuine real-time brick formation rather than some approximation of what might have happened in the past.

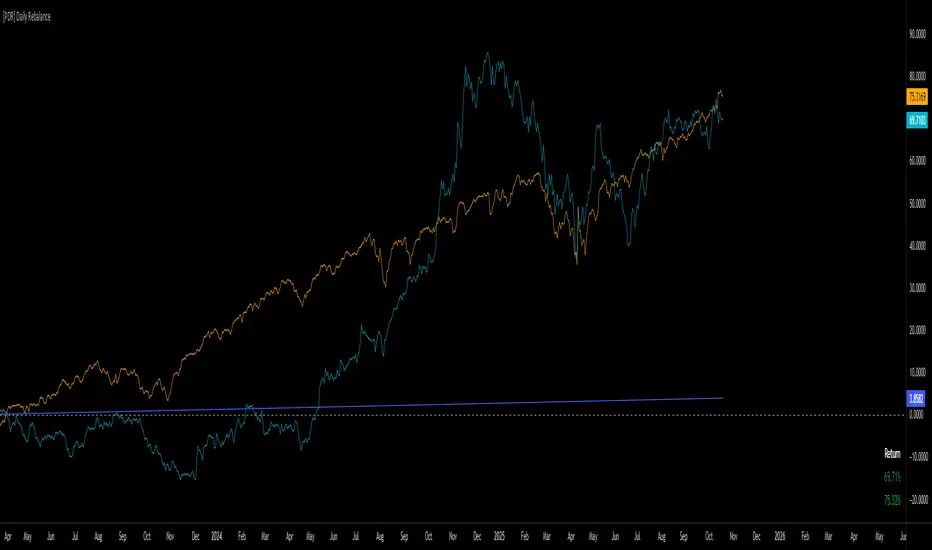
[PDR] Daily Rebalance█ OVERVIEW
This indicator is a powerful portfolio backtesting tool designed to simulate the performance of a static-weight, daily rebalancing strategy. It allows you to define a portfolio of up to 10 assets, set their target weights, and track its cumulative return against a user-defined benchmark and a risk-free rate.
The core of the script is its daily rebalancing logic, which calculates and logs every trade needed to bring the portfolio back to its target allocations at the close of each day. This provides a transparent and detailed view of how a static portfolio would have performed historically, including the impact of trading costs.
█ KEY FEATURES
Daily Rebalancing: Simulates a portfolio that is rebalanced at the close of every day to maintain target asset allocations.
Customizable Portfolio: Configure up to 10 different assets with specific weights. If all weights are left at 0, the script automatically creates an equal-weight portfolio from the selected assets.
Performance Comparison: Plots the portfolio's equity curve against a user-defined benchmark (e.g., SET:SET50 ) and a risk-free return, allowing for easy relative performance analysis.
Realistic Simulation: Accounts for trading costs like broker commission and minimum lot sizes for more accurate and grounded backtesting results.
Detailed Performance Metrics: An on-chart table displays real-time statistics, including Current Drawdown, Max Drawdown, and Total Return for both your portfolio and the benchmark.
Trade-by-Trade Logs: For full transparency, every rebalancing trade (BUY/SELL), including shares, price, notional value, and fees, is logged in the Pine Logs panel.
█ HOW TO USE
**Apply to a Daily Chart:** This script is designed to work exclusively on the daily ( 1D ) timeframe. Applying it to any other timeframe will result in a runtime error.
**Configure Settings:** Open the indicator's settings. Set your `Initial Capital`, `Start Time`, and the `Benchmark` symbol you wish to compare against.
**Define Your Assets:** In the 'Assets' group, check the box to enable each asset you want to include, select the symbol, and define its target `Weight (%)`.
**Set Trading Costs:** Adjust the `Broker Commission (%)` and `Minimal Buyable Lot` to match your expected trading conditions.
**Analyze the Results:** The performance curves are plotted in the indicator pane below your main chart. The key metrics table is displayed on the bottom-right of your chart.
**View Rebalancing Trades:** This is a crucial step for understanding the simulation. To see the detailed daily trades, you **must** open the **Pine Logs**. You can find this panel at the bottom of your TradingView window, next to the "Pine Editor" and "Strategy Tester" tabs. The logs provide a complete breakdown of every rebalancing action.
█ DISCLAIMER
This is a backtesting and simulation tool, not a trading signal generator. Its purpose is for research and performance analysis. Past performance is not indicative of future results. Always conduct your own research before making any investment decisions.
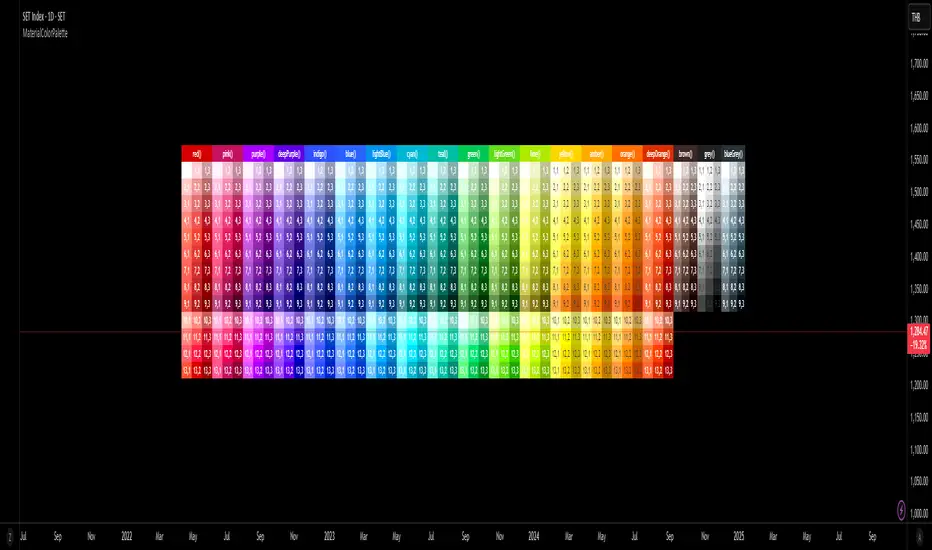
Material Color Palette Library█ OVERVIEW
Unlock a world of color in your Pine Script® projects with the Material Color Palette Library . This library provides a comprehensive and structured color system based on Google's Material Design palette, making it incredibly easy to create visually appealing and professional-looking indicators and strategies.
Forget about guessing hex codes. With this library, you have access to 19 distinct color families, each offering a wide range of shades. Every color can be fine-tuned with saturation, darkness, and opacity levels, giving you precise control over your script's appearance.
To make development even easier, the library includes a visual cheatsheet. Simply add the script to your chart to display a full table of all available colors and their corresponding parameters.
█ KEY FEATURES
Vast Spectrum: 19 distinct color families, from vibrant reds and blues to subtle greys and browns.
Fine-Tuned Control: Each color function accepts parameters for `saturationLevel` (1-13 or 1-9) and `darkLevel` (1-3) to select the perfect shade.
Opacity Parameter: Easily add transparency to any color for fills, backgrounds, or lines.
Quick Access Tones: A simple `tone()` function to grab base colors by name.
Visual Cheatsheet: An on-chart table displays the entire color palette, serving as a handy reference guide during development.
█ HOW TO USE
As a library, this script is meant to be imported into your own indicators or strategies.
1. Import the Library
Add the following line to the top of your script. Remember to replace `YourUsername` with your TradingView username.
import mastertop/ColorPalette/1 as colors
2. Call a Color Function
You can now use any of the exported functions to set colors for your plots, backgrounds, tables, and more.
The primary functions take three arguments: `functionName(saturationLevel, darkLevel, opacity)`
`saturationLevel`: An integer that controls the intensity of the color. Ranges from 1 (lightest) to 13 (most vibrant) for most colors, and 1-9 for `brown`, `grey`, and `blueGrey`.
`darkLevel`: An integer from 1 to 3 (1: light, 2: medium, 3: dark).
`opacity`: An integer from 0 (opaque) to 100 (invisible).
Example Usage:
Let's plot a moving average with a specific shade of teal.
// Import the library
import mastertop/ColorPalette/1 as colors
indicator("My Script with Custom Colors", overlay = true)
// Calculate a moving average
ma = ta.sma(close, 20)
// Plot the MA using a color from the library
// We'll use teal with saturation level 7, dark level 2, and 0% opacity
plot(ma, "MA", color = colors.teal(7, 2, 0), linewidth = 2)
3. Using the `tone()` Function
For quick access to a base color, you can use the `tone()` function.
// Set a red background with 85% transparency
bgcolor(colors.tone('red', 85))
█ VISUAL REFERENCE
To see all available colors at a glance, you can add this library script directly to your chart. It will display a comprehensive table showing every color variant. This makes it easy to pick the exact shade you need without guesswork.
This library is designed for fellow Pine Script® developers to streamline their workflow and enhance the visual quality of their scripts. Enjoy!
Blick Trades Position Size CalculatorThe Blick Trades Position Size indicator is a comprehensive Position Size Calculator designed for futures traders on TradingView. It automatically detects the asset type (Gold, Nasdaq, or ES futures - both regular and micro contracts) and calculates the optimal number of contracts to trade based on your risk amount and stop loss price.
The indicator features a "Maximize Risk" option that intelligently switches between regular and micro contracts to get as close as possible to your target risk amount, plus support for limit orders with custom entry prices. It displays visual elements on the chart including entry and stop loss lines with live risk calculations, and uses an asset-specific display system so you can control which charts show the indicator (preventing parameter confusion when switching between different futures contracts).
The calculator handles all the complex math automatically - just input your risk amount and stop loss, and it tells you exactly how many contracts to trade while showing your precise dollar risk in real-time.


N Order EMAThe exponential moving average is one of the most fundamental tools in technical analysis, but its implementation is almost always locked to a single mathematical approach. I've always wanted to extend the EMA into an n-order filter, and after some time working through the digital signal processing mathematics, I finally managed to do it. This indicator takes the familiar EMA concept and opens it up to four different discretization methods, each representing a valid way to transform a continuous-time exponential smoother into a discrete-time recursive filter. On top of that, it includes adjustable filter order, which fundamentally changes the frequency response characteristics in ways that simply changing the period length cannot achieve.
The four discretization styles are impulse-matched, all-pole, matched z-transform, and bilinear (Tustin). The all-pole version is exactly like stacking multiple EMAs together but implemented in a single function with proper coefficient calculation. It uses a canonical form where you get one gain coefficient and the rest are zeros, with the feedback coefficients derived from the binomial expansion of the pole polynomial. The other three methods are attempts at making generalizations of the EMA in different ways. Impulse-matched creates the filter by matching the discrete-time impulse response to what the continuous EMA would produce. Matched z-transform directly maps the continuous poles to the z-domain using the exponential relationship. Bilinear uses the Tustin transformation with frequency prewarping to ensure the cutoff frequency is preserved despite the inherent warping of the mapping.
Honestly, they're all mostly the same in practice, which is exactly what you'd expect since they're all valid discretizations of the same underlying filter. The differences show up in subtle ways during volatile market conditions or in the exact phase characteristics, but for most trading applications the outputs will track each other closely. That said, the bilinear version works particularly well at low periods like 2, where other methods can sometimes produce numerical artifacts. I personally like the z-match for its clean frequency-domain properties, but the real point here is demonstrating that you can tackle the same problem from multiple mathematical angles and end up with slightly different but equally valid implementations.
The order parameter is where things get interesting. A first-order EMA is the standard single-pole recursive filter everyone knows. When you move to second-order, you're essentially cascading two filter sections, which steepens the roll-off in the frequency domain and changes how the filter responds to sudden price movements. Higher orders continue this progression. The all-pole style makes this particularly clear since it's literally stacking EMA operations, but all four discretization methods support arbitrary order. This gives you control over the aggressiveness of the smoothing that goes beyond just adjusting the period length.
On top of the core EMA calculation, I've included all the standard variants that people use for reducing lag. DEMA applies the EMA twice and combines the results to get faster response. TEMA takes it further with three applications. HEMA uses a Hull-style calculation with fractional periods, applying the EMA to the difference between a half-period EMA and a full-period EMA, then smoothing that result with the square root of the period. These are all implemented using whichever discretization method you select, so you're not mixing different mathematical approaches. Everything stays consistent within the chosen framework.
The practical upside of this indicator is flexibility for people building trading systems. If you need a moving average with specific frequency response characteristics, you can tune the order parameter instead of hunting for the right period length. If you want to test whether different discretization methods affect your strategy's performance, you can swap between them without changing any other code. For most users, the impulse-matched style at order 1 will behave almost identically to a standard EMA, which gives you a familiar baseline to work from. From there you can experiment with higher orders or different styles to see if they provide any edge in your particular market or timeframe.
What this really highlights is that even something as seemingly simple as an exponential moving average involves mathematical choices that usually stay hidden. The standard EMA formula you see in textbooks is already a discretized version of a continuous exponential decay, and there are multiple valid ways to perform that discretization. By exposing these options, this indicator lets you explore a parameter space that most traders never even know exists. Whether that exploration leads to better trading results is an empirical question that depends on your strategy and market, but at minimum it's a useful reminder that the tools we take for granted are built on arbitrary but reasonable mathematical decisions.

NY Session Range Box with Labeled Time MarkersShows opening time ny session by timing with lines to inform traders to avoid 11:30am to 1:30pm for choppy sessions and mark early and power hour .

USDJPY MA Zone Entry Strategy USD/JPY tested only.A consistent strategy that gives me alerts each time my conditions are met. I am a funded prop firm trader. this strategy gives 45-70% annual returns. the sequence for this strategy is: After 4 stop loss hits, place a trade on the NEXT ENTRY ALERT ONCE: (-.188) pips draw back towards the stop loss. (this turns the Strat from 1-3 RISK/REWARD to 1-7+ RISK/REWARD). keep the Stop Loss the same (-.300) away from your entry. Take Profit placed at (+1.488) from entry. if 3 losses in a row happens AFTER you've followed these instructions, don't trade again UNTIL the strategy has a TAKE PROFIT gain, then the sequence starts over again. that is this strategies losing streak. after that streak is over. the strategy will be back to give you profits.

Colocar Ordens Fácil!This eases the process of creating limit orders on Trading View, when using the smarphone.
For that, the user inputs the given price range, the desired fibonacci entry level, and trade direction. The tools gives visual snap-to objects that can be used to lock long/short position tools, from which the option "create limit order" can be used to directly create the orders.


Previous Day & Week High/Low LevelsPrevious Day & Week High/Low Levels is a precision tool designed to help traders easily identify the most relevant price levels that often act as strong support or resistance areas in the market. It automatically plots the previous day’s and week’s highs and lows, as well as the current day’s developing internal high and low. These levels are crucial reference points for intraday, swing, and even position traders who rely on price action and liquidity behavior.
Key Features
Previous Day High/Low:
The indicator automatically draws horizontal lines marking the highest and lowest prices from the previous trading day.
These levels are widely recognized as potential zones where the market may react again — either rejecting or breaking through them.
Previous Week High/Low:
The script also tracks and displays the high and low from the last completed trading week.
Weekly levels tend to represent stronger liquidity pools and broader institutional zones, which makes them especially important when aligning higher timeframe context with lower timeframe entries.
Internal Daily High/Low (Real-Time Tracking):
While the day progresses, the indicator dynamically updates the current day’s internal high and low.
This allows traders to visualize developing market structure, identify intraday ranges, and anticipate potential breakouts or liquidity sweeps.
Multi-Timeframe Consistency:
All levels — daily and weekly — remain visible across any chart timeframe, from 1 minute to 1 day or higher.
This ensures traders can maintain perspective and avoid losing track of key zones when switching views.
Customizable Visuals:
The colors, line thickness, and label visibility can be easily adjusted to match personal charting preferences.
This makes the indicator adaptable to any trading style or layout, whether minimalistic or detailed.
How to Use
Identify Key Reaction Zones:
Observe how price interacts with the previous day and week levels. Rejections, consolidations, or clean breakouts around these lines often signal strong liquidity areas or potential directional moves.
Combine with Market Structure or Liquidity Concepts:
The indicator works perfectly with supply and demand analysis, liquidity sweeps, order block strategies, or simply classic support/resistance techniques.
Scalping and Intraday Trading:
On lower timeframes (1m–15m), the daily levels help identify intraday turning points.
On higher timeframes (1h–4h or daily), the weekly levels provide broader context and directional bias.
Risk Management and Planning:
Using these levels as reference points allows for more precise stop placement, target setting, and overall trade management.
Why This Indicator Helps
Markets often react strongly around previous highs and lows because these zones contain trapped liquidity, pending orders, or institutional decision points.
By having these areas automatically mapped out, traders gain a clear and objective view of where price is likely to respond — without needing to manually draw lines every day or week.
Whether you’re a beginner still learning about price structure, or an advanced trader refining entries within liquidity zones, this tool simplifies the process and keeps your charts clean, consistent, and data-driven.

Smart Weekly Lines — Clean & Scroll-Proof (Pine v6)Because your chart deserves structure. Elegant weekly dividers that stay aligned, scroll smoothly, and project future weeks using your wished UTC offset.
Smart Weekly Lines draws precise, full-height vertical lines marking each new week — perfectly aligned to your local UTC offset. It stays clean, smooth, and consistent no matter how far you scroll.
Features
• Accurate weekly boundaries based on your local UTC offset (supports half-hour zones like India +5.5)
• Clean, full-height lines that never cut off with zoom or scroll
• Adjustable color, opacity, width, and style (solid, dashed, dotted)
• Future week projection for planning and alignment
• Optional visibility: show only on Daily and Intraday charts
Works with any market — stocks, crypto, forex, or futures.
Built for traders who value clarity, structure, and precision.
Developed collaboratively with the assistance of ChatGPT under my direction and testing.

USCBBS-WDTGAL-RRPONTSYDThis is the U.S. Financial Market Net Liquidity.
The calculation method is to subtract the U.S. Treasury General Account balance (WDTGAL) and then the Overnight Reverse Repo balance (RRPONTSYD) from the Federal Reserve's balance sheet total (USCBBS).


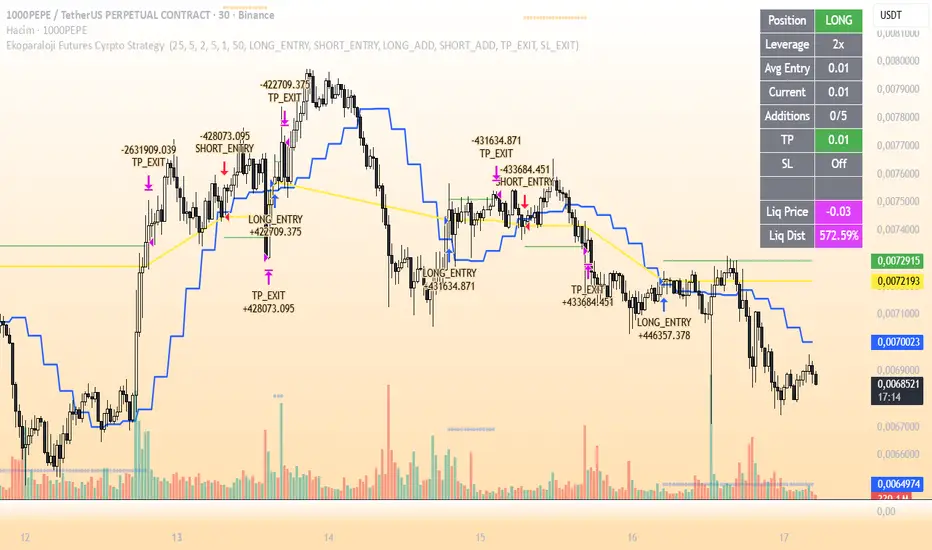
Ekoparaloji Futures Cyrpto Strategy Ekoparaloji Futures Crypto Strategy - Ladder Averaging System
This strategy uses a ladder position entry (pyramiding) approach and average cost reduction principle for crypto futures markets.
Key Features:
Dynamic ladder entry system
Profit-taking mechanism based on average price
Adjustable leverage support (1x-125x)
Long and Short position management
Optional stop-loss protection
Liquidation distance tracking
Advantages:
✓ Optimizes average cost during price fluctuations
✓ User-controlled risk-reward ratio
✓ Adapts to different market conditions
✓ Provides detailed visual feedback
✓ Increases profit potential through pyramiding strategy
Risks:
⚠ High leverage usage increases liquidation risk
⚠ Losses can accumulate during trend continuation
⚠ Pyramiding adds capital requirements
⚠ May produce unexpected results in sideways markets
⚠ Past performance does not guarantee future results
Recommended Usage:
This strategy is optimized for testing particularly on 30-minute and 1-hour timeframes. It may produce different results across various crypto pairs and market conditions.
Important Warning:
This strategy is for educational and research purposes. Extensive testing on demo accounts is strongly recommended before using in live trading. Leveraged trading involves high risk and you can lose all your capital.
📩 Message me to test the strategy and get access.
Happy Trading! 🚀
Biance Events 币安事件合约适用于biance中的Events,可用于btc和eth,两者表现相近,我不推荐梭哈,指标不能做到100%正确
Applicable to events in Binance, can be used for BTC and ETH, both perform similarly. I do not recommend going all-in, as indicators cannot be 100% accurate.

ATR Trailing Stop Without tradepanel Open✅ Only plots ATR trailing stop line
✅ Only colors candles
✅ No trades / entries
✅ No “Strategy Tester” panel
✅ No arrows, markers, or trade lists

Metallic Retracement LevelsThere's something that's always bothered me about how traders use Fibonacci retracements. Everyone treats the golden ratio like it's the only game in town, but mathematically speaking, it's completely arbitrary. The golden ratio is just the first member of an infinite family of metallic means, and there's no particular reason why 1.618 should be special for markets when we have the silver ratio at 2.414, the bronze ratio at 3.303, and literally every other metallic mean extending to infinity. We just picked one and decided it was magical.
The metallic means are a sequence of mathematical constants that generalize the golden ratio. They're defined by the equation x² = kx + 1, where k is any positive integer. When k equals 1, you get the golden ratio. When k equals 2, you get the silver ratio. When k equals 3, you get bronze, and so on forever. Each metallic mean generates its own set of ratios through successive powers, just like how the golden ratio gives you 0.618, 0.382, 0.236 and so forth. The silver ratio produces a completely different set of retracement levels, as does bronze, as does any arbitrary metallic number you want to choose.
This indicator calculates these metallic means using the standard alpha and beta formulas. For any metallic number k, alpha equals (k + sqrt(k² + 4)) / 2, and we generate retracement ratios by raising alpha to various negative powers. The script algorithmically generates these levels instead of hardcoding them, which is how it should have been done from the start. It's genuinely silly that most fib tools just hardcode the ratios when the math to generate them is straightforward. Even worse, traditional fib retracements use 0.5 as a level, which isn't even a fibonacci ratio. It's just thrown in there because it seems like it should be important.
The indicator works by first detecting swing points using the Sylvain Zig-Zag . The zig-zag identifies significant price swings by combining percentage change with ATR adjustments, filtering out noise and connecting major pivot points. This is what drives the retracement levels. Once a new swing is confirmed, the script calculates the range between the last two pivot points and generates metallic retracement levels from the most recent swing low or high.
You can adjust which metallic number to use (golden, silver, bronze, or any positive integer), control how many power ratios to display above and below the 1.0 level, and set how many complete retracement cycles you want drawn. The levels extend from the swing point and show you where price might react based on whichever metallic mean you've selected. The zig-zag settings let you tune the sensitivity of swing detection through ATR period, ATR multiplier, percentage reversal, and additional absolute or tick-based reversal values.
What this really demonstrates is that retracement analysis is more flexible than most traders realize. There's no mathematical law that says markets must respect the golden ratio over any other metallic mean. They're all valid mathematical constructs with the same kind of recursive properties. By making this tool, I wanted to highlight that using fibonacci retracements involves an arbitrary choice, and maybe that choice should be more deliberate or at least tested against alternatives. You can experiment with different metallic numbers and see which ones seem to work better for your particular market or timeframe, or just use this to understand that the standard fib levels everyone uses aren't as fundamental as they appear.
