EVWAPThis indicator plots two Volume-Weighted Average Price (VWAP) lines anchored to earnings events:
EVWAP (Earnings Day): Resets VWAP on the day of the earnings release.
EVWAP (Post-Earnings Day): Resets VWAP on the first trading day after earnings.
These earnings-based VWAPs help identify average price zones impacted by earnings, providing insight into post-earnings support/resistance and potential trend shifts. Works on all timeframes.
Useful for traders analyzing price reactions around earnings reports.
Göstergeler ve stratejiler

Volume MAs Oscillator | Lyro RSVolume MAs Oscillator | Lyro RS
Overview
The Volume MAs Oscillator is a powerful volume‑adjusted momentum tool that combines custom‑weighted moving averages on volume‑weighted price with smoothed deviation bands. It offers dynamic insights into trend direction, overbought/oversold conditions, and relative valuation — all within a single indicator
Key Features
Volume‑Adjusted Moving Averages: Moving averages can be volume‑weighted using the following formula: a moving average of (Price × Volume) divided by a moving average of Volume. This formula is applied across more than 14 different moving averages; however, it is not used with the VWMA, as VWMA is inherently a volume-weighted moving average.
Percentage Oscillator: Displays the normalized difference: (source – MA) / MA * 100, centered around zero for easy interpretation of strength and direction.
Deviation Bands: Builds upper and lower bands from standard deviation of the oscillator over a selected lookback, with distinct positive/negative multipliers and optional smoothing to reduce noise.
Inputs: Band Length, Band Smoothing, Positive Band Multiplier, Negative Band Multiplier.
Multi‑Mode Signal System:
1. Trend Mode – Colors oscillator according to breaks above (bullish) or below (bearish) respective bands.
2. Reversion Mode – Inverses color logic: signals overextensions beyond bands as reversion opportunities, greys inside the bands.
3. Valuation Mode – Applies a gradient color scale (UpC ⇄ DnC) to reflect relative valuation strength.
Customizable Visuals: Select from 5 pre‑set palettes—Classic, Mystic, Major Themes, Accented, Royal—or define your own custom bullish/bearish colors.
Chart enhancements include color‑coded oscillator line, deviation bands, glow‑effect midline at zero, background shading and candlestick/bar coloring aligned to signal mode.
Built‑In Signals: Automatically plots ▲ oversold and ▼ overbought markers upon crosses of lower/upper bands (in trend or reversion modes), enhancing signal clarity.
How It Works
MA Calculation – Applies the selected MA type to price × volume (normalized by MA of volume) or direct VWMA.
Oscillator Output – Calculates the % difference of source vs. derived MA.
Band Construction – Computes rolling standard deviation; applies user‑defined multipliers; smooths bands with exponential blending.
Mode-Dependent Coloring & Signals –
• Trend: Highlights strength trends via band cross coloring.
• Reversion: Flags extremes beyond bands as potential pullbacks.
• Valuation: Uses gradient to reflect oscillator’s position relative to recent range.
Signal Markers – Deploys arrows and color rules to flag overbought (▼) or oversold (▲) conditions when bands are breached.
Practical Use
Trend Confirmation – In Trend Mode, use upward price_diff cross above upper band as bullish; downward cross below lower band as bearish.
Mean Reversion – In Reversion Mode, fading extremes beyond bands may precede a retracement.
Relative Valuation – Valuation Mode shines when assessing how extended price_diff is, with gradient colors indicating valuation zones.
Bars/candles color‑coded to oscillator state boosts clarity of market tone and allows for rapid visual scanning.
Customization
Adjust MA type/length to tune responsiveness vs. smoothing.
Configure band settings for volatility sensitivity.
Toggle between signal modes for trend-following or reversion strategies.
Stylish visuals: pick or customize color schemes to match your chart setup.
⚠️Disclaimer
This indicator is a tool for technical analysis and does not provide guaranteed results. It should be used in conjunction with other analysis methods and proper risk management practices. The creators of this indicator are not responsible for any financial decisions made based on its signals.

Market Killer & Scalper [SUKH-X] [Only 1% can understand it]Advanced XAUUSD Scalper Pro - Complete Trading System
🎯 Overview
The Advanced XAUUSD Scalper Pro is a comprehensive Pine Script indicator specifically designed for scalping XAUUSD (Gold/USD) on 5-minute timeframes. This professional-grade tool combines multiple technical analysis methods to provide high-accuracy entry and exit signals for short-term traders.
🔧 Core Features
Dynamic Support & Resistance System
Automatic Pivot Detection : Identifies key pivot highs and lows based on customizable strength settings
Visual S&R Boxes : Color-coded boxes highlighting support (green) and resistance (red) zones
Adaptive Levels : Maintains up to 10 dynamic S&R levels that update in real-time
Breakout Detection : Alerts when price breaks through significant levels with volume confirmation
Advanced Breakout Analysis [ /i]
Threshold-Based Detection : Customizable breakout percentage thresholds (default 0.02%)
Volume Confirmation : Optional volume spike validation for stronger signals
Consolidation Zones : Identifies sideways markets before potential breakouts
Multi-Timeframe Support : Works across different timeframes with adaptive parameters
### **Reversal Signal System**
- **RSI Integration**: 14-period RSI with customizable overbought (70) and oversold (30) levels
- **Stochastic Oscillator**: Dual %K and %D lines for momentum confirmation
- **Candlestick Patterns**: Incorporates bullish/bearish candlestick analysis
- **Divergence Detection**: Identifies potential trend reversals at key levels
### **Scalping Optimization**
- **Dual EMA System**: Fast EMA (8) and Slow EMA (21) for trend direction
- **ATR-Based Calculations**: Dynamic stop-loss and take-profit levels using Average True Range
- **Trend Strength Filter**: Background coloring indicates strong uptrends (green) and downtrends (red)
- **Noise Reduction**: Filters out false signals in choppy market conditions
## 📊 **Visual Elements**
### **Signal Types**
- **🟢 Green Triangle Up**: Long entry signal with confluence of bullish factors
- **🔴 Red Triangle Down**: Short entry signal with bearish confirmation
- **🟡 Yellow X**: Exit signals for both long and short positions
- **Blue/Orange Lines**: Fast and slow EMAs for trend visualization
### **Information Dashboard**
- **Real-Time Statistics**: Live price, ATR, RSI, trend direction, and volume status
- **S&R Level Counter**: Shows active support and resistance levels
- **Consolidation Indicator**: Identifies low-volatility periods
- **Market Condition**: Current trend strength and direction
## ⚙️ **Customizable Parameters**
### **Support & Resistance Settings**
- S&R Period: 5-100 (default: 20)
- S&R Strength: 1-5 (default: 2)
- Maximum S&R Levels: 3-10 (default: 5)
- Visual box display toggle
### **Breakout Configuration**
- Breakout threshold: 0.01%-0.1% (default: 0.02%)
- Volume confirmation on/off
- Minimum consolidation bars: 5-50 (default: 10)
### **Reversal Settings**
- RSI period: 2-50 (default: 14)
- Overbought/oversold levels: customizable
- Stochastic %K and %D periods
### **Scalping Parameters**
- Fast EMA: 3-20 (default: 8)
- Slow EMA: 10-50 (default: 21)
- ATR period and multiplier for risk management
## 🚀 **Best Practices**
### **Optimal Setup**
- **Timeframe**: 5-minute charts (can be adapted for 1m, 3m, 15m)
- **Instrument**: XAUUSD (Gold/USD) - specifically optimized for gold volatility
- **Session**: Best during London and New York overlaps
- **Market Conditions**: Most effective in trending and breakout scenarios
### **Risk Management**
- Use ATR multiplier (1.5x default) for stop-loss placement
- Take profit at 2:1 or 3:1 risk-reward ratios
- Enable volume confirmation for higher-probability trades
- Monitor news events that affect gold prices
### **Signal Interpretation**
- **Strong Signals**: Multiple confirmations (trend + S&R + momentum)
- **Weak Signals**: Single indicator signals during consolidation
- **Exit Strategy**: Use yellow X markers or when price hits opposite EMA
## 📈 **Performance Features**
### **Accuracy Enhancements**
- **Multi-Confirmation System**: Requires multiple technical factors to align
- **False Signal Filtering**: Reduces noise through trend and volume filters
- **Adaptive Levels**: S&R levels update based on recent price action
- **Market Structure Analysis**: Considers overall market context
### **Alert System**
- **Entry Alerts**: Long and short signal notifications
- **Exit Alerts**: Position closure recommendations
- **Level Alerts**: S&R breakout notifications
- **Custom Messages**: Detailed alert information including price and ATR
## 🎨 **Visual Customization**
- Toggle all visual elements on/off
- Customizable colors and transparency
- Adjustable line widths and styles
- Statistics table positioning
- Background coloring for trend identification
## 📋 **Technical Requirements**
- Pine Script v5 compatible
- Maximum 500 boxes and lines for optimal performance
- Real-time data feed recommended
- Works on TradingView Pro, Pro+, and Premium plans
## 🔍 **Unique Selling Points**
1. **XAUUSD Specific**: Optimized parameters for gold's unique volatility patterns
2. **Scalping Focus**: Designed for quick entries and exits with minimal lag
3. **Complete System**: Combines trend, momentum, and S&R analysis
4. **Professional Grade**: Institutional-quality technical analysis
5. **User-Friendly**: Intuitive visual signals with comprehensive customization
## ⚠️ **Disclaimer**
This indicator is a technical analysis tool designed to assist in trading decisions. It should not be used as the sole basis for trading decisions. Always combine with proper risk management, fundamental analysis, and market awareness. Past performance does not guarantee future results. Trading gold (XAUUSD) involves substantial risk and may not be suitable for all investors.
## 🏷️ **Tags**
`XAUUSD` `Gold` `Scalping` `Support` `Resistance` `Breakout` `Reversal` `EMA` `RSI` `Stochastic` `ATR` `Volume` `Alerts` `5min` `Intraday`

Divergence Screener [Trendoscope®]🎲Overview
The Divergence Screener is a powerful TradingView indicator designed to detect and visualize bullish and bearish divergences, including hidden divergences, between price action and a user-selected oscillator. Built with flexibility in mind, it allows traders to customize the oscillator type, trend detection method, and other parameters to suit various trading strategies. The indicator is non-overlay, displaying divergence signals directly on the oscillator plot, with visual cues such as lines and labels on the chart for easy identification.
This indicator is ideal for traders seeking to identify potential reversal or continuation signals based on price-oscillator divergences. It supports multiple oscillators, trend detection methods, and alert configurations, making it versatile for different markets and timeframes.
🎲Features
🎯Customizable Oscillator Selection
Built-in Oscillators : Choose from a variety of oscillators including RSI, CCI, CMO, COG, MFI, ROC, Stochastic, and WPR.
External Oscillator Support : Users can input an external oscillator source, allowing integration with custom or third-party indicators.
Configurable Length : Adjust the oscillator’s period (e.g., 14 for RSI) to fine-tune sensitivity.
🎯Divergence Detection
The screener identifies four types of divergences:
Bullish Divergence : Price forms a lower low, but the oscillator forms a higher low, signaling potential upward reversal.
Bearish Divergence : Price forms a higher high, but the oscillator forms a lower high, indicating potential downward reversal.
Bullish Hidden Divergence : Price forms a higher low, but the oscillator forms a lower low, suggesting trend continuation in an uptrend.
Bearish Hidden Divergence : Price forms a lower high, but the oscillator forms a higher high, suggesting trend continuation in a downtrend.
🎯Flexible Trend Detection
The indicator offers three methods to determine the trend context for divergence detection:
Zigzag : Uses zigzag pivots to identify trends based on higher highs (HH), higher lows (HL), lower highs (LH), and lower lows (LL).
MA Difference : Calculates the trend based on the difference in a moving average (e.g., SMA, EMA) between divergence pivots.
External Trend Signal : Allows users to input an external trend signal (positive for uptrend, negative for downtrend) for custom trend analysis.
🎯Zigzag-Based Pivot Analysis
Customizable Zigzag Length : Adjust the zigzag length (default: 13) to control the sensitivity of pivot detection.
Repaint Option : Choose whether divergence lines repaint based on the latest data or wait for confirmed pivots, balancing responsiveness and reliability.
🎯Visual and Alert Features
Divergence Visualization : Divergence lines are drawn between price pivots and oscillator pivots, color-coded for easy identification:
Bullish Divergence : Green
Bearish Divergence : Red
Bullish Hidden Divergence : Lime
Bearish Hidden Divergence : Orange
Labels and Tooltips : Labels (e.g., “D” for divergence, “H” for hidden) appear on price and oscillator pivots, with tooltips providing detailed information such as price/oscillator values, ratios, and pivot directions.
Alerts : Configurable alerts for each divergence type (bullish, bearish, bullish hidden, bearish hidden) trigger on bar close, ensuring timely notifications.
🎲 How It Works
🎯Oscillator Calculation
The indicator calculates the selected oscillator (or uses an external source) and plots it on the chart.
Oscillator values are stored in a map for reference during divergence calculations.
🎯Pivot Detection
A zigzag algorithm identifies pivots in the oscillator data, with configurable length and repainting options.
Price and oscillator pivots are compared to detect divergences based on their direction and ratio.
🎯Divergence Identification
The indicator compares price and oscillator pivot directions (HH, HL, LH, LL) to identify divergences.
Trend context is determined using the selected method (Zigzag, MA Difference, or External).
Divergences are classified as bullish, bearish, bullish hidden, or bearish hidden based on price-oscillator relationships and trend direction.
🎯Visualization and Alerts
Valid divergences are drawn as lines connecting price and oscillator pivots, with corresponding labels.
Alerts are triggered for allowed divergence types, providing detailed information via tooltips.
🎯Validation
Divergence lines are validated to ensure no intermediate bars violate the divergence condition, enhancing signal reliability.
🎲 Usage Instructions as Indicator
🎯Add to Chart:
Add the “Divergence Screener ” to your TradingView chart.
The indicator appears in a separate pane below the price chart, plotting the oscillator and divergence signals.
🎯Configure Settings:
Adjust the oscillator type and length to match your trading style.
Select a trend detection method and configure related parameters (e.g., MA type/length or external signal).
Set the zigzag length and repainting preference.
Enable/disable alerts for specific divergence types.
I🎯nterpret Signals:
Bullish Divergence (Green) : Look for potential buy opportunities in a downtrend.
Bearish Divergence (Red) : Consider sell opportunities in an uptrend.
Bullish Hidden Divergence (Lime) : Confirm continuation in an uptrend.
Bearish Hidden Divergence (Orange): Confirm continuation in a downtrend.
Use tooltips on labels to review detailed pivot and divergence information.
🎯Set Alerts:
Create alerts for each divergence type to receive notifications via TradingView’s alert system.
Alerts include detailed text with price, oscillator, and divergence information.
🎲 Example Scenarios as Indicator
🎯 With External Oscillator (Use MACD Histogram as Oscillator)
In order to use MACD as an oscillator for divergence signal instead of the built in options, follow these steps.
Load MACD Indicator from Indicator library
From Indicator settings of Divergence Screener, set Use External Oscillator and select MACD Histograme from the dropdown
You can now see that the oscillator pane shows the data of selected MACD histogram and divergence signals are generated based on the external MACD histogram data.
🎯 With External Trend Signal (Supertrend Ladder ATR)
Now let's demonstrate how to use external direction signals using Supertrend Ladder ATR indicator. Please note that in order to use the indicator as trend source, the indicator should return positive integer for uptrend and negative integer for downtrend. Steps are as follows:
Load the desired trend indicator. In this example, we are using Supertrend Ladder ATR
From the settings of Divergence Screener, select "External" as Trend Detection Method
Select the trend detection plot Direction from the dropdown. You can now see that the divergence signals will rely on the new trend settings rather than the built in options.
🎲 Using the Script with Pine Screener
The primary purpose of the Divergence Screener is to enable traders to scan multiple instruments (e.g., stocks, ETFs, forex pairs) for divergence signals using TradingView’s Pine Screener, facilitating efficient comparison and identification of trading opportunities.
To use the Divergence Screener as a screener, follow these steps:
Add to Favorites : Add the Divergence Screener to your TradingView favorites to make it available in the Pine Screener.
Create a Watchlist : Build a watchlist containing the instruments (e.g., stocks, ETFs, or forex pairs) you want to scan for divergences.
Access Pine Screener : Navigate to the Pine Screener via TradingView’s main menu: Products -> Screeners -> Pine, or directly visit tradingview.com/pine-screener/.
Select Watchlist : Choose the watchlist you created from the Watchlist dropdown in the Pine Screener interface.
Choose Indicator : Select Divergence Screener from the Choose Indicator dropdown.
Configure Settings : Set the desired timeframe (e.g., 1 hour, 1 day) and adjust indicator settings such as oscillator type, zigzag length, or trend detection method as needed.
Select Filter Criteria : Select the condition on which the watchlist items needs to be filtered. Filtering can only be done on the plots defined in the script.
Run Scan : Press the Scan button to display divergence signals across the selected instruments. The screener will show which instruments exhibit bullish, bearish, bullish hidden, or bearish hidden divergences based on the configured settings.
🎲 Limitations and Possible Future Enhancements
Limitations are
Custom input for oscillator and trend detection cannot be used in pine screener.
Pine screener has max 500 bars available.
Repaint option is by default enabled. When in repaint mode expect the early signal but the signals are prone to repaint.
Possible future enhancements
Add more built-in options for oscillators and trend detection methods so that dependency on external indicators is limited
Multi level zigzag support

Trend Tracker ProTrend Tracker Pro - Advanced Trend Following Indicator
Overview
Trend Tracker Pro is a sophisticated trend-following indicator that combines the power of Exponential Moving Average (EMA) and Average True Range (ATR) to identify market trends and generate precise buy/sell signals. This indicator is designed to help traders capture trending moves while filtering out market noise.
🎯 Key Features
✅ Dynamic Trend Detection
Uses EMA and ATR-based bands to identify trend direction
Automatically adjusts to market volatility
Clear visual trend line that changes color based on market direction
✅ Precise Signal Generation
Buy signals when trend changes to bullish
Sell signals when trend changes to bearish
Reduces false signals by requiring actual trend changes
✅ Visual Clarity
Green trend line: Bullish trend
Red trend line: Bearish trend
Gray trend line: Sideways/neutral trend
Triangle arrows for buy/sell signals
Clear BUY/SELL text labels
✅ Customizable Settings
Trend Length: Adjustable period for EMA and ATR calculation (default: 14)
ATR Multiplier: Controls sensitivity of trend bands (default: 2.0)
Show/Hide Signals: Toggle signal arrows on/off
Show/Hide Labels: Toggle text labels on/off
✅ Built-in Information Panel
Real-time trend direction display
Current trend level value
ATR value for volatility reference
Last signal information
✅ TradingView Alerts
Buy signal alerts
Sell signal alerts
Customizable alert messages
🔧 How It Works
Algorithm Logic:
1.
Calculate EMA: Uses exponential moving average for trend baseline
2.
Calculate ATR: Measures market volatility
3.
Create Bands: Upper band = EMA + (ATR × Multiplier), Lower band = EMA - (ATR × Multiplier)
4.
Determine Trend:
Price above upper band → Bullish trend (trend line = lower band)
Price below lower band → Bearish trend (trend line = upper band)
Price between bands → Continue previous trend
5.
Generate Signals: Signal occurs when trend direction changes
📊 Best Use Cases
✅ Trending Markets
Excellent for capturing strong directional moves
Works well in both bull and bear markets
Ideal for swing trading and position trading
✅ Multiple Timeframes
Effective on all timeframes from 15 minutes to daily
Higher timeframes provide more reliable signals
Can be used for both scalping and long-term investing
✅ Various Asset Classes
Stocks, Forex, Cryptocurrencies, Commodities
Particularly effective in volatile markets
Adapts automatically to different volatility levels
⚙️ Recommended Settings
Conservative Trading (Lower Risk)
Trend Length: 20
ATR Multiplier: 2.5
Best for: Long-term positions, lower frequency signals
Balanced Trading (Default)
Trend Length: 14
ATR Multiplier: 2.0
Best for: Swing trading, moderate frequency signals
Aggressive Trading (Higher Risk)
Trend Length: 10
ATR Multiplier: 1.5
Best for: Day trading, higher frequency signals
🎨 Visual Elements
Trend Line: Main indicator line that follows the trend
Signal Arrows: Triangle shapes indicating buy/sell points
Text Labels: Clear "BUY" and "SELL" text markers
Information Table: Real-time status panel in top-right corner
Color Coding: Intuitive green/red color scheme
⚠️ Important Notes
Risk Management
Always use proper position sizing
Set stop-losses based on ATR values
Consider market conditions and volatility
Not recommended for ranging/sideways markets
Signal Confirmation
Consider using with other indicators for confirmation
Pay attention to volume and market structure
Be aware of major news events and market sessions
Backtesting Recommended
Test the indicator on historical data
Optimize parameters for your specific trading style
Consider transaction costs in your analysis


Enhanced Gann Time-Price SquaresEnhanced Gann Time-Price Squares Indicator
A comprehensive Pine Script indicator that identifies and visualizes W.D. Gann's time-price square formations on your charts. This tool helps traders spot potential market turning points where time and price movements align according to Gann's legendary market theories.
Key Features:
Automatic Square Detection - Identifies completed squares where price movement equals time movement
Future Projections - Shows forming squares with projected completion points
Pivot Integration - Automatically detects pivot highs/lows as square starting points
Visual Clarity - Clean box outlines with customizable colors and styles
Smart Filtering - Prevents overlapping squares and includes minimum move thresholds
Real-time Status - Information table showing current square formations
How to Use:
The indicator draws boxes when price moves from pivot points equal the time elapsed (number of bars). Green squares indicate upward movements, red squares show downward movements. Dashed lines show forming squares, while dotted lines project where they might complete.
Settings:
Adjust pivot sensitivity and minimum price moves
Customize tolerance for time-price matching
Toggle projections, labels, and visual elements
Fine-tune colors and line styles
Perfect for Gann theory practitioners and traders looking for time-based market analysis. The squares often coincide with significant support/resistance levels and potential reversal points.
Compatible with all timeframes and instruments.
More updates to follow


Multi-Time Period Charts with Wicks - ENEXSLWe wanted to see the candle wicks on the official Multi-Time Period Charts indicator.
This version has wick calculations added. Please see www.tradingview.com for the original indicator breakdown.
In short, this indicator will reference larger time periods and draw a candle with the wick around a smaller timeframe chart..

Two Poles Trend Finder MTF [BigBeluga]🔵 OVERVIEW
Two Poles Trend Finder MTF is a refined trend-following overlay that blends a two-pole Gaussian filter with a multi-timeframe dashboard. It provides a smooth view of price dynamics along with a clear summary of trend directions across multiple timeframes—perfect for traders seeking alignment between short and long-term momentum.
🔵 CONCEPTS
Two-Pole Filter: A smoothing algorithm that responds faster than traditional moving averages but avoids the noise of short-term fluctuations.
var float f = na
var float f_prev1 = na
var float f_prev2 = na
// Apply two-pole Gaussian filter
if bar_index >= 2
f := math.pow(alpha, 2) * source + 2 * (1 - alpha) * f_prev1 - math.pow(1 - alpha, 2) * f_prev2
else
f := source // Warm-up for first bars
// Shift state
f_prev2 := f_prev1
f_prev1 := f
Trend Detection Logic: Trend direction is determined by comparing the current filtered value with its value n bars ago (shifted comparison).
MTF Alignment Dashboard: Trends from 5 configurable timeframes are monitored and visualized as colored boxes:
• Green = Uptrend
• Magenta = Downtrend
Summary Arrow: An average trend score from all timeframes is used to plot an overall arrow next to the asset name.
🔵 FEATURES
Two-Pole Gaussian Filter offers ultra-smooth trend curves while maintaining responsiveness.
Multi-Timeframe Trend Detection:
• Default: 1H, 2H, 4H, 12H, 1D (fully customizable)
• Each timeframe is assessed independently using the same trend logic.
Visual Trend Dashboard positioned at the bottom-right of the chart with color-coded trend blocks.
Dynamic Summary Arrow shows overall market bias (🢁 / 🢃) based on majority of uptrends/downtrends.
Bold + wide trail plot for the filter value with gradient coloring based on directional bias.
🔵 HOW TO USE
Use the multi-timeframe dashboard to identify aligned trends across your preferred trading horizons.
Confirm trend strength or weakness by observing filter slope direction .
Look for dashboard consensus (e.g., 4 or more timeframes green] ) as confirmation for breakout, continuation, or trend reentry strategies.
Combine with volume or price structure to enhance entry timing.
🔵 CONCLUSION
Two Poles Trend Finder MTF delivers a clean and intuitive trend-following solution with built-in multi-timeframe awareness. Whether you’re trading intra-day or positioning for swing setups, this tool helps filter out market noise and keeps you focused on directional consensus.

Custom Daily Session Zones by KoenigseggCustom Daily Session Zones
🟣 Description
This indicator displays customizable trading session time zones as background highlights on your chart, on any timeframe you choose. The inline info tooltip provides the precise start and end times of the three largest market sessions—the US, the EU, and ASIA—for quick reference. It provides flexible control over session times for different days of the week, making it ideal for traders who need to visualize specific market hours or trading sessions.
🟣 Key Features
- Flexible Session Configuration: Set a common session time for all days or customize individual sessions for each day of the week
- Per-Day Control: Enable or disable sessions for specific days (Monday through Sunday)
- Color Customization: Choose unique colors for each day's session zones
- UTC Timezone Standard: All session times are defined in UTC to ensure consistency across charts
- Clean Visual Display: Non-intrusive background highlighting that doesn't interfere with price action
🟣 How to Use
- Common Session Mode: Use the default mode to apply the same session time across all enabled days
- Manual Per-Day Mode: Enable "Manual per-day sessions" to set different session times for each day
- Day Selection: Toggle individual days on/off based on your trading schedule
- Color Coding: Customize colors for each day to easily distinguish between different sessions
🟣 Technical Details
- Uses Pine Script v6 for optimal performance
- Implements proper session time detection using TradingView's built-in time functions
- Operates in UTC timezone for all session calculations
- Lightweight code that doesn't impact chart performance
🟣 Use Cases
- Highlight specific trading sessions (London, New York, Tokyo, etc.)
- Mark important market hours for your trading strategy
- Visualize different session overlaps
- Create custom trading time windows
- Track market activity during specific hours
🟣 Compatibility
- Works on all timeframes
- Compatible with all asset classes (Forex, Stocks, Crypto, Futures, etc.)
- Supports all TradingView chart types
- Responsive design that adapts to different screen sizes
🟣 Image Descriptions
- First Image (main image): Shows multiple New York Stock Exchange sessions from 1:30 p.m. to 8:00 p.m. (UTC), on the 15-minute timeframe, with each day’s zone colored differently to demonstrate the indicator’s customizable color settings.
- Second Image: A zoomed‑in fractal chart view of the same New York session on the 15-minute timeframe, illustrating how the background session zone appears even at higher detail levels.
Third Image: A close‑up of the New York session (1:30 p.m. to 8:00 p.m.) on the 3-minute timeframe, reaffirming the consistency of zone highlighting across different zoom levels.
🟣 Future Updates (v2)
In the next release, you’ll be able to define multiple session blocks per day—displaying two distinct colored zones within the same trading day. This will help you visualize when one market session ends and another begins without losing chart clarity.
🟣 Conclusion
This indicator is perfect for traders who need precise control over Market Session visualization and want to maintain a clean, professional chart appearance.
🟣 Disclaimer
This script is provided for educational and illustrative purposes only. It is not financial or trading advice, nor a recommendation to buy or sell any asset. Always conduct your own research and consult a professional before making any trading decisions.

Swing Structure [HH HL LH LL + 😎 + 👻]Tracks real-time swing structure (HH, HL, LH, LL) using confirmed pivot points. Shows ghost 👻 and cool 😎 emojis at key higher low setups. Great for identifying breakout retests and trend continuation zones. No repaint.

liq depth fvg/bprA script that draws liquidity depth boxes from the 9.30-10.00 am range which can prove decent areas to look for a reversal. It also draws in fvg and bpr levels which can help add confluence to a trade ideas. The 9.30 to 10.00 am range is highlighted by blue lines to assist in opening range trades as described by Casper SMC.

XAUUSD BOS + Retest Looser Bot//@version=5
indicator("SMC Map — BOS/CHoCH + PD + Liquidity + Killzones", overlay=true)
// === CONFIG ===
pd_tf = input.timeframe("240", "HTF for PD array")
show_killzone = input.bool(true, "Show Killzones")
// === HTF SWINGS ===
htf_high = request.security(syminfo.tickerid, pd_tf, high)
htf_low = request.security(syminfo.tickerid, pd_tf, low)
pd_mid = (htf_high + htf_low) / 2
// Plot PD midline
plot(pd_mid, title="PD 50%", color=color.gray, linewidth=2)
// === SWING STRUCTURE ===
var float swing_high = na
var float swing_low = na
is_swing_high = ta.highest(high, 3) == high and close < high
is_swing_low = ta.lowest(low, 3) == low and close > low
if (is_swing_high)
swing_high := high
if (is_swing_low)
swing_low := low
// === BOS / CHoCH ===
bos_up = not na(swing_high) and close > swing_high
bos_down = not na(swing_low) and close < swing_low
var int structure_dir = 0 // 0=neutral, 1=up, -1=down
choch_up = false
choch_down = false
if (bos_up)
choch_up := structure_dir == -1
structure_dir := 1
if (bos_down)
choch_down := structure_dir == 1
structure_dir := -1
// === PLOTS ===
plotshape(bos_up, title="BOS UP", style=shape.triangleup, location=location.belowbar, color=color.green, size=size.small)
plotshape(bos_down, title="BOS DOWN", style=shape.triangledown, location=location.abovebar, color=color.red, size=size.small)
plotshape(choch_up, title="CHOCH UP", style=shape.labelup, location=location.belowbar, color=color.lime, size=size.tiny, text="CHOCH")
plotshape(choch_down, title="CHOCH DOWN", style=shape.labeldown, location=location.abovebar, color=color.maroon, size=size.tiny, text="CHOCH")
plot(swing_high, title="Swing High Liquidity", color=color.new(color.green, 50), style=plot.style_cross, linewidth=1)
plot(swing_low, title="Swing Low Liquidity", color=color.new(color.red, 50), style=plot.style_cross, linewidth=1)
// === KILLZONE ===
in_london = (hour >= 6 and hour < 11)
in_ny = (hour >= 12 and hour < 18)
bgcolor(show_killzone and in_london ? color.new(color.green, 90) : na)
bgcolor(show_killzone and in_ny ? color.new(color.blue, 90) : na)

Logistic Regression ICT FVG🚀 OVERVIEW
Welcome to the Logistic Regression Fair Value Gap (FVG) System — a next-gen trading tool that blends precision gap detection with machine learning intelligence.
Unlike traditional FVG indicators, this one evolves with each bar of price action, scoring and filtering gaps based on real market behavior.
🔧 CORE FEATURES
✨ Smart Gap Detection
Automatically identifies bullish and bearish Fair Value Gaps using volatility-aware candle logic.
📊 Probability-Based Filtering
Uses logistic regression to assign each gap a confidence score (0 to 1), showing only high-probability setups.
🔁 Real-Time Retest Tracking
Continuously watches how price interacts with each gap to determine if it deserves respect.
📈 Multi-Factor Assessment
Evaluates RSI, MACD, and body size at gap formation to build a full context snapshot.
🧠 Self-Learning Engine
The logistic regression model updates on each bar using gradient descent, refining its predictions over time.
📢 Built-In Alerts
Get instant alerts when a gap forms, gets retested, or breaks.
🎨 Custom Display Options
Control the color of bullish/bearish zones, and toggle on/off probability labels for cleaner charts.
🚩 WHAT MAKES IT DIFFERENT
This isn’t just another box-drawing indicator.
While others mark every imbalance, this system thinks before it draws — using statistical modeling to filter out noise and prioritize high-impact zones.
By learning from how price behaves around gaps (not just how they form), it helps you trade only what matters — not what clutters.
⚙️ HOW IT WORKS
1️⃣ Detection
FVGs are identified using ATR-based thresholds and sharp wick imbalances.
2️⃣ Behavior Monitoring
Every gap is tracked — and if respected enough times, it becomes part of the elite training set.
3️⃣ Context Capture
Each new FVG logs RSI, MACD, and body size to provide a feature-rich context for prediction.
4️⃣ Prediction (Logistic Regression)
The model predicts how likely the gap is to be respected and assigns it a probability score.
5️⃣ Classification & Alerts
Gaps above the threshold are plotted with score labels, and alerts trigger for entry/respect/break.
⚙️ CONFIGURATION PANEL
🔧 System Inputs
• Max Retests – How many times a gap must be respected to train the model
• Prediction Threshold – Minimum score to show a gap on the chart
• Learning Rate – Controls how fast the model adapts (default: 0.009)
• Max FVG Lifetime – Expiration duration for unused gaps
• Show Historic Gaps – Show/hide expired or invalidated gaps
🎨 Visual Options
• Bullish/Bearish Colors – Set gap colors to fit your chart style
• Confidence Labels – Show probability scores next to FVGs
• Alert Toggles – Enable alerts for:
– New FVG detected
– FVG respected (entry)
– FVG invalidated (break)
💡 WHY LOGISTIC REGRESSION?
Traditional FVG tools rely on candle shapes.
This system relies on probability — by training on RSI, MACD, and price behavior, it predicts whether a gap will act as a true liquidity zone.
Logistic regression lets the system continuously adapt using new data, making it more accurate the longer it runs.
That means smarter signals, fewer false positives, and a clearer view of where real opportunities lie.

Price x Vol RSIAn enhanced RSI indicator that integrates the RSI of volume as a conviction amplifier.
This script modifies the RSI to range from −1 to +1, allowing it to express directional momentum. Volume RSI remains in the range of 0 to +1, serving as a direction-neutral amplifier.
The result is a bi-directional composite RSI that:
>> Emphasizes congruent signals (e.g., strong price direction with strong volume).
>> Minimizes misleading signals from high volume paired with neutral or conflicting price movement.
Ideal for identifying high-conviction breakouts and momentum divergences with volume support.
the plot fill increases in color when the plot approaches zero, then reverses away from zero, and resets on a zero-cross.
check out my other script, the PXVS, which is what this RSI script was based on. it uses similar logic as this script, but with FSTO %K instead of RSI


EVaR Indicator and Position SizingThe Problem:
Financial markets consistently show "fat-tailed" distributions where extreme events occur with higher frequency than predicted by normal distributions (Gaussian or even log-normal). These fat tails manifest in sudden price crashes, volatility spikes, and black swan events that traditional risk measures like volatility can underestimate. Standard deviation and conventional VaR calculations assume normally distributed returns, leaving traders vulnerable to severe drawdowns during market stress.
Cryptocurrencies and volatile instruments display particularly pronounced fat-tailed behavior, with extreme moves occurring 5-10 times more frequently than normal distribution models would predict. This reality demands a more sophisticated approach to risk measurement and position sizing.
The Solution: Entropic Value at Risk (EVAR)
EVaR addresses these limitations by incorporating principles from statistical mechanics and information theory through Tsallis entropy. This advanced approach captures the non-linear dependencies and power-law distributions characteristic of real financial markets.
Entropy is more adaptive than standard deviations and volatility measures.
I was inspired to create this indicator after reading the paper " The End of Mean-Variance? Tsallis Entropy Revolutionises Portfolio Optimisation in Cryptocurrencies " by by Sana Gaied Chortane and Kamel Naoui.
Key advantages of EVAR over traditional risk measures:
Superior tail risk capture: More accurately quantifies the probability of extreme market moves
Adaptability to market regimes: Self-calibrates to changing volatility environments
Non-parametric flexibility: Makes less assumptions about the underlying return distribution
Forward-looking risk assessment: Better anticipates potential market changes (just look at the charts :)
Mathematically, EVAR is defined as:
EVAR_α(X) = inf_{z>0} {z * log(1/α * M_X(1/z))}
Where the moment-generating function is calculated using q-exponentials rather than conventional exponentials, allowing precise modeling of fat-tailed behavior.
Technical Implementation
This indicator implements EVAR through a q-exponential approach from Tsallis statistics:
Returns Calculation: Price returns are calculated over the lookback period
Moment Generating Function: Approximated using q-exponentials to account for fat tails
EVAR Computation: Derived from the MGF and confidence parameter
Normalization: Scaled to for intuitive visualization
Position Sizing: Inversely modulated based on normalized EVAR
The q-parameter controls tail sensitivity—higher values (1.5-2.0) increase the weighting of extreme events in the calculation, making the model more conservative during potentially turbulent conditions.
Indicator Components
1. EVAR Risk Visualization
Dynamic EVAR Plot: Color-coded from red to green normalized risk measurement (0-1)
Risk Thresholds: Reference lines at 0.3, 0.5, and 0.7 delineating risk zones
2. Position Sizing Matrix
Risk Assessment: Current risk level and raw EVAR value
Position Recommendations: Percentage allocation, dollar value, and quantity
Stop Parameters: Mathematically derived stop price with percentage distance
Drawdown Projection: Maximum theoretical loss if stop is triggered
Interpretation and Application
The normalized EVAR reading provides a probabilistic risk assessment:
< 0.3: Low risk environment with minimal tail concerns
0.3-0.5: Moderate risk with standard tail behavior
0.5-0.7: Elevated risk with increased probability of significant moves
> 0.7: High risk environment with substantial tail risk present
Position sizing is automatically calculated using an inverse relationship to EVAR, contracting during high-risk periods and expanding during low-risk conditions. This is a counter-cyclical approach that ensures consistent risk exposure across varying market regimes, especially when the market is hyped or overheated.
Parameter Optimization
For optimal risk assessment across market conditions:
Lookback Period: Determines the historical window for risk calculation
Q Parameter: Controls tail sensitivity (higher values increase conservatism)
Confidence Level: Sets the statistical threshold for risk assessment
For cryptocurrencies and highly volatile instruments, a q-parameter between 1.5-2.0 typically provides the most accurate risk assessment because it helps capturing the fat-tailed behavior characteristic of these markets. You can also increase the q-parameter for more conservative approaches.
Practical Applications
Adaptive Risk Management: Quantify and respond to changing tail risk conditions
Volatility-Normalized Positioning: Maintain consistent exposure across market regimes
Black Swan Detection: Early identification of potential extreme market conditions
Portfolio Construction: Apply consistent risk-based sizing across diverse instruments
This indicator is my own approach to entropy-based risk measures as an alterative to volatility and standard deviations and it helps with fat-tailed markets.
Enjoy!

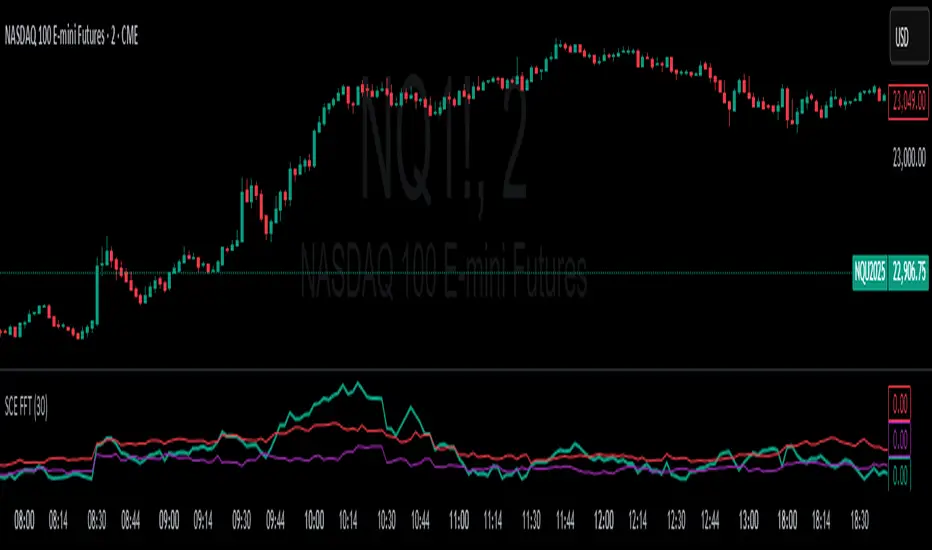
Fast Fourier Transform [ScorsoneEnterprises]The SCE Fast Fourier Transform (FFT) is a tool designed to analyze periodicities and cyclical structures embedded in price. This is a Fourier analysis to transform price data from the time domain into the frequency domain, showing the rhythmic behaviors that are otherwise invisible on standard charts.
Instead of merely observing raw prices, this implementation applies the FFT on the logarithmic returns of the asset:
Log Return(𝑚) = log(close / close )
This ensures stationarity and stabilizes variance, making the analysis statistically robust and less influenced by trends or large price swings.
For a user-defined lookback window 𝑁:
Each frequency component 𝑘 is computed by summing real and imaginary projections of log-returns multiplied by complex exponential functions:
𝑒^−𝑖𝜃 = cos(𝜃)−𝑖sin(𝜃)
where:
θ = 2πkm / N
he result is the magnitude spectrum, calculated as:
Magnitude(𝑘) = sqrt(Real_Sum(𝑘)^2 + Imag_Sum(𝑘)^2)
This spectrum represents the strength of oscillations at each frequency over the lookback period, helping traders identify dominant cycles.
Visual Analysis & Interpretation
To give traders context for the FFT spectrum’s values, this script calculates:
25th Percentile (Purple Line)
Represents relatively low cyclical intensity.
Values below this threshold may signal quiet, noisy, or trendless periods.
75th Percentile (Red Line)
Represents heightened cyclical dominance.
Values above this threshold may indicate significant periodic activity and potential trend formation or rhythm in price action.
The FFT magnitude of the lowest frequency component (index 0) is plotted directly on the chart in teal. Observing how this signal fluctuates relative to its percentile bands provides a dynamic measure of cyclical market activity.
Chart examples
In this NYSE:CL chart, we see the regime of the price accurately described in the spectral analysis. We see the price above the 75th percentile continue to trend higher until it breaks back below.
In long trending markets like NYSE:PL has been, it can give a very good explanation of the strength. There was confidence to not switch regimes as we never crossed below the 75th percentile early in the move.
The script is also usable on the lower timeframes. There is no difference in the usability from the different timeframes.
Script Parameters
Lookback Value (N)
Default: 30
Defines how many bars of data to analyze. Larger N captures longer-term cycles but may smooth out shorter-term oscillations.
minchang volume tradingCondition
Point color
Volume ≥ 3× MA(24)
Violet
Volume ≥ 1.5× MA(24)
Red
Volume < 1.5× MA(24) & bullish
White
Volume < 1.5× MA(24) & bearish
Black

Gabriel's Relative Strength IndexGabriel’s RSI—The Reinvention of Relative Strength
Not your average RSI.
This is a fully reengineered Relative Strength Index that merges the power of advanced signal processing, adaptive smoothing, volume dynamics, and intelligent divergence detection into a single, modular toolkit designed for precision trading across all markets.
Whether you’re scalping crypto, swing trading equities, or dissecting futures contracts—Gabriel’s RSI adapts to your strategy with unrivaled control and clarity.
1. RSI Settings
RSI Length (Jurik): Set to 51 by default to mimic a 21-period standard RSI when Jurik smoothing is applied. Adjust lower (e.g., 22) to mimic a 9-period RSI.
RSI Source: The default is hlc3 for smoother RSI inputs. Can be changed to any price-based series (close, open, etc.) for customization.
2. RSI Smoothing Options
MA Type: Smoothing applies to both RSI and its MA overlay simultaneously. I used to use the 56 EMA RSI, and it works well too.
JMA: Best for adaptive recursive smoothing. A power of 2 and a phase of 50 are used.
T3: Smooth and lag-reduced, suitable for trend detection. The alpha is 0.7.
SMA + Bollinger Bands: Adds deviation-based envelopes for volatility spotting.
MA Length: Affects how smooth or reactive the RSI signal is.
BB StdDev: Only relevant if BBs are used. Controls bandwidth for overbought/oversold zones.
3. MACD Settings
Fast/Slow Length: Defaults (21/81) optimized for smoother MACD with SMA or T3. For Algo trading, EMA/JMA is best.
Signal Length: Shorter (e.g., 2) gives more reactive crossover signals, it can be increased.
Source: Default is close. Close works best for the settings I input.
MA Types: JMA and EMA reduce noise and increase signal generation. Select SMA for simplicity or T3 for trend-following.
Histogram: Bar colors signal strength and trend of MACD directly on your chart.
4. Directional Movement Index (DMI)
ADX Smoothing: High values (e.g., 100) offer strong trend confirmation with Hann Window smoothing.
DI Length: Affects DI+/- sensitivity. 100 ADX - 12 DI or 15 ADX - 35 DI are suggested, the latter for quicker boot time, as 100 bars is quite long.
Smoothing Type: Choose Hann Window for refined smoothing; RMA (SMMA) for simplicity.
Volatility Type: ATR includes gaps; ADR is useful for gapless strategies.
Plotted as area fills, 0 to 100 scaled.
5. Volume Z-Score
%R Length: Normalizes volume to percentile range (73 swing, 112 exhaustion).
Z-Score Lengths: Compares short-term and long-term volume trends with Z-scores of volume.
Fast Z-Score < Slow Z-Score = Gives a Volume Squeeze.
Fast MA > Slow MA = Bullish Volume Divergence; volume has been fired. Not via Z-score, but instead via SMA, ALMA, and RMA of volume.
WPR Volume: Weighted %R used to highlight exhaustion/pivot points.
Plot volume bars after a volume squeeze has been fired; if bars aren't plotted, then it's under squeeze. Backtest on ES1! Prove it's good for catching bottoms below 15 minutes as well.
6. Divergence Engine
Pivot Settings: Pivot Period (12), Divergence minval Lookback (5), and max Lookback Bars (100) control sensitivity. Works well on any asset class; these are the optimal settings for the RSI.
Source Options: RSI, MACD, ADX, DI difference, or Volume %R.
Divergence Type:
Regular: Classic reversal signals.
Hidden: Continuation signals.
Heikin Ashi Mode: Enables use of HA candles on normal charts for smoother pivots. May distort values if your chart is H.A. so leave it unchecked then.
7. Squeeze Momentum (SQZMOM)
Squeeze Types:
Wide (Black): Regular compression
Normal (Red), Regular Squeeze
Narrow (Yellow), Golden Squeeze
Very Narrow (Purple) Extreme compression
Fired (Green): Breakout detected
Plotted as circles on the bottom of my indicator.
Momentum Bar Colors:
Cyan: Rising momentum
Blue: Pullback within uptrend
Red: Falling momentum
Yellow: Correction within downtrend
Reversal Lines: Dashed lines indicate momentum crossing its Jurik MA (DM-Style Pivots).
Plotted as squares on the top of my indicator.
8. Rate of Change (RoC)
RoC of Momentum: EMA-smoothed RoC on momentum for leading signals. Double smoothed, once and then another time for smoother signals.
Signal Line: JMA used to filter noise and generate reversal signals.
Crossovers: Bullish/bearish signals based on RoC vs signal line are plotted as triangles directly on your chart.
Optimized: Backtested for short-term setups like 1H or faster. Works on Daily timeframes as well for Futures.
9. Multi-Timeframe Squeeze Settings
Each timeframe (Hourly, 4H, Daily, Weekly, Monthly) has:
Reversal Toggle: Enables dashed line DM-Style Pivots on crossovers.
MA Length: For Jurik MA smoothing on momentum.
BB/KC Thresholds: Define squeeze sensitivity per timeframe. A shorter BB/KC length, 17-14-12, responds better on lower timeframes.
Momentum Length: Tailors oscillator responsiveness; 20 is ideal.
10. BB Std. Deviation Scaling
Low-Pass Super Smoother : Smooths (True Range) noise for BBs.
High-Pass Butterworth : Extracts cycles for BB Stdv. blend.
Root Mean Squared : Dynamic BB width adjustment based on market activity.
11. Alerts
RSI: Overbought/oversold reversals. Several types.
MACD: Histogram shift through zero line.
DMI/ADX: Crossovers and strength conditions. The 17 key level is used for the ADX.
Volume: Smart Money alerts on low-volume zones. May concentrate on ICT sessions.
Squeeze: Alerts on all 5 squeeze states.
Momentum: Crosses and reversals.
RoC: Bullish and bearish crosses.
Divergences: Regular, hidden, combined.
12. Visual Output Summary
RSI Line + MA/BBs
MACD Histogram Bar Colors
DMI/ADX as area fills
Volume %R columns
Squeeze Momentum Shapes and Dots
RoC Crossover Arrows
DM-style Breakout Pivots
Divergence Lines and Labels
Best Practices
Watch the slope of the RSI for pullbacks on a strong trend. Combine it with squeeze for exit timing.
Combine RSI Divergence with MACD histogram cross and Squeeze firing for precise entry.
Use Volume Z-Score to filter for institutional activity, and enter Long. Watch for reversals as well.
Watch RoC crossovers for fast, leading signals.
Enable Reversal Lines on 1H+ charts for breakout or breakdown pivots.
Use multi-timeframe thresholds for swing confirmation. The TFs I use the most are 2-5-15 minutes for futures and swinging with 1 hour daily and weekly. Those are the TFs I backtested.

Institutional Momentum Scanner [IMS]Institutional Momentum Scanner - Professional Momentum Detection System
Hunt explosive price movements like the professionals. IMS identifies maximum momentum displacement within 10-bar windows, revealing where institutional money commits to directional moves.
KEY FEATURES:
▪ Scans for strongest momentum in rolling 10-bar windows (institutional accumulation period)
▪ Adaptive filtering reduces false signals using efficiency ratio technology
▪ Three clear states: LONG (green), SHORT (red), WAIT (gray)
▪ Dynamic volatility-adjusted thresholds (8% ATR-scaled)
▪ Visual momentum flow with glow effects for signal strength
BASED ON:
- Pocket Pivot concept (O'Neil/Morales) applied to price momentum
- Adaptive Moving Average principles (Kaufman KAMA)
- Market Wizards momentum philosophy
- Institutional order flow patterns (5-day verification window)
HOW IT WORKS:
The scanner finds the maximum price displacement in each 10-bar window - where the market showed its hand. An adaptive filter (5-bar regression) separates real moves from noise. When momentum exceeds the volatility-adjusted threshold, states change.
IDEAL FOR:
- Momentum traders seeking explosive moves
- Swing traders (especially 4H timeframe)
- Position traders wanting institutional footprints
- Anyone tired of false breakout signals
Default parameters (10,5) optimized for 4H charts but adaptable to any timeframe. Remember: The market rewards patience and punishes heroes. Wait for clear signals.
"The market is honest. Are you?"

Altcoin Liquidity Flow Score - Big Moves Only//@version=6
indicator("Altcoin Liquidity Flow Score - Big Moves Only", overlay=false)
// Pull weekly macro data
walcl = request.security("FRED:WALCL", "W", close)
rrp = request.security("FRED:RRPONTSYD", "W", close)
tga = request.security("FRED:WDTGAL", "W", close)
hyg = request.security("AMEX:HYG", "W", close)
total3 = request.security("CRYPTOCAP:TOTAL3", "W", close)
usdt_d = request.security("CRYPTOCAP:USDT.D", "W", close)
// Calculate week-over-week change
delta_liquidity = ta.change(walcl + rrp - tga)
delta_rrp = ta.change(rrp)
delta_hyg = ta.change(hyg)
delta_total3 = ta.change(total3)
delta_usdt_d = ta.change(usdt_d)
// Compute raw score
raw_score = delta_liquidity - delta_rrp + delta_hyg + delta_total3 - delta_usdt_d
// Apply 3-week smoothing
score = ta.ema(raw_score, 3)
// Define threshold for major liquidity shift
threshold = 2.0
// Plot score + background for only strong signals
plot(score, title="Liquidity Flow Score (Smoothed)", color=color.teal, linewidth=2)
hline(0, "Zero Line", color=color.gray)
bgcolor(score > threshold ? color.new(color.green, 85) : score < -threshold ? color.new(color.red, 85) : na)
