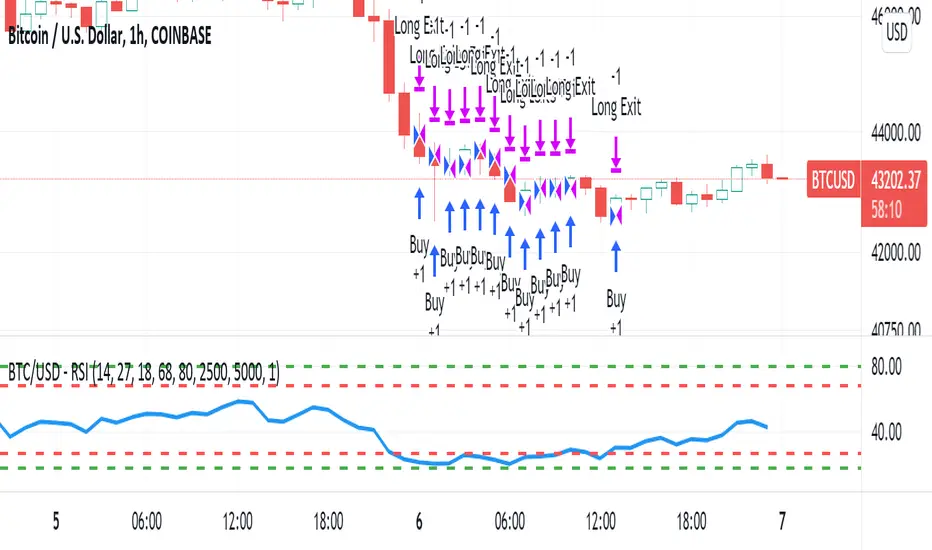
BTC/USD - RSIIF RSI (14) reaches 68 ... sell 1 lot size ( with TP 250 points and SL 500 points)
IF RSI (14) reaches 27 ... buy 1 lot size ( with TP 250points and SL 500 points)
IF RSI (14) reaches 80 ... sell 1 lot size ( with TP 250 points and SL 500 points)
IF RSI (14) reaches 18 ... buy 1 lot size ( with TP 250points and SL 500 points)
Osilatörler
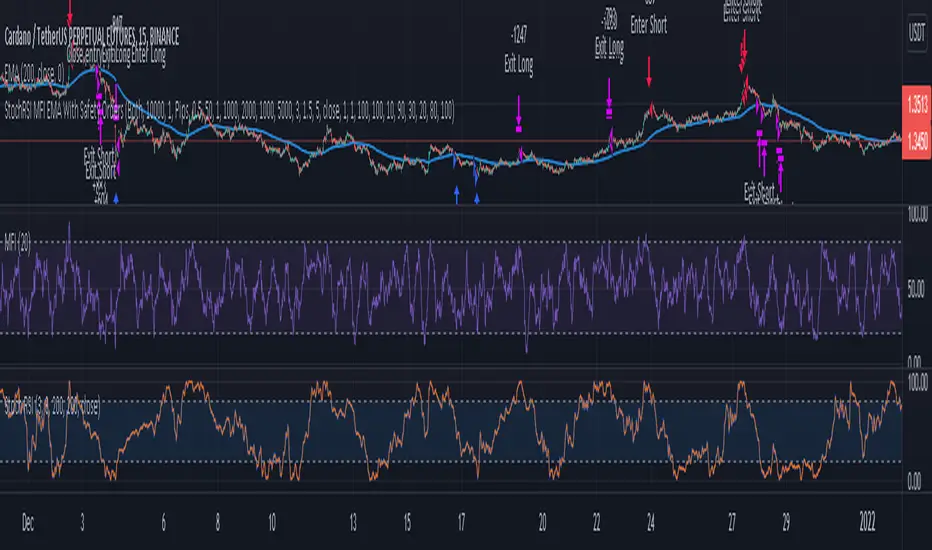
3 Indicator Strategy (StochRSI, MFI & EMA) With Safety OrdersThis strategy uses Stochastic RSI, Money Flow Index and EMA with settings for lower time-frames.
It also features safety orders based on 3 different take profit and stop loss methods.
Recommended Indicator Settings for lower time-frames;
Stoch RSI: 1,1,100,100
MFI: 30
EMA: 100
Take Profit/Stop Loss Settings:
There are 3 TP/SL types available;
- Pips -> based on minticks
- Base Value -> manually entering a value for the actual profit/loss.
- Opposite Signal -> e.g. if the current open order is long, strategy waits for the next short signal.
TFO + ATR Strategy with Trailing Stop LossThis strategy is an experiment to learn what happens when The Trend Flex Oscillator (by Dr. John Ehlers) is used in conjunction with a volatility indicator like ATR. It was designed with cryptocurrency trading in mind.
The way I coded this experiment makes it unsuitable for bear market conditions.
When applied to a bull market, this trend-following strategy will open long positions when oversold price action appear to be reversing. It will typically close a position within a few days unless it gets caught in a bear market, in which case it holds on for dear life. I have tried to make back-testing very simple, but you should never trust it. It's merely and interesting tool for adjusting the many parameters that I've made editable in the configuration window. Those values include the ATR and TFO parameters, as well as setting a trailing stop loss. When closing a position, the strategy can optionally be told to ignore the trend analysis and only obey the trailing stop loss value. I've made an attempt to allow the user to define the minimum profit necessary to allow the strategy to close all all positions. In my observations, the 2H candlestick charts seem to produce the best results, although the parameters of the strategy could theoretically be adjusted to suit other time periods.
In summary...
This strategy has a bias for HODL (Holds on to Losses) meaning that it provides NO STOP LOSS protection!
Also note that the default behavior is designed for up to 15 open long orders, and executes one order to close them all at once.
Opening a long position is predicated on The Trend Flex Oscillator (TFO) rising after being oversold, and ATR above a certain volatility threshold.
Closing a long is handled either by TFO showing overbought while above a certain ATR level, or the Trailing Stop Loss. Pick one or both.
If the strategy is allowed to sell before a Trailing Stop Loss is triggered, you can set a "must exceed %". Do not mistake this for a stop loss.
Short positions are not supported in this version. Back-testing should NEVER be considered an accurate representation of actual trading results.
// portions © allanster (date window code)
// portions © Dr. John Ehlers (Trend Flex Oscillator)
This code is provided for educational purposes only. The results of this strategy should not be considered investment advice.
The user of this script acknowledges that it can result in serious financial loss when used as a trading tool

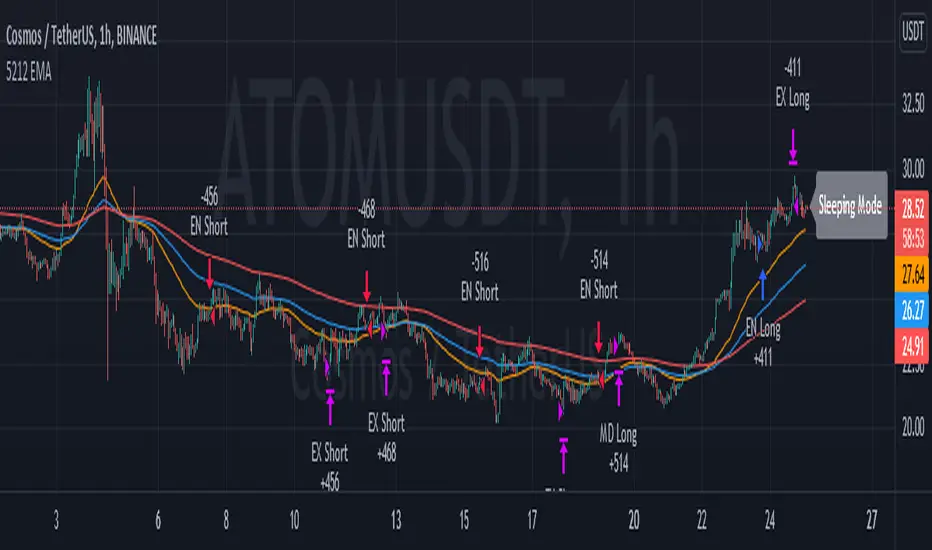
5212 EMA Strategyver 01
23 December 2021
This strategy using :
- 3 EMA period 50, 100, 200
- stochastic RSI slow
Long Cond :
- Stochastic RSI cross below 20
- EMA 50 > 100 > 200
Short Cond :
- Stochastic RSI cross above 80
- EMA 50 < 100 < 200
Sleeping Mode
- EMA 50 between EMA 100 & EMA 200
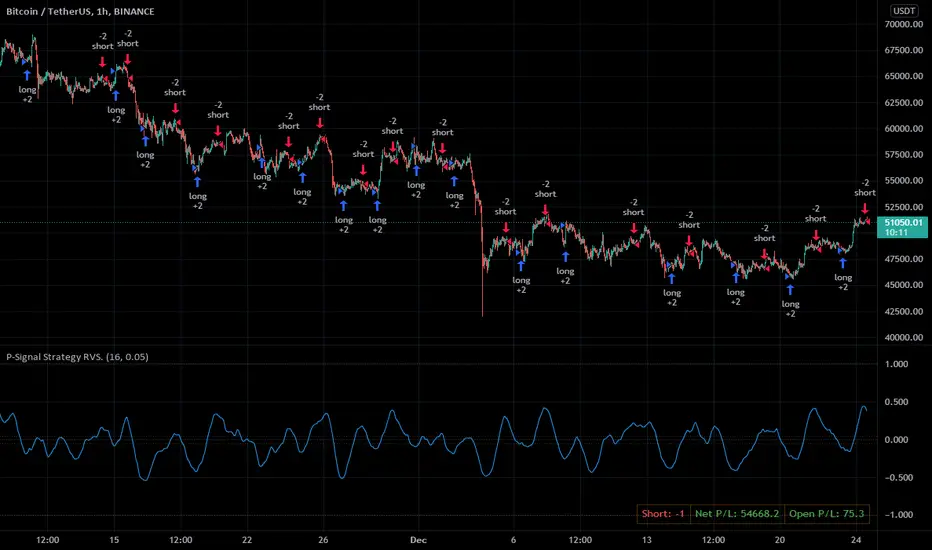
P-Signal Strategy RVS.For Christmas and New Year,
for P-Signal users - the PINE code of a reverse (trigger) strategy!
Strategy parameters.
==================
1. Cardinality – the number of points (from 4 to 200) that make up a set of elementary events (bar). This is the main parameter that determines success.
2. |ΔErf| - a size of the Δ region (from 0 to 1) of the error integral near zero. Helps save on commissions.
3. Observation time – the deputy speaks for himself.
NB: In the strategy, process_orders_on_close = true, order executes after a bar closes and strategy calculations are completed. Also Barstate.isconfirmed, i.e. the script is calculating the last (closing) update of the current bar.
Usage advice.
============
Set your exchange commission (0.2% by default). Start your search by increasing the parameter Cardinality. If in the Performance Summary two parameters Net Profit and Commission Paid are of the same sign and order, you are in luck, you have found a suitable probabilistic space. Further, you can reduce the losses from the commission using the parameter |ΔErf|.
Do not forget to publish the idea, for example: P-Signal Strategy RVS: BTCUSDT 1h (16, 0.05).
Note.
=====
P-signal is theoretical. It works in a probabilistic space endowed with energy (entropy).
EMA Cross + Divergence strategy (Div. signals by The Divergent)A sample strategy demonstrating the usage of The Divergent divergence indicator and The Divergent Library .
The Divergent is an advanced divergence indicator which you can easily incorporate into your own strategies.
In order to use this strategy (and to use the signals in your own strategy), you need to have the Pro version of The Divergent applied to your chart.
For more information, please see the comments inlined in the code.

Up & Down Trend Trading Strategy - BNB/USDT 15minThis strategy will focus on up trend trading and down trend trading based on several indicators such as;
for up trend
1. SAR indicator
2. Super trend indicator
3. Simple moving average for the period of 100
down trend
1. RSI Indicator
2. Money flow index
3. Relative volatility index
4. Balance of powder

3RSI 3CCI BB 5orders DCA strategy+This strategy is just an attempt to find the indicator values for the trading bot service that I use (link in profile). Due to the use of the “request.security” function in the code, the indicators can be redrawn, but this is not important in history. The strategy used only 5 orders for the "DCA" - bot, located at the same distance in the price overlap range. I only use this strategy when trading in pairs against bitcoin.
Эта стратегия – просто попытка подобрать значения индикаторов для сервиса торговых ботов, который я использую (ссылка в профиле). Из-за использования в коде функции «request.security» возможна перерисовка индикаторов, но на истории это не важно. В стратегии использовано всего 5 ордеров для «DCA» - бота, находящихся на одинаковом расстоянии в диапазоне перекрытия цены. Я использую данную стратегию только при торговле в парах к биткоину.

Zendog V3 backtest DCA bot 3commasMAJOR UPDATE:
- Update to Pinescript v5
- MAJOR refactor for the logic of how orders are placed. BO order is placed when the condition is first encountered and we are not in a deal.
The extra SO orders (if based on price movement) are all placed on the next candle after BO order, instead of each being placed one after another.
Take profit (if percentage) and Stop loss are placed on the first candle after BO order because if BO and TP are on the same candle TV does not execute properly.
These changes should improve strategy accuracy when multiple prices are hit by the same candle.
- NEW FEATURE: Support to Stop deal using an external indicator (i.e. stop long deal when RSI > 80)
- NEW FEATURE: Support to trigger Safety orders using an external indicator (i.e. trigger each additional SO when RSI < 10, regardless of price movement)
The price movement logic may be implemented in the indicator that plots start / end signals. The SO size is calculated using the configuration of steps.
- NEW FEATURE: Safety order command for 3commas bot. This is implemented using Add funds in the quote currency (for pair BTCUSDT the quote currency is USDT)
The SO size is calculated using the configuration of steps, for exact order size (and price) use the built-in Steps table.
- NEW FEATURE: Addition of extra columns to the steps table: Required price for TP, Required % change for TP, Required % change for BEP (Breakeven point)
- Update to steps table to remove prices when Safety orders are not based on % price change
- The code is opensource. I will not be able to sustain merges for the script, but feel free to use and develop your own version and ping me on discord to review them
and maybe include in the original script

Contrarian Scalping Counter Trend Bb Envelope Adx and StochasticContrarian Scalping is an trading strategy designed to take advanted of a counter-trend.
The advantage of these strrategies types is that they have a good profitability but with do not great gain (in relation at the time frame).
Indicators used:
Bollinger
Envelope
ADX
Stochastic
Rules for entry
For short: close of the price is above upper band from bb and envelope, adx is below 30 and stochastic is above 50
For long: close of the price is below lower band from bb and envelope, adx is below 30 and stochastic is below 50
Rules for exit
For short: either close of the candle is below lower band of bb or enveloper or stochastic is below 50
For long: either close o the candle is above upper band of bb or envelope or stochastic is above 50
If there are any questions let me know !

RSI Average Swing BotThis is a modified RSI version using as a source a big length(50 candles) and an average of all types of sources for candle calculations such as ohlc4, close, high, open, hlc3 and hl2.
In this case we are going to use a 0-1 scale for an easier calculation, where 0.5 is going to be our middle point.
Above 0.5 we consider a bullish possibility.
Below 0.5 we consider a bearish possibility.
I made a small example bot using that initial logic, together with 2 exit points for long or short positions.
If there are any questions, let me know !

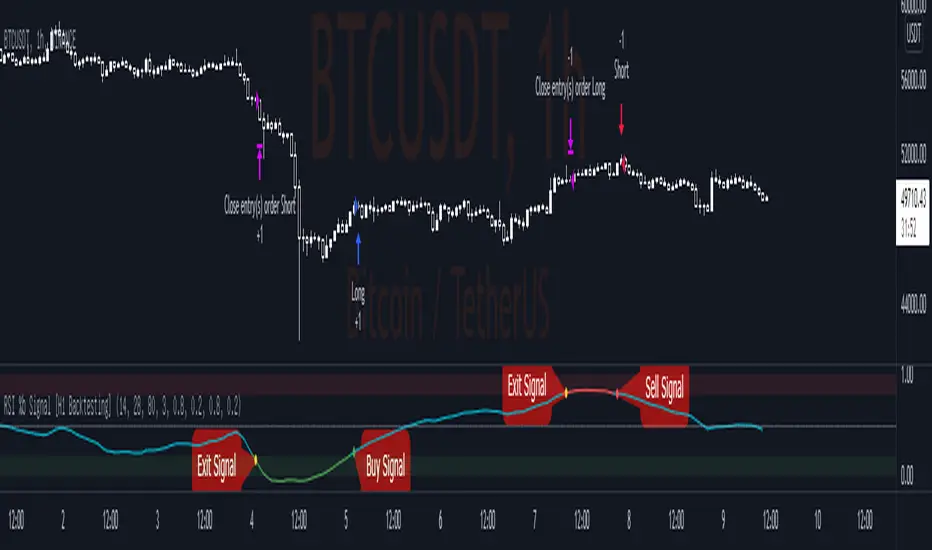
RSI %b Signal [H1 Backtesting]-----------------------------------------------------------------
This simple strategy base on RSI, EMA, Bollinger Bands to get Buy and Sell Signal with detail as below:
-----------------------------------------------------------------
1.Define Oscillator Line
+ Oscillator Line is smoothed by ema(28) of RSI(14) on H1 Timeframe
2.Define Overbought and Oversold
+ Apply Bollinger Bands BB(80,3) on Oscillator Line and calculate %b
+ Overbought Zone marked above level 0.8
+ Oversold Zone marked below level 0.2
3.Buy Signal
+ Entry Long Position when %b crossover Point of Entry Long
+ Deafault Point of Entry Long is 0.2
+ Buy signal marked by Green dot
4.Sell Signal
+ Entry Short Position when %b crossunder Point of Entry Short
+ Deafault Point of Entry Short is 0.8
+ Sell signal marked by Red dot
5.Exit Signal
+ Exit Position (both Long and Short) when %b go into Overbought Zone or Oversold Zone
+ Exit signal marked by Yellow dot
-----------------------------------------------------------------
Joint Conditions Strategy Suite + TradingConnector alerts bot"Please give us combined alerts with the possibility of having several conditions in place to trigger the alert." - was the top voted request from users under one of the recent blogposts by TradingView.
Ask and you shall receive ;)
TradingView is a great platform, with unmatched set of functionalities, yet this particular combo of features indeed seems not to be in place. Fortunately, TradingView is also very open platform, thanks to PineScript coding language, which enables developing combos like the requried one and plenty of other magic.
I have already published numerous "educational" scripts, showing how to code indicators and alerts with PineScript, but... this is not one of them. This one is for real. READY FOR USE on real markets, also by the non-coding traders. Just take my script, set parameters with dropdowns, backtest the strategy, fire the alerts and execute them.
HOW TO USE IT
In "Settings" popup I tried to mimic the CreateAlert popup dropdowns for selecting logic. Let's say you want to enter Long position at Stochastic KxD crossover. In first line of Long Entry conditions set "StochK" + "Crossing Up" + "StochD". Last field doesn't matter because in 3rd dropdown something else than "value" was selected. In second line you could set "maB" + "Greater Than" + "maC" to filter out those entries which are in direction of the uptrend. And yeah, add ADX>25 to make sure the market is actually moving: "ADX" + "Greater Than" + "value" + "25". All condition lines must be TRUE (or skipped) for the entry to be triggered. Toghether with an alert.
The same for Short entries. Combinations are limitless.
INDICATORS AND MTF (MULTI-TIMEFRAME)
In those dropdowns you can select candle values like open/close/high/low/ohlc4, but also some most popular indicators, which I have pre-built into this script: RSI, various Moving Averages, ADX-DMI, Stochastic and Bollinger Bands for start. You can configure parameters of those indicators also in "Settings" popup, in "Indicator Definitions" section. What's important, you can use any of these indicators from higher timeframe, setting MTF multiplier. So if you applied this indicator to 1h chart, but want to use rsi(close,14) from 4h chart, set MTF to 4. If you want to use current timeframe indicators, keep MTF at 1, which is a default setting here.
Note for coders: to keep focus of this script on joining conditions, entire logic for those indicators has been moved to external library, also open source. I encourage you to dig into the code and see how it's done. I love the addition of libraries concept in PineScript.
CUSTOM INDICATOR
Following the "openness" spirit of my master - which is TradingView itself - my work is also open, in 2 ways:
1. This script is open source. So you can grab it, modify or add any functionalities you want. I cannot and don't want to stop you from doing that. I'm asking for only one favor - please mention this source script in your credits.
2. You can import the plot (series) from any other indicator on TradingView. In Settings popup of my script, scroll down to "Indicator Definitions" section, and select the series of your choice in the first dropdown. Now it is ready to use in conditions dropdowns on top of the Settings popup.
Let me give you an example of that last scenario. Take another script of mine, "Pivot Points on SR lines DEMO". You can find it in "Indicators & Strategies" library or here: (). Attach it to your chart. Now come back to THIS script, open Settings popup and in "Custom Indicator aka Imported Source" select "Pivot Points on SR lines: ...". The way it works - it detects if a pivot point happened on Support/Resistance line from the past and returns 1 for PivotLow and -1 for Pivot High. Now in first Long Entry condition set: "custom indicator" + "Greater Than" + "value" + "0" and long entries will be marked on every pivot low noticed on Support/Resistance line.
ALERTS
Last but not least - the alerts. This script produces alerts on the entries calculated by strategy logic, as marked on the chart by the backtester. Moreover, syntax of those alerts is already prepared and fully compatible with TradingConnector - alerts executing tool (bot), if you want to auto-execute those trades. Apart from installing the tool, you need to set
up the alerts in TradingView, here is how:
open CreateAlert popup
in first dropdown select "Joint Conditions Strategy Template"
in second dropdown select "alert() function calls only"
And that's all. You only need to set one alert for the whole script, not one for Longs and one for Shorts as it was in the past. Also, you don't need to setup closing alerts, because stop-loss/take-profit/trailing-stop information is embedded in the entry alert so your broker receives it as early as possible. Alerts sent will look like this: "long sl=40 tp=80", which is exactly what TradingConnector expects.
Phew, that's all folks. If you think I should add something to this template (maybe other indicators?) please let me know in comments or via DM. Happy trading!
P.S. Pyramiding is not supported in this script.
Disclaimer : I'm not saying above combination of conditions will make you money. Actually none of this can be considered financial advice. It is only a software tool. Use it wisely, be aware of the risk and do your own research!

robotrading ZeroCCIIt was not me who authored the strategy. I do not know who the real author of this strategy is. I read about it on wikipedia :) And decided to test the strategy on the cryptocurrency market. It turned out that this strategy really works. The strategy is very simple.
Indicator
CCI indicator with default settings is used. The settings can be changed. Nothing else is used.
Strategy
If CCI is more than 0, then open a long position (and close a short position).
If CCI is less than 0, then open a short position (and close a long position).
Reverse trading.

MZ SRSI Strategy V1.0Strategy Introduction
This strategy starts from selection of 1st Moving Average from one of following:
SMA
EMA
DEMA
TEMA
LRC
WMA
MF
VAMA
TMA
HMA
JMA
Kijun v2
EDSMA
McGinley
Then it calculates the RSI of selected 1st Moving Average
In the end it calculates Moving Average of previously calculated RSI and for this purpose 2nd Moving Average is also selected from above list.
Cross of RSI and its Moving Average generates Strategy Alerts
Only long trades are enabled currently
Default Settings
I've set the default selection to the perfect options for 1D and 4h timeframes. You can modify both MAs selection and their length according to your selected timeframe.
Following default settings are used:
Heiken Ashi Candles are selected by default as source
1st Moving Average selection is set to LRC (Linear Regression Curve)
Length of 1st Moving Average is set to 50
RSI length is set to 2 because it is supposed to be fast
2nd Moving Average of RSI is set to TMA (Triangular Moving Average)
Length of 1st Moving Average is set to 5
Start date is set to 2011
Backtesting can also be done selecting %age of equity
Suggestions for Usage
Mostly winning trades have no prominent drawdown so losing trades can be abolished with Stoploss. Would soon add Stoploss, MTF and Takeprofit options in next version. Also if you want an alerts version of it then just comment below and would publish it later. I’ve found this strategy useful on 1D and 4h timeframes with described default settings.

Linear trendSimple way how to use Linear Regression for trading.
What we use:
• Linear Regression
• EMA 200 as a trend filter
Logic:
Firstly we make two different linear regression movings as oscillator. For this we need to subtract slow moving from fast moving, so we get the single moving around zero. This is the green/red line which appears on the chart.
The trade open when LR cross over the threshold. The trade close when LR cross under the threshold below. Crossing over the threshold is the same as faster moving cross over slower moving.
Also we use EMA as a filter. The trades would be only when the price is over than EMA 200.

P-Signal Strategy & AlertThanks to your advices I removed in this version something that was not necessary for the strategy but added alert and the chart of the current state of the strategy (white 1 - in trade, 0 - out of trade).

DMI (Multi timeframe) DI Strategy [KL]Directional Movement Index Strategy
Entry conditions:
- (a) when DI+ > DI- on timeframe #1, and
- (b) Confirmation: when DI+ > DI- on timeframe #2
In the shown example, timeframe1 was same as the chart (1H) and timeframe2 was 1D.
Stop Loss: ATR based trailing stop
About DMI
Can refer to Investopedia for general understanding.
Applications of DMI in this strategy:
- Assumes uptrend when DI+ is above DI- (when green DI+ lines above red DI-), vice versa for downtrend. This is checked in two different timeframes that can be set by user in settings.
- DX is ignored, it doesn't give a direction of the trend. But if DX was applied, it would be a good indicator for quantifying the strength of uptrend/downtrend. This measurement would typically be read along a threshold (i.e. if below 20, then market is likely consolidating). All of these have been commented out (ignored by pinescript's interpreter via //) in the codes, as said; we are not using DX for sake of simplicity.
Visualizations
To make the chart look cleaner, DMI plots have been simplified to just down/up arrows placed at bottom of the chart.
Referring to the example chart:
- Green arrows : when DI+ > DI- for both timeframes, implies uptrend
- Red arrows: other way around (DI+ < DI-), implies downtrend

P-Signal Strategy (BTCUSD Multi Frame)This is an example of constructing P-Signal strategy on a set of probability spaces. In this case, the daily weekly and monthly time frames are used. Please note that the parameters for each of the spaces (the number of bars in the gear) are different.

Instrument-Z (3Commas Bot)Instrument-Z is what I am currently using as my 3Commas Bot.
It allows you to customize signals from 3 indicators; Crossing MA's, Stochastic RSI, and WaveTrend.
Better yet, it allows you to setup these signals separately depending on whether the Trend MA is going up or down.
So there are 2 sets of inputs for everything, Uptrend inputs and Downtrend inputs.
I have realized that we can't expect a strategy to work the same way in an uptrend vs downtrend, so the inputs should be separated too.
In my testing, separating increased the net profit by 60% on average.
You can select whether you are trading Long or Short.
You can choose your stop loss and take profit levels as well as trade expiration.
You can choose if you only want to trade with the trend (making the opposing signals irrelevant).
The trend is based on the Trend MA.
This script is specifically for cryptocurrencies.
I've noticed that MA crosses on other asset classes are unreliable because the fluctuations are not strong enough to push the MA's across each other in a meaningful way.
If you want to use this as a 3Commas Bot, then you will have to copy the code of the strategy and paste it into your own personal script.
Then you have to change the alert messages at the bottom of the script.
Make sure to change your alert message from this;
{"message_type": "bot", "bot_id": 0000000, "email_token": "0b000a0a-0aa0-00aa-0aa0-000a00000a0a", "delay_seconds": 0}
To this;
{ \"message_type\": \"bot\", \"bot_id\": 0000000, \"email_token\": \"0a000a0a-0aa0-00aa-0aa0-000a00000a0a\", \"delay_seconds\": 0 }
With after each new line and \ before each quotation.
In the Alert setup, select "alert() function calls only".
This indicator is like a middle ground of complexity between the Juicy Trend indicator and the Instrument-A indicator.
And because it does not feature my neural network project, I have made it open script.
Enjoy!

Bollinger Band Breakout Positional Strategy- BN -15M This strategy consists of following criteria:
Buy:
1. Candle should have RSI is above 60 and Close above Bollinger band upper limit
2. Exit When candle is closed below 20MA
Sell:
1. Candle should have RSI is above 40 and Close below Bollinger band lower limit
2. Exit When candle is closed above 20MA
Checkout results.

P-Signal StrategyThis is an example of building a trading strategy based on a p-signal. The p-signal indicates the entropy of the state of the D frame system for the BTCUSD pair in the Kolmogorov probability space.
