RSI+OBVthis strategy works on the basis of crossovers of RSI at different period and OBV at different periods (separately). I am using it for Nifty and Bank Nifty. Entry for long can be taken when green bar appears; and exit has to be done when it disappears. Entry for short has to be taken when red bar appears; and exit has to be done when it disappears.
With little help from price action good results can be achieved.
Denge İşlem Hacmi (OBV)

Moving Average Convergence Divergence On Alter OBVOBV:
The OBV is perfect indicator to understand the strength of the particular stock. As the strength increase, the trend of the stock goes high along with price. But, the OBV is considered only with close of previous close which is to make sure the double confirmation on the price to accumulate the volume.
Altered OBV:
So, here is the altered OBV, which basically consider the close of previous close and also buying interested of the day when close is higher than open.
MACD:
I always admire the magic of MACD with pre-defined timeframe. Now, this MACD applied on top of altered OBV to signal us the moving of the ticker strength.
I hope the another MACDAltOBV would help on your swing trading strategy.
Happy Investing.

On Balance Volume DeviationThe objective of this indicator is to be a leading indicator that can detect a large price change before it happens. It is based on the On Balance Volume (OBV) indicator, which is a leading indicator based on the premise that a large change in volume often precedes a large price change. This indicator charts the N-Period deviation of the OBV data and displays it as a histogram. This is overlayed on an area chart of the M-Period SMA of the histogram data. This combination helps to visually enhance the pattern that signifies that a jump in price is about to happen.
Useage:
When the histogram bars are above the area plot, then a jump in price is about to happen
As with all leading indicators, there are a lot of false signals. Confirm with price action or another indicator
The further the histogram bars are above the area plot, the larger the predicted jump in price
It seems to work better on shorter intraday timeframes than on the longer timeframes
At the close of a market session, it is a good indicator of how much the price will jump on the opening of the next market session.

OBV ScalingOBV Scaling Indicator
Objective - Use for executed order
Description - OBV Scaling is the introduction of obv to scaling it into 1 Standard deviation. Since the obv scaling in general has a wide distribution of data, we need to scaling the data to reduce fragmentation.
Applications - The principle of OBV Scaling is to use it as an executed order when the value of the OBV scaling crosses EMA of OBV Scaling.
Recommendation - OBV Scaling should be used in conjunction with indicators used to filter trend. for example Supertrend, Parabolic Sar

OBV CSI [mado]This Indicator shows you the strength of the Currency based OBV RSI.
If the Currency label is on the top, it is strong, if it is on the bottom, it is weak
use sample image
I use 1 chart just for OBV CSI :)

Stochastic Slow and OBV Percent Oscillator
Purpose - Stochastic is the best momentum indicator and On Balance Volume (OBV) is the best volume indicator. Why not combine both to come up with a more sophisticated oscillator?
How It's Done - I had to put OBV as an oscillator (returning values between 0 and 100) in order to put it in the same pane with the slow stochastic oscillator. Otherwise, their synergy won't be that great. So, I have decided to visualize OBV as a percentage relative to selected period's high and low value. That way, I can keep the OBV value to stay within boundary.
Interpretation
1. Dot color indicates the whether the stochastic K/OBV is over or below the stochastic D/Signal line.
2. When Stoch and OBV are moving in the same direction and are close together (on top of each other), this indicates a strong trend
3. When Stoch crosses up or down the OBV oscillator, it may indicate a trend reversal

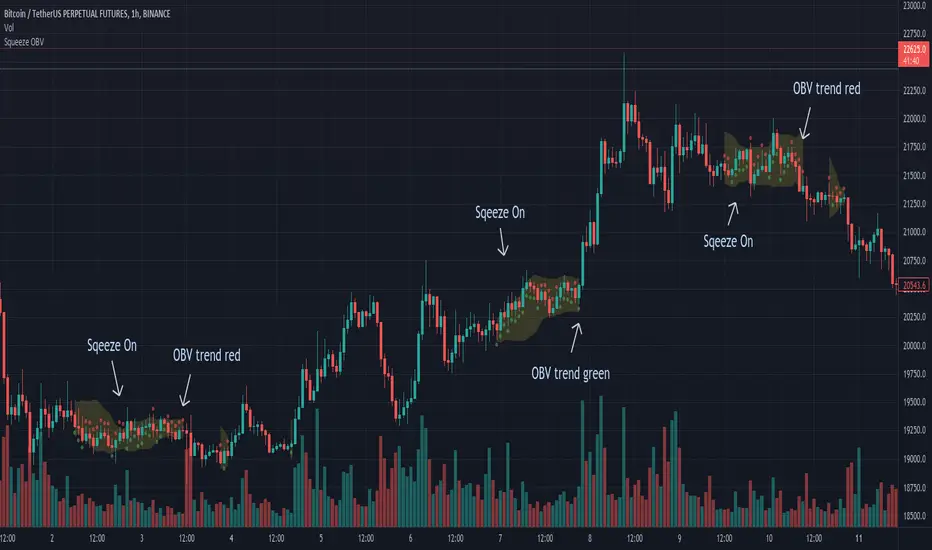
Squeeze OBVThe concept comes from "TTM Squeeze", this indicator visualizes the squeeze on the price movement.
Yellow band overlay on the candles shows that entered a squeeze on with low volatility, market preparing itself for an large move (up or down).
Dots of OBV change every bar, green means potential up, red is the opposite.
Prepare a breakout order with the direction of OBV.
If potential up, the strategy is a breakout order above the squeezed Bollinger Band and the stop loss is below the Bollinger Band.
It's a pity that it cannot write breakout order strategy in Tradingview.
My experience that use CVD instead of OBV will have better performance, but it needs the historical evolution of the order book.
----
概念來自於 "TTM Squeeze",將擠壓的過程視覺化在價格走勢上。
k線上的黃色帶覆蓋表明進入了低波動性的擠壓,市場為大幅波動(向上或向下)做準備。
OBV 的點每根bar都會變化,綠色表示可能向上,紅色則相反。
搭配 OBV 可以判斷走勢,使用突破單策略能夠有效獲利,
假設可能向上,突破單在擠壓布林帶上方,止損在布林帶下方。
可惜 Tradingview 無法寫突破單策略回測。
經驗上搭配 CVD 更有效,需要交易所訂單簿的歷史紀錄,故 Tradingview 也無法製作 CVD。
OBV with Volume/Momentum DivergenceCredits go to vyperphi696 and LazyBear for the original OBV with Divergence script.
This indicator has the new option to check for momentum divergence, which I have done by adding RSI and MACD data.
Hence the indicator allows combined testing of volume and momentum divergence. This feature aims to improve trend reversal detection by reducing false positives.
In summary, 3 divergence categories are shown by default as lines:
Volume + RSI + MACD (dark green/red)
Volume + RSI / Volume + MACD (light green/red)
Volume (gray)
Line colors can be adjusted via plot settings. Therefore it is also possible to distinguish Volume + RSI and Volume + MACD divergence if necessary.
Lastly, I edited the indicator scaling mechanism when changing from one timeframe to another; the transitions are smoother now. This only applies when auto-scaling is off.

Intrabar On Balance VolumeAn experimental modification of TradingView's built-in OBV indicator that calculates its value with intrabar data.
This leads to a more accurate OBV trace because it considers the price swings that happen within the time period of each candle, instead of only considering the candle close price.
For example: on a 4H timeframe a single candle spans 4 hours. In this indicator the OBV is calculated with 1-minute intrabar data, leading to a resolution of 240 intrabars per 4H candle (that is, it considers the volume and price swings that happened at each minute of those 4 hours).

VINA for Futures Trading Volume Imbalance Analysis 30min+Price pattern is critical for trading. So is volume analysis, but volume is so hard to read.
Introducing VINA, the Volume Imbalance Next Action indicator. VINA is similar to OBV, the key being the volume being measured. VINA is developed over many years, using ideas from PVT and Accumulation / Distribution, normalized as an oscillator, and not just adding/subtracting like OBV, instead considering the size of the move like PVT.
It's not perfect, but VINA catches almost all of the major trends. Like all indicators, VINA gets whipsawed in choppy environments. VINA has been very accurate for trading futures, so I'm presenting it here with signals shown for 30 minute or higher timeframes.
Let me know what you think.

Anchored OBVThe On Balance Volume indicator (OBV) is used in technical analysis to measure buying and selling pressure.
It is a cumulative indicator meaning that on days where price went up, that day's volume is added to the cumulative OBV total.
If price went down, then that day's volume is subtracted from the OBV total.
The OBV value is then plotted as a line for easy interpretation.
On Balance Volume is primarily used to confirm or identify overall price trends or to anticipate price movements after divergences.
If On Balance Volume crosses over or under the zero line, it adds confluence to a bull/bear bias respectively.
Anchored On Balance Volume unlike traditional OBV, resets on your specified date and/or bar (clickable).

On Balance Volume Trend© 2022, CryptoNaut1000
An extension to "On Balance Volume Momentum (OBV Momentum)".
"OBV Trend" is a trend strength indicator, that can be used to identify strong trends and also trend changes based on volume.
High positive values indicate strong volume on the buy side, high negative values indicate strong volume on the sell side.
An increasing OBV trend indicates a strengthening buy trend or a weakening sell trend,
decreasing OBV trend indicates a strengthening sell trend or weakening buy trend.
OBV trend is calculated by plotting a short vs. a long moving average and filling the difference in volume.
OBV trend metric is absolute volume.

[blackcat] L1 OBV-MFI ComboLevel 1
Background
As requested, this is a combo of OBV and MFI indicators
Function
On-balance volume (OBV) is a technical trading momentum indicator that uses volume flow to predict changes in stock price. Joseph Granville first developed the OBV metric in the 1963 book Granville's New Key to Stock Market Profits.
The Money Flow Index (MFI) is a technical oscillator that uses price and volume data for identifying overbought or oversold signals in an asset. It can also be used to spot divergences which warn of a trend change in price. The oscillator moves between 0 and 100.
The combo of them is still an oscillator.
Remarks
Feedbacks are appreciated.

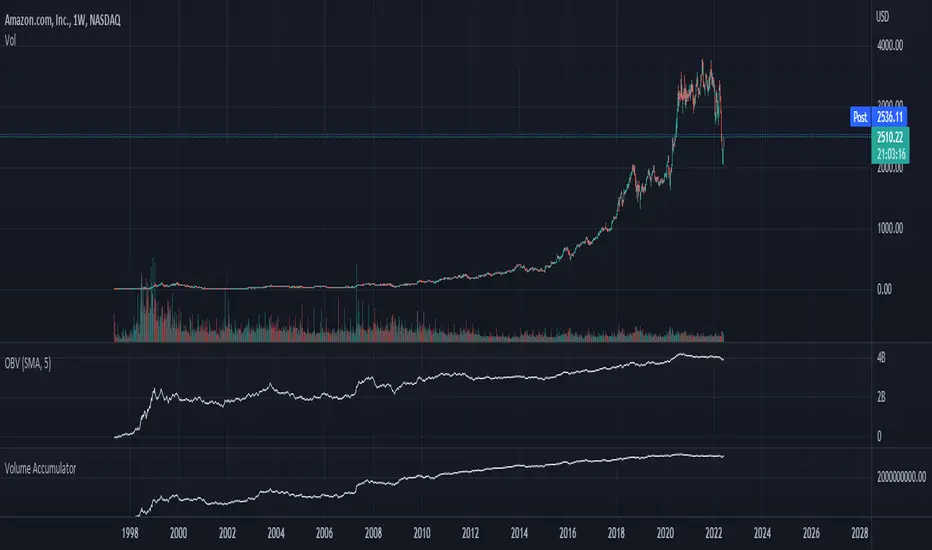
Chaikin Volume AccumulatorThe Volume Accumulator is used in technical analysis to identify strengths and weaknesses in a market. It is derived from the On Balance Volume indicator, except that instead of giving all the volume to bears on red days and bulls on green days it gives a proportional amount to both depending on the relative close price. As with many trading indicators, classic divergence between the VA and the close price may indicate an incoming reversal.
As a general rule of thumb:
Price Up:
VA up = clear uptrend
VA sideways = moderate uptrend
VA down = weak uptrend
Price Sideways:
VA up = accumulation
VA sideways = no bias
VA down = distribution
Price Down
VA up = weak downtrend
VA sideways = moderate downtrend
VA down = strong downtrend
OBV Overbuy+sell Oscillator[RSU]On-balance volume (OBV) is a technical trading momentum indicator that uses volume flow to predict changes in stock price. Joseph Granville first developed the OBV metric in the 1963 book Granville's New Key to Stock Market Profits.
This indicator is based on the OBV indicator and adds 2 times the standard deviation Bollinger Band to evaluate the overbought and oversold phenomenon of the OBV indicator.
The characteristics of Bollinger Bands: According to the normal distribution phenomenon, only 5% of the cases will exceed 2 times the standard deviation of the Bollinger Bands . So when it exceeds, I use colors to mark red overbought and green oversold situations.
Usage:
1.Identify trends: Identify current stock trends by OBV's 30 average line color.
2.Breakthrough:OBV Breakthrough 30 average,signal trend may reversal.
3.Oversell and overbuy:A break below overbuy could signal a temporary end to the uptrend.
4.Divergence:When the slope of the two highs is opposite to the slope of the two highs of the indicator, a trend reversal signal may occur.

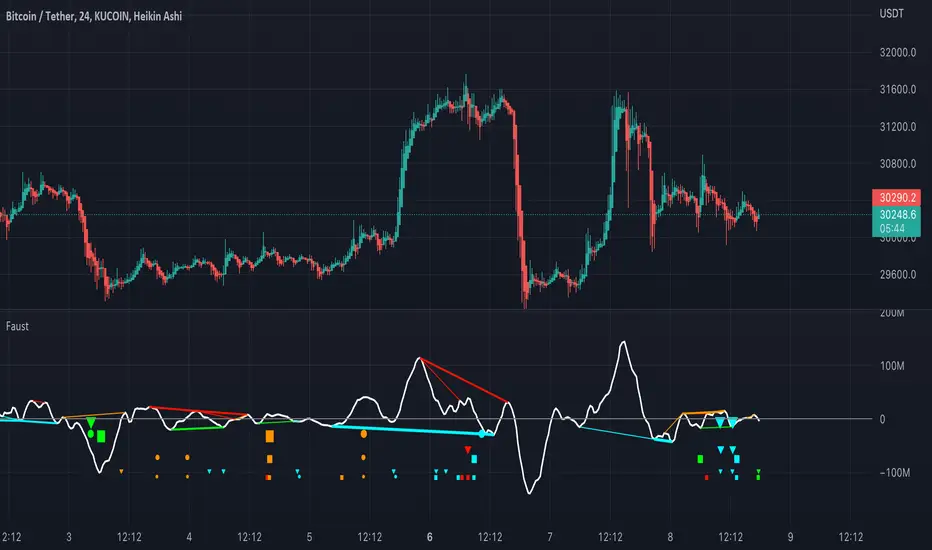
FaustFaust is a composite indicator that combines 3 volume indicators: TSV, OBV, and PVT.
TSV moving average is plotted as an oscillator. OBV and PVT are calculated internally.
Four divergences are calculated for each indicator (regular bearish, regular bullish, hidden bearish, and hidden bullish) with three look-back periods (high, mid, and small).
For TSV, the fattest plotted line is the divergence with the highest look-back period, and the thinnest line is the divergence with the shortest look-back period.
For PVT, the larger the circle, the higher the divergence look-back period.
For OBV, the larger the triangle, the higher the divergence look-back period.
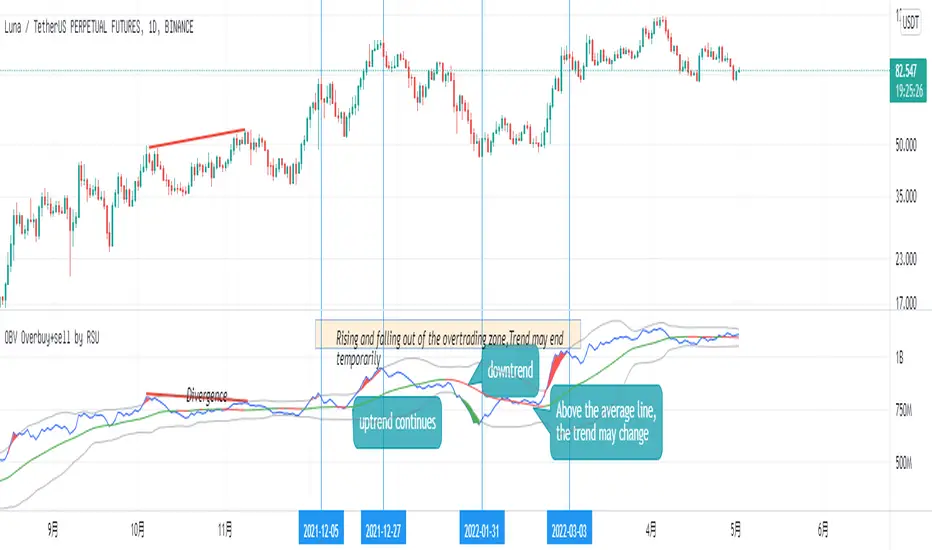
OBV Overbuy+sell by RSUOn-balance volume (OBV) is a technical trading momentum indicator that uses volume flow to predict changes in stock price. Joseph Granville first developed the OBV metric in the 1963 book Granville's New Key to Stock Market Profits.
This indicator is based on the OBV indicator and adds 2 times the standard deviation Bollinger Band to evaluate the overbought and oversold phenomenon of the OBV indicator.
The characteristics of Bollinger Bands: According to the normal distribution phenomenon, only 5% of the cases will exceed 2 times the standard deviation of the Bollinger Bands. So when it exceeds, I will use colors to mark red overbought and green oversold situations.
Usage:
1.Identify trends: Identify current stock trends by OBV's 30 average line color.
2.Breakthrough:A break below overbuy could signal a temporary end to the uptrend.
3.Oversell and overbuy:A break below overbuy could signal a temporary end to the uptrend.
4.Divergence:When the slope of the two highs is opposite to the slope of the two highs of the indicator, a trend reversal signal may occur.
OBV+EMA HistogramHistogram of the difference between On Balance Volume and an EMA of the On Balance Volume (OBV + EMA).
Using a 55 EMA, on the daily timeframe of BTC, bull/bear trends occur when the histogram is above/below the zero line respectively.
Divergences also have a notable effect.
-- Added alert conditions when OBV crosses EMA to signal a possible trend change, for bullish and bearish cases.

Hotch DMI+OBV+RSI ConfluenceThis Indicator uses the Relative Strength Index, On Balance Volume, and ADX to identify viable trading trends.
A quick description of what is on display:
1.) Green Triangle = OBV crossing over OBV MA
2.)Red Triangle = OBV Crossing under OBV SMA
3.) The background coloring between the RSI Oversold and Overbought Values has multiple conditions.
----It is green when the DI+ > DI-
----It is purple when the DI+ < DI-
----the brightness represents the ADX value. Darker areas(or more transparent) show a weak ADX value(4). Brighter (or less transparent) show a stronger ADX value(3)
5.) RSI and RSI moving average, including a divergence indicator.
6.) A histogram representing the normalized value of OBV-OBVMA to show changes in value while remaining readably in range on the chart with other indicators.
In the included chart screen shot is an example of an applicable strategy. This example is no guaranteed success and is also not the only strategy applicable to the indicator.

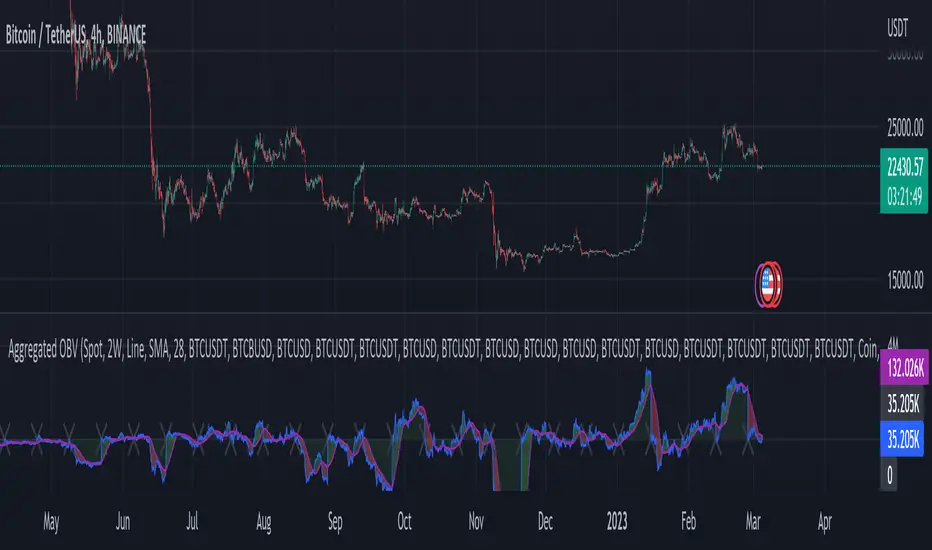
Aggregated On Balance Volume - InFinitoOn Balance Volume calculated with aggregated and normalized volume data and a few other features:
Aggregation code originally from Crypt0rus
Candle Plotting code from LonesomeTheBlue
***The indicator can be used for any coin/symbol to aggregate volume, but it has to be set up manually***
As normal OBV, this indicator can be used to find divergences and to have an idea of volume flow. Using aggregated data makes it more accurate and allows to compare volume flow between different kinds of markets (Spot, Futures, Perpetuals, Futures+Perpetuals and All Volume).
As well, in order to make the data as accurate as possible, the data from each exchange aggregated is normalized to report always in terms of 1 BTC. In case this indicator is used for another symbol, the calculations can be adjusted manually to make it always report data in terms of 1 contract/coin.
Extra features:
- Based off LonesomeTheBlue, OBV can be plotted as candles and as Heiken Aishi candles (which give wick information)
- A Moving Average (SMA, EMA, WMA, RMA, VWMA) can be plotted to the OBV. This can be used as a confluent signal to enter a trade on a crossover or to know the strength of the current move.
- The OBV basis can be reset to 0 periodically, making it more oscillator-like and allowing to focus only on a certain period of time.
On Balance Volume wi Normalization (OSC)Hello everyone, I'm sorry that the previous open-source version was hidden due to the house rules, I've re-edited the description and re-posted it
(1) Indicator introduction
This indicator is a normalized OBV that never dulls and has a better divergence accuracy than RSI
This indicator is plotted on the Normalized OBV and can display the divergence locations and corresponding divergence intensity
The tolerance of N Klines at the top or bottom positions for price and indicator is supported, which is set by the "Tolerant Kline Number"
Support the display of divergence intensity, that is, the REG/HID value displayed on the label, which is less than 0. The smaller the intensity value, the more obvious divergence
Support the filtering of divergence intensity, which is set by "Cov Threshold". The divergence that REG/HID divergence intensity greater than this value will be ignored
In the label, REG indicates regular top/bottom divergence while HID indicates hidden top/bottom divergence
In the label, SRC(x-y) indicates a divergence occurred from the x-th kline to the y-th kline
In the label, OSC(x-y) indicates a divergence occurred from the indicator corresponding to the x-th kline to the y-th kline
(2) Parameter introduction
- Normalized On Balance Volume
MA Type: Type of moving average for calculating the normalized OBV, default is SMA
MA Period: Period of moving average of normalized OBV, which is SMA14 by default
NOBV Sigma: Upper and lower range of normalized OBV
- Normalized On Balance Volume Divergence
Pivot Lookback Right: Number of K-line bars recalling the pivot top/bottom point to the right
Pivot Lookback Left: Number of K-line bars recalling the pivot top/bottom point to the left
Max of Lookback Range: Maximum number of retracing K-line bars to find the pivot top/bottom point
Min of Lookback Range: Minimum number of retracing K-line bars to find the pivot top/bottom point
Tolerant Kline Number: Maximum tolerance in indexing top/bottom points of Klines and indicators
Cov Threshold: Divergence intensity, which is less than 0. The smaller the intensity value, the more obvious divergence
Plot Bullish: Whether to draw regular bullish divergence label
Plot Hidden Bullish: Whether to draw hidden bullish divergence label
Plot Bearish: Whether to draw regular bearish divergence label
Plot Hidden Bearish: Whether to draw hidden bearish divergence label
Happy trading and enjoy your life!
————————————————————————————————————————
各位朋友大家好,很抱歉之前的开源版本因为规则原因被隐藏,我已经重新编辑了说明并重新发布
(1) 指标说明
该指标是 OBV 的归一化版本,永不钝化,背离准确率高于 RSI
该指标绘制于 归一化OBV 上,并在对应位置显示背离点以及背离程度
支持顶底位置 N 根K线的容差,由 Tolerant Kline Number 参数设置
支持背离强度的显示,即标签上显示的 REG/HID 值,该值小于 0,且越小说明背离程度越大
支持背离强度的过滤,由 Cov Threshold 参数设置, REG/HID 值大于这个值的背离会被忽略
标签中,REG 表示常规顶/低背离,而 HID 表示隐藏顶/底背离
标签中,SRC(x-y) 表示从当前第 x 根 bar 开始到第 y 跟 bar 出现背离
标签中,OSC(x-y) 表示从当前第 x 根 bar 所对应的指标开始到第 y 跟 bar 所对应的指标出现背离
(2) 参数说明
- Normalized On Balance Volume
MA Type: 计算归一化 OBV 的移动平均的类型,默认为 SMA
MA Period: 计算归一化 OBV 的移动平均的周期,默认为 SMA14
NOBV Sigma: 归一化 OBV 的过滤区间
- Normalized On Balance Volume Divergence
Pivot Lookback Right: 枢纽顶/底点往右回顾的 K线 bar 数量
Pivot Lookback Left: 枢纽顶/底点往左回顾的 K线 bar 数量
Max of Lookback Range: 回寻找枢纽顶/底点的最大回溯 K线 bar 数量
Min of Lookback Range: 回寻找枢纽顶/底点的最小回溯 K线 bar 数量
Tolerant Kline Number: K线和指标的顶/底点索引的最大误差
Cov Threshold: 背离程度,该值小于 0,且越小说明背离程度越大
Plot Bullish: 是否绘制常规底背离提示
Plot Hidden Bullish: 是否绘制隐藏底背离提示
Plot Bearish: 是否绘制常规顶背离提示
Plot Hidden Bearish: 是否绘制隐藏顶背离提示
祝大家交易愉快

On Balance Volume wi Normalization (SRC)Hello everyone, I'm sorry that the previous open-source version was hidden due to the house rules, I've re-edited the description and re-posted it
(1) Indicator introduction
This indicator is a normalized OBV that never dulls and has a better divergence accuracy than RSI
This indicator is plotted on the klines and can display the divergence locations and corresponding divergence intensity
The tolerance of N Klines at the top or bottom positions for price and indicator is supported, which is set by the "Tolerant Kline Number"
Support the display of divergence intensity, that is, the REG/HID value displayed on the label, which is less than 0. The smaller the intensity value, the more obvious divergence
Support the filtering of divergence intensity, which is set by "Cov Threshold". The divergence that REG/HID divergence intensity greater than this value will be ignored
In the label, REG indicates regular top/bottom divergence while HID indicates hidden top/bottom divergence
In the label, SRC(x-y) indicates a divergence occurred from the x-th kline to the y-th kline
In the label, OSC(x-y) indicates a divergence occurred from the indicator corresponding to the x-th kline to the y-th kline
(2) Parameter introduction
- Normalized On Balance Volume
MA Type: Type of moving average for calculating the normalized OBV, default is SMA
MA Period: Period of moving average of normalized OBV, which is SMA14 by default
NOBV Sigma: Upper and lower range of normalized OBV, but the function is reserved
- Normalized On Balance Volume Divergence
Pivot Lookback Right: Number of K-line bars recalling the pivot top/bottom point to the right
Pivot Lookback Left: Number of K-line bars recalling the pivot top/bottom point to the left
Max of Lookback Range: Maximum number of retracing K-line bars to find the pivot top/bottom point
Min of Lookback Range: Minimum number of retracing K-line bars to find the pivot top/bottom point
Tolerant Kline Number: Maximum tolerance in indexing top/bottom points of Klines and indicators
Cov Threshold: Divergence intensity, which is less than 0. The smaller the intensity value, the more obvious divergence
Plot Bullish: Whether to draw regular bullish divergence label
Plot Hidden Bullish: Whether to draw hidden bullish divergence label
Plot Bearish: Whether to draw regular bearish divergence label
Plot Hidden Bearish: Whether to draw hidden bearish divergence label
Happy trading and enjoy your life!
————————————————————————————————————————
各位朋友大家好,很抱歉之前的开源版本因为规则原因被隐藏,我已经重新编辑了说明并重新发布
(1) 指标说明
该指标是 OBV 的归一化版本,永不钝化,背离准确率高于 RSI
该指标绘制于 K线 上,并在对应位置显示背离点以及背离程度
支持顶底位置 N 根K线的容差,由 Tolerant Kline Number 参数设置
支持背离强度的显示,即标签上显示的 REG/HID 值,该值小于 0,且越小说明背离程度越大
支持背离强度的过滤,由 Cov Threshold 参数设置, REG/HID 值大于这个值的背离会被忽略
标签中,REG 表示常规顶/低背离,而 HID 表示隐藏顶/底背离
标签中,SRC(x-y) 表示从当前第 x 根 bar 开始到第 y 跟 bar 出现背离
标签中,OSC(x-y) 表示从当前第 x 根 bar 所对应的指标开始到第 y 跟 bar 所对应的指标出现背离
(2) 参数说明
- Normalized On Balance Volume
MA Type: 计算归一化 OBV 的移动平均的类型,默认为 SMA
MA Period: 计算归一化 OBV 的移动平均的周期,默认为 SMA14
NOBV Sigma: 归一化 OBV 的过滤区间,其功能暂时保留
- Normalized On Balance Volume Divergence
Pivot Lookback Right: 枢纽顶/底点往右回顾的 K线 bar 数量
Pivot Lookback Left: 枢纽顶/底点往左回顾的 K线 bar 数量
Max of Lookback Range: 回寻找枢纽顶/底点的最大回溯 K线 bar 数量
Min of Lookback Range: 回寻找枢纽顶/底点的最小回溯 K线 bar 数量
Tolerant Kline Number: K线和指标的顶/底点索引的最大误差
Cov Threshold: 背离程度,该值小于 0,且越小说明背离程度越大
Plot Bullish: 是否绘制常规底背离提示
Plot Hidden Bullish: 是否绘制隐藏底背离提示
Plot Bearish: 是否绘制常规顶背离提示
Plot Hidden Bearish: 是否绘制隐藏顶背离提示
祝大家交易愉快

OBV Oscillator [LazyBear]- with some MAsThis indicator in modified OBV written by @LazyBear
I just added the 2 different Bollinger Bands and 2 different moving averages to the OBV version of LazyBear.
OBV line green -> OBV above zero
OBV line red -> OBV under zero
green background line -> OBV crossover 1st Moving Average
red background line -> OBV crossunder 1st Moving Average
blue '◆' -> OBV crossover 2nd Moving Average
yellow '◆' -> OBV crosunder 2nd Moving Average
blue '+' -> 1st Moving Average crossUNDER 2nd Moving Average
red '+' -> 1st Moving Average crossOVER 2nd Moving Average
