Trade Pivot ProEnglish (required first):
Trade Pivot Pro is a comprehensive indicator that combines advanced Pivot Point calculations, Moving Averages (SMA & EMA), ATR-based volatility bands, time cycle logic, and customizable alerts.
Key Features
Pivot Points: Multiple calculation methods (Traditional, Fibonacci, Woodie, Classic, DM, Camarilla).
Flexible Time Cycles: Automatic pivot anchoring based on chart timeframe, plus manual options (Daily, Weekly, Monthly, Quarterly, Yearly, Bi-yearly, Tri-yearly, Quinquennial, Decennial).
Moving Averages: Four configurable SMA/EMA lines (21, 50, 100, 200 periods) with slope detection.
ATR Bands: Dynamic upper and lower bands plotted around price to visualize volatility.
Alerts:
MA slope changes (Up/Down).
Pivot + 200 SMA trend confirmation.
ATR volatility threshold (High/Low).
Combined Pivot + SMA + ATR strong trend alerts.
Time Cycles
Chart Timeframe Pivot Timeframe
10s 15 minutes
1m 1 hour
5m 4 hours
15m 1 day
1h 1 week
4h 1 week
1D 1 month
1W 3 months
1M 1 year
This indicator helps traders identify trend direction, volatility conditions, time cycles, and key support/resistance levels in one unified tool. It is suitable for intraday and higher timeframes, with options to use daily-based or intraday pivot values.
Note: This script is free of advertisements and intended purely for educational and trading analysis purposes.
Hareketli Ortalamalar

Multiple Moving Averages by BadshahIntroduction Streamline your technical analysis with the Quintuple MA Strategy Suite, a robust all-in-one utility designed to maximize chart efficiency. Instead of cluttering your workspace with multiple individual indicators, this script empowers you to deploy up to five fully customizable Moving Averages simultaneously. Whether you are tracking micro-trends for scalping or major baselines for swing trading, this tool adapts to every timeframe and style.
Core Features
5-in-1 Architecture: Run five independent moving averages at once, saving your precious indicator slots for other tools.
Hybrid Calculation Modes: Instantly toggle any line between Simple Moving Average (SMA) for smooth baselines and Exponential Moving Average (EMA) for weight-sensitive reactions to recent price action.
Smart labeling System: Features an intelligent labeling mechanism that places text tags slightly offset from the current price. This ensures you can instantly identify which line is which (e.g., "EMA 50" vs "SMA 200") without the text obscuring the latest candles.
Granular Control: Every aspect is customizable. You can independently adjust the Length, Source (Close, Open, High, Low, etc.), Color, and Visibility for each of the five MAs.
Practical Use Cases
The "Golden Cross" Setup: Enable MA 3 (50 Length) and MA 5 (200 Length) to automatically visually track major trend reversals.
Ribbon Trading: Enable all five lines with sequential lengths (e.g., 20, 50, 100, 150, 200) to create a "Moving Average Ribbon," visualizing the strength and direction of the trend expansion.
Scalping Cross: Use MA 1 and MA 2 set to fast lengths (like 9 and 21) to catch rapid momentum shifts.
Settings Guide
Show MA: Toggles the visibility of the specific line.
Show Label: Toggles the text tag next to the line (auto-offset by 5 bars).
Type: Select between SMA or EMA calculation.
Length: Define the lookback period for the average.
Disclaimer This script is provided for educational and analytical purposes only. Past performance of indicators does not guarantee future results. Trade responsibly.

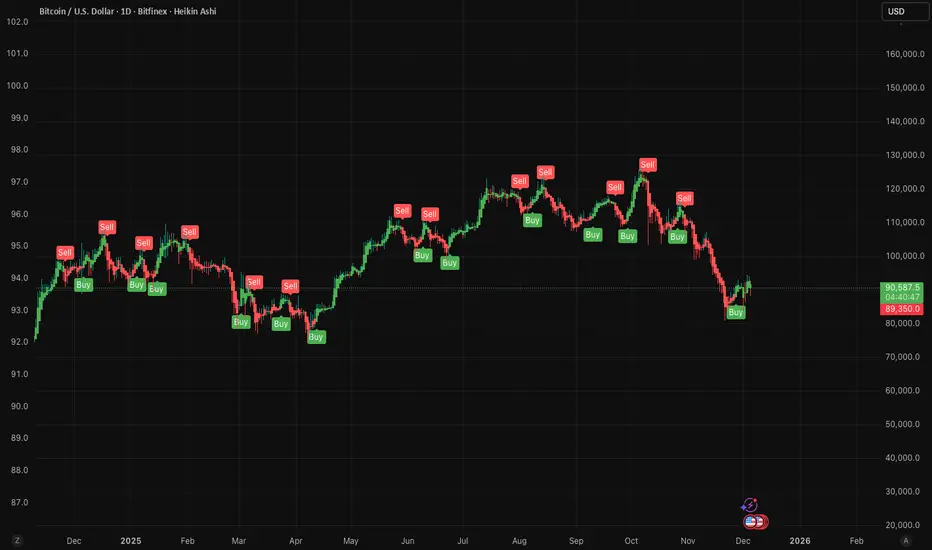
Yin and Yang Trading Strategy Yin and Yang Trading Strategy: An Educational Overview
The "Yin and Yang" trading strategy embodies the balance and duality of the yin-yang philosophy, representing both harmony and opposition within the market. In this strategy, like the two complementary forces of yin (bearish) and yang (bullish), opposing trends are monitored to create balance through careful entries and exits in trades. Let's break down how this strategy works and the key indicators involved.
1. The Yin and Yang Analogy
In the same way that yin and yang coexist to form a whole, this strategy seeks to balance two critical market elements: price momentum and volatility. The yin (bearish side) represents a slowing or declining market, while the yang (bullish side) symbolizes growth and upward movement. The strategy uses the market's inherent volatility and trend to guide entries and exits, ensuring that trades follow the flow, just as yin and yang flow into each other.
2. Key Indicators Involved
The Yin and Yang strategy is built around the following key technical indicators:
ATR (Average True Range): This measures market volatility. The higher the ATR, the greater the market's volatility. In this strategy, ATR helps define the range of movement the price can make before a position should be closed or opened. The input "ATR Period" sets the window for ATR calculation, allowing users to adjust the sensitivity to market movements.
Heikin Ashi Candles: These modified candlesticks smooth out price action, making it easier to identify trends. Instead of using traditional open-high-low-close data, Heikin Ashi candles are calculated differently to better capture the overall market direction, reducing noise. The user can switch between regular candles and Heikin Ashi candles based on preference.
EMA (Exponential Moving Average): The EMA helps smooth out price data to create a trend-following indicator. This is particularly useful in detecting crossovers with the ATR trailing stop, signaling potential buy and sell opportunities.
3. The Specific Strategy
The strategy revolves around using an ATR trailing stop to follow price movements and enter or exit trades based on volatility and trend strength. Here's how it works:
ATR Trailing Stop: The system calculates a trailing stop based on the ATR value multiplied by a user-defined key value (input "a"). This trailing stop adjusts dynamically as the market moves, providing a stop level that tracks the current trend.
Position Direction: When the price moves above the ATR trailing stop, the strategy signals a buy (long position). Conversely, when the price drops below the ATR trailing stop, the strategy signals a sell (short position). This ensures you're always trading with the trend, respecting the balance of yin and yang in the market.
Entry and Exit: Buy and sell conditions are determined by comparing the price to the ATR trailing stop. Additionally, crossovers between the ATR trailing stop and EMA further confirm trend reversals, providing clear signals for entering or exiting trades.
4. Best Practices for Trading the Yin and Yang Strategy
Tune the ATR Sensitivity: Adjust the "Key Value" input (a) to control how sensitive the ATR trailing stop is to market movements. A higher value will result in a wider trailing stop, suitable for high-volatility markets, while a lower value tightens the stop for low-volatility conditions.
Use Heikin Ashi for Clarity: If the market seems noisy, use Heikin Ashi candles to smooth out price action and get a clearer view of trends. This can be particularly useful in choppy or sideways markets.
Align with Market Volatility: Monitor the ATR closely. In periods of high volatility, expect larger price swings, and adjust your trailing stop accordingly to avoid being prematurely stopped out.
Stick to the Plan: As with any strategy, consistency is key. The Yin and Yang strategy works best when you adhere to the buy and sell signals without second-guessing, just like maintaining balance in the philosophy of yin and yang.
This strategy offers a clear framework for balancing market trends and volatility, helping traders find harmony in their trading decisions.
Join our RoseTree Investing Community: skool.com/rosetree
Enhance your trading journey by joining our FREE community where you’ll gain access to exclusive content, live trading sessions, and advanced strategies from leading crypto experts.
Trend with ADX, multiple EMAs - Buy & Sell✔ Trend Direction
Via DI+ > DI–
✔ Trend Strength
Via ADX
✔ Fast Entry Signals
5/8 EMA crossovers
✔ Larger Trend Confirmation
13/48 EMA crossovers
✔ Macro Trend
EMA 200
✔ Intraday Bias
VWAP
✔ Visual Trend (background)
✔ Alerts for signals + trend shifts

DarkPool FlowDarkPool Flow is a professional-grade technical analysis tool designed to align retail traders with the dominant "smart money" flow. Unlike standard moving average crossovers that often generate false signals during consolidation, this script employs a multi-layered filtering engine to isolate high-probability trends.
The core philosophy of this indicator is that Trends are fractal. A sustainable move on a lower timeframe must be supported by momentum on a higher timeframe. By comparing a "Fast Signal Trend" against a "Slow Anchor Trend" (e.g., Daily vs. Weekly), the script identifies the market bias used by institutional algorithms.
This edition features a Smart Recovery Engine, ensuring that valid trends are not missed simply because momentum started slowly, and a Dynamic Cloud that visually represents the strength of the trend spread.
Key Features
1. Auto-Adaptive Timeframe Logic
The script eliminates the guesswork of Multi-Timeframe (MTF) selection. By enabling "Auto-Adapt," the indicator detects your current chart timeframe and automatically maps it to the mathematically correct institutional pairings:
Scalping (<15m): Uses 15-Minute Trend vs. 1-Hour Anchor.
Day Trading (15m - 1H): Uses 4-Hour Trend vs. Daily Anchor.
Swing Trading (4H - Daily): Uses Daily Trend vs. Weekly Anchor (The classic "Golden" setup).
Investing (Weekly): Uses 21-Week EMA vs. 50-Week SMA (Bull Market Support Band logic).
2. Smart Recovery Signal Engine
Standard crossover scripts often miss major moves if the specific breakout candle has low volume or weak ADX. This script utilizes a state-machine logic that "remembers" the trend direction. If a trend begins during low volatility (gray candles), the script waits. The moment volatility and momentum confirm the move, a Smart Recovery Signal is triggered, allowing you to enter an existing trend safely.
3. Chop Protection (Gray Candles)
Preservation of capital is the priority. The script analyzes the Average Directional Index (ADX) and Volatility (ATR).
Colored Candles (Green/Red): The market is trending with sufficient strength. Trading is permitted.
Gray Candles: The market is in a low-energy chop or consolidation (ADX < 20). Trading is discouraged.
4. Dynamic Trend Cloud
The space between the Fast and Slow trends is filled with a dynamic cloud.
Darker/Opaque Cloud: Indicates a widening spread, suggesting accelerating momentum.
Lighter/Transparent Cloud: Indicates a narrowing spread, suggesting the trend may be weakening or consolidating.
5. Pullback & Retest Signals (+)
While triangles mark the start of a trend, the Plus (+) signs mark low-risk opportunities to add to a position. These appear when price dips into the cloud, finds support at the "Fair Value" zone, and closes back in the direction of the trend with confirmed momentum.
User Guide & Strategy
Setup
Add the indicator to your chart.
For Beginners: Enable "Auto-Adaptive Timeframes" in the settings.
For Advanced Users: Disable Auto-Adapt and manually configure your Fast/Slow pairings (Default is Daily 50 EMA / Weekly 50 EMA).
Signal Mode: Choose "First Breakout Only" for a cleaner chart, or "All Signals" if you wish to see re-entry points during choppy starts.
Long Entry Criteria (Buy)
Trend: The Cloud must be Green (Fast Trend > Slow Trend).
Signal: A Green Triangle appears below the bar.
Confirmation: The signal candle must not be Gray.
Re-Entry: A small Green (+) sign appears, indicating a successful test of the cloud support.
Short Entry Criteria (Sell)
Trend: The Cloud must be Red (Fast Trend < Slow Trend).
Signal: A Red Triangle appears above the bar.
Confirmation: The signal candle must not be Gray.
Re-Entry: A small Red (+) sign appears, indicating a successful test of the cloud resistance.
Stop Loss & Risk Management
Stop Loss: A standard institutional stop loss is placed just beyond the Slow Trend Line (the outer edge of the cloud). If price closes beyond the Slow Trend, the macro thesis is invalid.
Take Profit: Target liquidity pools or use a trailing stop based on the Fast Trend line.
Settings Overview
Mode Selection: Toggle between Auto-Adaptive logic or Manual control.
Manual Configuration: Define the specific Timeframe, Length, and Type (EMA, SMA, WMA) for both Fast and Slow trends.
Signal Logic: Toggle "Show Pullback Signals" on/off. Switch between "First Breakout" or "All Signals."
Quality Filters: Toggle individual filters (ATR, RSI, ADX) to adjust sensitivity. Turning these off makes the script more responsive but increases false signals.
Visual Style: Customize colors for Bullish, Bearish, and Neutral (Gray) states. Adjust cloud transparency.
Disclaimer
Risk Warning: Trading financial markets involves a high degree of risk and is not suitable for all investors. You could lose some or all of your initial investment.
Educational Use Only: This script and the information provided herein are for educational and informational purposes only. They do not constitute financial advice, investment advice, trading advice, or any other recommendation.
No Guarantee: Past performance of any trading system or methodology is not necessarily indicative of future results. The "Institutional Trend" indicator is a tool to assist in technical analysis, not a crystal ball. The creators of this script assume no responsibility or liability for any trading losses or damages incurred as a result of using this tool. Always perform your own due diligence and consult with a qualified financial advisor before making investment decisions.

Adaptive Dual MA Trend Ribbon Community “Larsson-Style” PresetsMany traders enjoy experimenting with dual-moving-average “trend ribbon” structures that resemble the visual style of popular tools such as the Larsson Line. While the internal logic of closed-source indicators is not publicly available, the trading community often explores MA combinations like SMMA 15/29 or EMA 30/60 with ATR filters to study trend transitions and visualize momentum shifts.
This script does not replicate, reverse-engineer, or replace any closed-source indicator. Instead, it provides a flexible, open-source framework that lets traders build their own trend-ribbon configuration inspired by similar visual concepts while maintaining full transparency. Because the calculations rely only on standard, well-known moving-average and ATR methods, traders can experiment freely with community-discussed presets without relying on proprietary tools.
What the Script Does
• Plots Fast and Slow moving averages using the method of your choice: SMMA (RMA), EMA, SMA, or WMA
• Colors the ribbon to show directional bias:
• Bullish when Fast MA > Slow MA
• Bearish when Fast MA < Slow MA
• Neutral when the difference is small (optional ATR filter)
• Supports ATR-based neutral zone filtering
• Supports optional bar coloring
• Works on all markets and timeframes
• Fully open-source and customizable
Why This Script Is Useful
Traditional moving averages identify trend direction but lack context during uncertain or low-momentum conditions. This script adds value by:
1. Allowing multiple smoothing techniques (SMMA/EMA/SMA/WMA)
2. Highlighting clearer trend transitions
3. Identifying low-confidence periods using ATR
4. Providing a visually intuitive ribbon instead of single-line signals
Suitable for swing traders, trend followers, breakout traders, and anyone who wants cleaner structure-based contextualization.
Popular Community MA Combinations
Many traders experiment with specific MA pairs to understand trend-ribbon behavior:
• SMMA 15/29 → smoother structural trend flow
• EMA 30/60 → more responsive momentum shifts
• EMA 10/21 → intraday rhythm
• EMA 50/100 → higher-timeframe structure
These examples are commonly used by the community—but this script does not recreate or imitate any closed-source or commercial indicator.
How to Use
1. Choose your preferred MA type
2. Adjust Fast/Slow lengths to match your timeframe
3. Enable ATR Neutral Zone to reduce false flips
4. Optionally enable bar coloring
5. Combine with structure, volume, or price action for decision-making
Important Notes
• This script is original, open-source, and not affiliated with any commercial indicator or author.
• It does not reproduce, imitate, or reverse-engineer any closed-source logic.
• All computations are standard MA/ATR methods for clarity and transparency.
Disclaimer
This tool is for educational and analytical purposes only.
Always test parameters and use proper risk management before applying to live trading.

Linda Raschke 5 SMA Reversal [LuciTech]How This Indicator Works:
-5 SMA Tracking: Calculates a 5-period simple moving average and plots it on the chart.
-Extension Counter: Counts consecutive bars where price closes above or below the 5 SMA.
-BUY Signals (Green Up Arrow): Triggers when price closes BELOW the 5 SMA after 7+ consecutive closes ABOVE it—indicates a reversal opportunity into dynamic support.
-SELL Signals (Red Down Arrow): Triggers when price closes ABOVE the 5 SMA after 7+ consecutive closes BELOW it—indicates a reversal bounce setup.
-No Repainting: Signals only plot on confirmed bar closes; no repainting issues.
Linda Raschke's Core Principles:
-Extended Run = Imbalance: When price stays above/below the 5 SMA for 7+ bars, it's a one-sided market; mean reversion is likely.
-First Cross = Trigger: The first close back across the SMA after an extension is the reversal signal, not every touch.
-No Setup? No Trade: Without a prior extension or "three-bar balance" filter, a 5 SMA tag is noise. The model requires the prior momentum condition.
-Uptrend Buys: In uptrends, buy dips to the SMA (dynamic support) as long as the weekly/monthly trend is intact.
-Downtrend Fades: In downtrends, treat first rallies above the SMA as bounce fades into lower lows (especially after 14+ bars below).

Aydan ScalperBy when EMA 8 cross EMA 21 from Below to Abouve and SELL when EMA 21 cross EMA 8 from Abouve to Belove

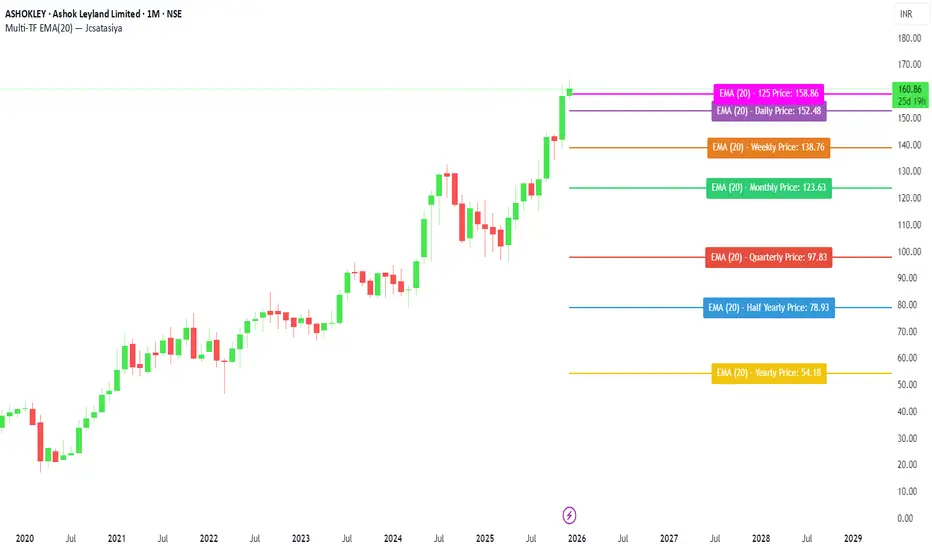
Multi-TF EMA(20) — JcsatasiyaOverview
This indicator plots 7 multi-timeframe EMA(20) lines on any chart and displays a clean dynamic label for each EMA showing:
Full timeframe name (Yearly, Half-Yearly, Quarterly, Monthly, Weekly, etc.)
EMA(20) value formatted with exactly 2 decimals
A label that is positioned automatically to the right of the latest candle
White text for maximum readability
Color-coded lines for each timeframe
All EMA lines extend horizontally and update in real-time when new candles form on the selected timeframes.
✅ Key Features
• 7 Custom Timeframes
Choose any timeframe for each EMA (Yearly, 6-Month, 3-Month, Monthly, Weekly, Daily, 4H, etc.)
• Horizontal EMA Levels
Each EMA is drawn as a fixed horizontal level, making structure and bias easier to analyze.
• Dynamic Label Placement
Labels automatically position:
Horizontally: Left, Middle, or Right of the right-side future area
Vertically: Above, Middle, or Below the EMA line
• Clean Readable Labels
Always white text
Shows: EMA (20) – Timeframe Price: 123.45
Price always displays with 2 decimals
Label style auto-adjusts based on position
• Color Customization
Each timeframe EMA has its own color picker.
• All EMA Thickness Unified
Set one line thickness for all EMA lines.
• Reliable Multi-TF Accuracy
Uses request.security() with proper lookahead handling.
⭐ Why This Indicator Is Useful
This tool makes it extremely easy to visualize where your chart sits relative to major multi-timeframe EMA levels.
You immediately see:
Higher-timeframe trend direction
Bias zones
Key support/resistance EMA levels
Long-term vs short-term trend alignment
Price interaction with institutional EMAs
Perfect for day traders, swing traders, and position traders.
📘 HOW TO USE
1️⃣ Add to Chart
After adding the indicator, open the Settings → Inputs panel.
2️⃣ Choose the 7 Timeframes
For each slot, select your desired timeframe (example setup):
Yearly
Half Yearly
Quarterly
Monthly
Weekly
Daily
4H
3️⃣ Customize Colors
Pick a different color for each EMA for clarity.
4️⃣ Choose Label Placement
Use the label position controls:
Vertical: Upper / Middle / Below
Horizontal: Left / Middle / Right (relative to right-side future space)
5️⃣ Adjust Line Thickness (Optional)
A single slider controls the thickness of all 7 EMAs.
📝 NOTES
The indicator places labels 2–50 bars into the future depending on chosen position.
Labels are always visible and readable due to white text.
EMA values always show exactly two decimals, even for crypto, indices, and forex.
Works on any market and any chart timeframe.
All of MAsCustom indicator with my favorite multiple MAs.
Can switch to different timeframe source.
Default SMAs:
9
20
50
50 @ 2min
200
200 @ 2min
400 @ 2min
800


All Macro LevelsA comprehensive overlay indicator that displays key macro-level support and resistance zones using widely-followed moving averages across multiple timeframes.
Features
Bull Market Support Band (BMSB)
- Weekly 20 SMA and 21 EMA with customizable fill
- A popular indicator for identifying bull market trends - price holding above the band typically signals strength
Daily 12/21/25 EMA Bands
- Three daily EMAs (12, 21, 25) with fill between the outer bands
- Useful for tracking short-term momentum and trend direction
Long-Term Weekly Moving Averages
- 100-Week MA - Intermediate cycle support
- 200-Week MA - Major cycle support level
- 300-Week MA - Deep value zone
- Each MA can be configured as SMA or EMA
Customization
- Toggle each indicator group on/off independently
- Full color customization for lines, fills, and labels
- Adjustable line widths
- Optional custom symbol input to display levels from a different asset
- Real-time labels showing current values at chart edge
Use Cases
- Identify macro support/resistance levels
- Spot potential buy zones during corrections
- Confirm bull/bear market conditions
- Multi-timeframe analysis on a single chart

QuantumFlowTrader V1QuantumFlowTrader V1 — Adaptive Institutional Flow Framework
Overview
QuantumFlowTrader V1 is a precision-built visual tool that fuses institutional structure, dynamic volatility, and balance zones into one unified system.
It is designed to help traders align with the market’s internal flow without relying on lagging indicators or fixed settings.
Core Components
1. Adaptive EMA Clouds — Structural Flow
Layered exponential moving averages adapt to current conditions, clearly showing when market structure is aligned or in transition. Cloud color and intensity adjust automatically to reflect real-time directional bias.
2. Dynamic VWAP + Deviation Zones
Includes a self-adjusting VWAP with optional deviation bands (VWAP Deviation Zones) that reflect institutional fair-value areas — places where price often reacts, pauses, or mean-reverts.
The VWAP line shifts color based on price positioning.
3. Quantum ATR Engine — Multi-Layer Volatility Sync
A proprietary multi-ATR engine detects when volatility signals align in one direction across multiple sensitivities.
Arrows appear only on full directional agreement, signaling high-conviction flow moments.
4. Session Visualization + Arrow Filtering
Background shading highlights key trading sessions (Asia, London, USA).
You can optionally disable arrow signals during specific sessions for a cleaner view.
Features & Alerts
- Toggle EMA Clouds, VWAP, Deviation Zones, and ATR Arrows independently.
- Customize all colors, transparencies, and visual styles.
- Built-in alerts for bullish and bearish arrow signals.
Compatibility
Works on all assets: Forex, Crypto, Stocks, Indices, Futures.
Fully adaptive across all timeframes — intraday to swing.
No optimization needed — smart parameters adjust automatically.
Strategy Alignment Tip
QuantumFlowTrader V1 adapts to any trading strategy and acts as a directional compass for market flow.
It becomes especially powerful when combining multiple timeframes — for example, using the 1H and 15M charts to define trend alignment, and then executing entries on lower timeframes in the direction of that flow.
Note: Entry setups are defined by each trader’s individual system.
This indicator does not provide entry points — it highlights multi-timeframe alignment and directional bias.
To request access, contact via TradingView profile.

Smart MACD Crossover█ OVERVIEW
Smart MACD Crossover is an indicator designed for traders who trade based on MACD line crossovers. It significantly reduces the number of false crossover signals by adding a breakout-box confirmation mechanism. Price must close outside the box created at the moment of the MACD crossover for a signal to trigger. The script also includes optional scaled MACD lines on the price chart, candle coloring, multi-layer “fog” visualization, fully customizable entry signals, automatic Take Profit / Stop Loss levels and a real-time table.
█ CONCEPTS
Standard MACD crossovers frequently produce noise, especially in ranging markets. Smart MACD Crossover attempts to solve this issue: a horizontal box is drawn at the exact bar where the crossover occurs, and a trade signal is generated only when price actually breaks out of that box. By default, the show_only_matching filter is enabled — signals are shown only when the breakout direction matches the original MACD crossover direction (bullish box → long only, bearish box → short only).
█ FEATURES
Fully configurable classic MACD (default 12/26/9)
Optional MACD & Signal lines scaled and plotted directly on the price chart (show_macd_overlay)
Trend-based candle coloring
One-Side Histogram Fog:
- 6 layers above and 6 layers below hl2
- layer height based on average candle size × offset_mult (default 0.7)
- increasing transparency (base 80 + increment 4) for depth effect
- fully customizable colors
Breakout Boxes:
- created on every MACD crossover
- default height = high-low of the signal candle
- optional extension using average candle size × box_multiplier
- semi-transparent fill (85) with colored borders, extended right until breakout
Signals:
- Triangles or “BUY” / “SELL” labels
- show_only_matching filter (enabled by default) — only direction-consistent breakouts generate signals
- when disabled, every box breakout generates a signal according to breakout direction
- Built-in alerts: BUY and SELL
Take Profit / Stop Loss:
- TP1, TP2, TP3 and SL levels drawn automatically after each confirmed signal
- two modes: Candle Multiplier (based on average candle size) or Percentage
- all multipliers/percentages fully adjustable in “Risk Management Settings”
- real-time table in the top-right corner showing current TP/SL prices
█ HOW TO USE
Add via Pine Editor → paste code → Add to Chart.
Settings overview:
- MACD Settings: lengths and source
- Risk Management Settings: TP/SL mode, multipliers/percentages, average candle period
- MACD Overlay Lines: toggle scaled MACD lines on price chart
- Fog: enable/disable, adjust height and transparency
- Visual Settings: candle coloring
- Boxes: optional size multiplier (use_box_multiplier)
- Signals: choose Triangles or Labels, enable/disable direction filter
Signal meaning:
- Triangle below bar / “BUY” label → upward breakout from a box created after bullish MACD crossover
- Triangle above bar / “SELL” label → downward breakout from a box created after bearish MACD crossover
- Open boxes = pending breakout zones
- Fog below price = bullish pressure, fog above price = bearish pressure
█ APPLICATIONS
The indicator reduces false signals coming from plain MACD crossovers. For additional trend confirmation, the scaled MACD lines can be enabled.
Entry into a position is triggered by the BUY/SELL signal generated after the breakout. The TP1–TP3 and SL levels are drawn automatically only for convenience and as a quick reference – they are fully optional and traders can (and usually should) use their own preferred exit strategies, trailing stops, partial closes, or other money-management methods.
█ NOTES
- Due to MACD line scaling onto the price chart, classic MACD divergences cannot be identified

EMA Cloud TrendEMA Cloud Trend (Dual-Layer)
A clean and popular two-layer EMA cloud indicator:
• Inner cloud (EMA 8 – EMA 18): Bright yellow with 80% transparency
• Outer cloud (EMA 18 – EMA 36): Green (bullish) or Red (bearish) with 70% transparency
Trend direction is determined by the position of the fast EMA (8) relative to the slow EMA (36):
- Green outer cloud → Bullish bias
- Red outer cloud → Bearish bias
Fully transparent design that doesn’t hide price action. Perfect for trend confirmation, swing trading, and as a visual background filter.
Lightweight • No repainting • Works on all markets and timeframes
Enjoy the clouds!
EMA Cloud Trend (Çift Katmanlı)

51 - By GoldmanMrBaNNathis script is a multi-timeframe alignment tool designed to help users visually compare the trend direction of a higher timeframe with the movement on a lower timeframe.
The indicator simply displays when both selected timeframes are moving in the same direction based on a customizable trend-detection method (such as moving average alignment).
Its purpose is to provide clarity, structure, and directional alignment for chart analysis.
Users can select:
A higher timeframe
A lower timeframe
Trend calculation method
Visual display options
The tool is made to support analysis only.
It does not execute trades, generate financial advice, or guarantee outcomes.
Always use additional independent research when making decisions.
