Heartbeat Momentum Strategy BetaHeartbeat Momentum Strategy Beta
Overview
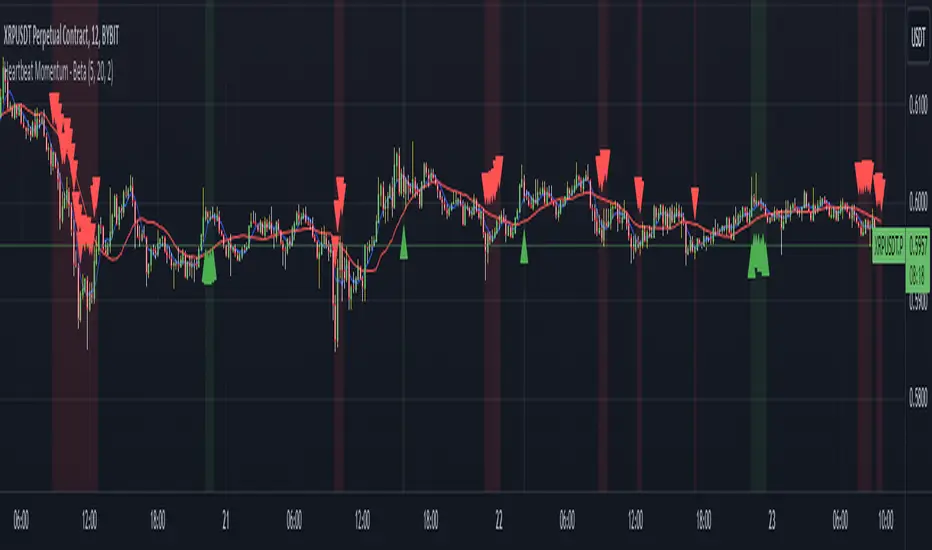
The Heartbeat Momentum Strategy is an innovative approach to market analysis that draws inspiration from the rhythmic patterns of a heartbeat. This strategy aims to identify significant momentum shifts in the market by comparing short-term and long-term moving averages, analogous to detecting irregularities in a heartbeat.
Key Concepts
Market Heartbeat: The difference between short-term and long-term moving averages, representing the market's current 'pulse'.
Heartbeat Volatility: Measured by the standard deviation of the market heartbeat.
Momentum Signals: Generated when the heartbeat deviates significantly from its normal range.
How It Works
Calculates a short-term moving average (default 5 periods) and a long-term moving average (default 20 periods) of the closing price.
Computes the 'heartbeat' by subtracting the long-term MA from the short-term MA.
Measures the volatility of the heartbeat using its standard deviation over the long-term period.
Generates buy signals when the heartbeat exceeds 2 standard deviations above its mean.
Generates sell signals when the heartbeat falls 2 standard deviations below its mean.
Indicator Components
Blue Line: Short-term moving average
Red Line: Long-term moving average
Green Triangles: Buy signals
Red Triangles: Sell signals
Background Color: Light green during buy signals, light red during sell signals
Strategy Parameters
Short MA Window: The period for the short-term moving average (default: 5)
Long MA Window: The period for the long-term moving average (default: 20)
Standard Deviation Threshold: The number of standard deviations to trigger a signal (default: 2.0)
Interpretation
Buy Signal: Indicates a potential strong upward momentum shift. Consider opening long positions or closing short positions.
Sell Signal: Suggests a potential strong downward momentum shift. Consider opening short positions or closing long positions.
No Signal: The market is moving within its normal rhythm. Maintain current positions or look for other entry opportunities.
Customization
Users can adjust the strategy parameters to suit different assets, timeframes, or trading styles:
Decrease the MA windows for more frequent signals (more suitable for shorter timeframes).
Increase the MA windows for fewer, potentially more significant signals (better for longer timeframes).
Adjust the Standard Deviation Threshold to fine-tune sensitivity (lower for more signals, higher for fewer but potentially stronger signals).
Risk Management
While this strategy can provide valuable insights into market momentum, it should not be used in isolation:
Always use stop-loss orders to manage potential losses.
Consider the overall market context and other technical/fundamental factors.
Be aware of potential false signals, especially in ranging or highly volatile markets.
Backtest and forward-test the strategy with different parameters before live trading.
Conclusion
The Heartbeat Momentum Strategy offers a unique perspective on market movements by treating price action like a heartbeat. By identifying significant deviations from the normal market rhythm, it aims to capture strong momentum shifts while filtering out market noise. As with any trading strategy, use it as part of a comprehensive trading plan and always practice sound risk management.
Momentum Göstergesi (MOM)
Uptrick: Adaptive Volatility Oscillator### **Overview and Purpose**
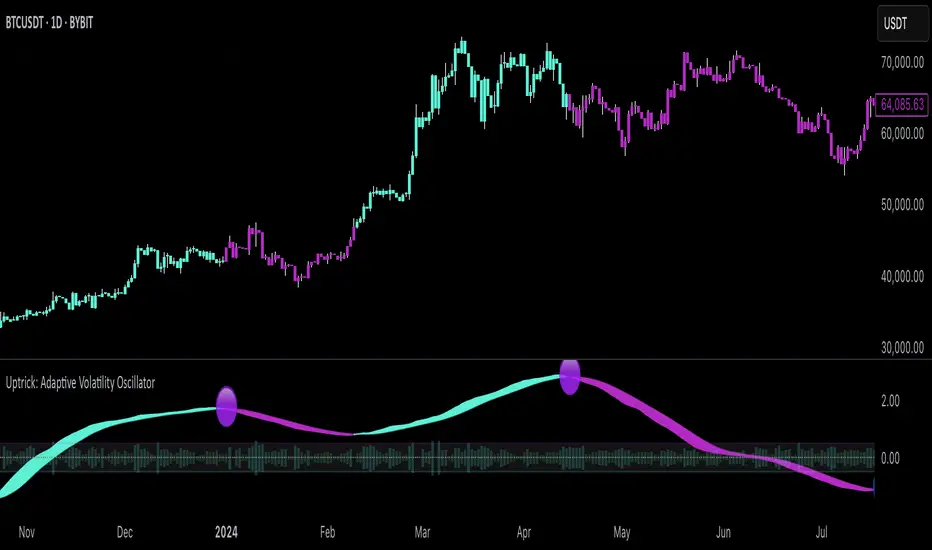
The **"Uptrick: Adaptive Volatility Oscillator"** is a sophisticated technical analysis tool designed to identify and visualize volatility trends within the financial markets. This indicator is particularly useful for traders and analysts who seek to understand the market's underlying momentum by analyzing the relationship between volume and price changes. It adapts to changing market conditions, providing a dynamic way to gauge overbought and oversold levels, identify potential reversals, and track the strength of market movements.
### **Core Components**
1. **Volume Oscillator Calculation**:
- **Purpose**: The volume oscillator is at the heart of this indicator. It measures the directional momentum of volume by comparing current volume levels with those of previous periods.
- **How It Works**: The oscillator calculates the difference between current and past volume levels, determining whether the market is experiencing buying or selling pressure. This is normalized to ensure the oscillator's values are comparable across different time frames and market conditions.
- **Normalized Oscillator**: To make the oscillator's readings more meaningful, the values are normalized by adjusting for standard deviation over a long period (150 bars). This step helps in smoothing out the noise and highlights significant shifts in market activity.
2. **Adaptive Filter Calculation**:
- **Purpose**: The adaptive filter refines the raw oscillator data to create a smoother signal that is responsive to market changes without being overly reactive to minor fluctuations.
- **Adaptive Coefficient**: This coefficient, set by the user, controls the sensitivity of the filter. A higher coefficient makes the filter more sensitive to recent changes, while a lower coefficient gives more weight to past data.
- **How It Works**: The filter applies a weighted average to the oscillator values, where recent data is given more importance. This creates a dynamic signal that adapts to the market's changing conditions, highlighting significant trends and potential turning points.
3. **Signal Line**:
- **Purpose**: The signal line serves as a benchmark for the filtered oscillator values, providing a basis for comparison to determine the current trend's strength.
- **Smoothing**: The signal line is smoothed over a user-defined period to ensure it represents the underlying trend accurately. This smoothing process reduces the noise and allows traders to focus on the more meaningful movements.
4. **Overbought/Oversold Zones**:
- **Purpose**: These zones help traders identify when the market is potentially overstretched and due for a correction. They are crucial for timing entry and exit points.
- **Thresholds**: The user-defined thresholds represent levels where the oscillator values are considered extreme. When the oscillator crosses these levels, it signals that the market may be overbought or oversold.
- **Visual Cues**: The indicator plots these zones on the chart, making it easy for traders to see when the market enters these critical areas. This visualization is vital for spotting potential reversals or continuations in the trend.
5. **Histogram Visualization**:
- **Purpose**: The histogram provides a visual representation of the volatility in the market, making it easier to interpret the oscillator's readings.
- **Color Coding**: The histogram bars are color-coded based on the filtered oscillator's relationship with the signal line. Green bars indicate a positive momentum (bullish), while red bars indicate negative momentum (bearish). This color-coding helps traders quickly assess the market's current state.
- **Intensity of Movement**: The height and color intensity of the histogram bars reflect the strength of the underlying trend. Higher bars with more intense colors signify stronger market movements.
6. **Buy and Sell Signals**:
- **Purpose**: The indicator provides explicit buy and sell signals based on the oscillator's interaction with the signal line and the overbought/oversold thresholds.
- **Buy Signal**: A buy signal is generated when the filtered oscillator crosses above the signal line while in the oversold zone. This suggests that the market may be reversing upwards from an oversold condition.
- **Sell Signal**: Conversely, a sell signal is generated when the filtered oscillator crosses below the signal line while in the overbought zone, indicating a potential downward reversal from an overbought condition.
- **Visual Representation**: These signals are visually represented on the chart with specific symbols, such as green circles for buy signals and red circles for sell signals, making them easy to spot.
### **Usefulness and Applications**
1. **Trend Identification**:
- The indicator is highly effective in identifying the current trend and its strength. By analyzing the relationship between the oscillator and the signal line, traders can determine whether the market is in an uptrend, downtrend, or ranging. The adaptive nature of the filter ensures that the trend signals remain relevant even as market conditions change.
2. **Volatility Analysis**:
- Understanding market volatility is crucial for risk management and strategy development. This indicator provides a clear view of how volatility is evolving, helping traders adjust their strategies accordingly. For example, higher volatility might suggest the need for tighter stop losses or more conservative position sizes.
3. **Overbought/Oversold Detection**:
- The overbought and oversold zones are essential for identifying potential reversal points. These zones can be used to time entries and exits, particularly in markets that are prone to mean reversion. The visual cues provided by the indicator make it easier to spot when the market might be overstretched.
4. **Adaptive Filtering**:
- The adaptive filter is a significant advantage of this indicator. Unlike static filters, which might lag or react too quickly to noise, the adaptive filter adjusts to the market's pace. This makes the indicator versatile, suitable for different market conditions, and less prone to giving false signals.
5. **Visual Clarity**:
- The indicator is designed with visual clarity in mind. The color-coded bars and overbought/oversold zones make it easy to interpret the market's current state at a glance. This is particularly useful for traders who rely on quick decision-making or need to monitor multiple assets simultaneously.
6. **Customizability**:
- The indicator offers several user inputs that allow traders to customize it according to their trading style and market of interest. This includes the length of the volume period, the sensitivity of the adaptive filter, and the thresholds for overbought/oversold conditions. Such flexibility makes it a valuable tool for both short-term traders and long-term investors.
### **Conclusion**
The "Uptrick: Adaptive Volatility Oscillator" is a powerful and versatile indicator that blends volume analysis with adaptive filtering to provide a nuanced view of market trends and volatility. Its ability to identify overbought and oversold conditions, coupled with its adaptive nature, makes it an indispensable tool for traders looking to gain an edge in the markets. Whether you're aiming to spot trend reversals, confirm the strength of ongoing trends, or manage risk through volatility analysis, this indicator offers the insights needed to make informed trading decisions. Its clear visual signals and customizable parameters further enhance its utility, making it suitable for a wide range of trading strategies and market environments.
Multiple EMA Indicator [Pineify]TradingView Multiple EMA Indicator: A Comprehensive Trend Analysis Tool
The TradingView Multiple EMA Indicator is a powerful and versatile tool designed to provide traders with a comprehensive view of market trends across multiple timeframes. By incorporating five Exponential Moving Averages (EMAs) with customizable lengths and sources, this indicator offers a nuanced approach to trend analysis, suitable for both novice and experienced traders.
Key Features:
Five customizable EMAs for multi-timeframe analysis
Flexible source inputs for each EMA
Color-coded plots for easy visual interpretation
Overlay functionality for direct price action comparison
How It Works:
This indicator calculates and displays five separate EMAs on your chart, each with its own customizable length and source. The EMAs are color-coded for easy identification:
EMA-1: Red
EMA-2: Light Green
EMA-3: Light Blue
EMA-4: Purple
EMA-5: Yellow
By default, the indicator uses the following settings:
EMA-1: 10-period EMA of close price
EMA-2: 20-period EMA of close price
EMA-3: 50-period EMA of close price
EMA-4: 100-period EMA of close price
EMA-5: 200-period EMA of close price
However, users can easily adjust these settings to suit their specific trading strategies and preferences.
Trading Ideas and Insights:
The Multiple EMA Indicator offers several ways to analyze market trends and generate trading signals:
Trend Identification: The alignment of the EMAs can help identify the overall trend. When shorter-term EMAs are above longer-term EMAs, it suggests an uptrend, and vice versa for a downtrend.
Dynamic Support and Resistance: Each EMA can act as a dynamic support or resistance level. Price bouncing off these levels can indicate potential entry or exit points.
Crossovers: When a shorter-term EMA crosses above a longer-term EMA, it may signal a bullish trend change. Conversely, a bearish signal may occur when a shorter-term EMA crosses below a longer-term EMA.
Trend Strength: The spacing between the EMAs can indicate trend strength. Wide spacing suggests a strong trend, while narrow spacing or intertwining EMAs may indicate consolidation or a weakening trend.
Multi-Timeframe Analysis: By using different EMA lengths, traders can gain insights into short-term, medium-term, and long-term trends simultaneously.
How to Use the Indicator:
Add the indicator to your chart and adjust the input parameters as needed.
Observe the relative positions of the EMAs to identify the overall trend direction.
Look for potential entry signals when price or shorter-term EMAs cross above or below longer-term EMAs.
Use the EMAs as dynamic support and resistance levels for setting stop-loss and take-profit orders.
Combine the Multiple EMA Indicator with other technical analysis tools, such as oscillators or volume indicators, for more comprehensive trading decisions.
Customization Options:
The indicator offers extensive customization options, allowing traders to tailor it to their specific needs:
Adjust the length of each EMA to focus on different timeframes
Change the source of each EMA (e.g., close, open, high, low, HL2, HLC3, OHLC4)
Modify the color and line thickness of each EMA for better visibility
Conclusion:
The TradingView Multiple EMA Indicator is a versatile and powerful tool for trend analysis and trade decision-making. By providing a multi-faceted view of market trends, it enables traders to make more informed decisions based on a comprehensive understanding of price action across various timeframes.
Remember that while this indicator can be a valuable tool in your trading arsenal, it should not be used in isolation. Always combine it with other forms of analysis and proper risk management techniques for the best results.
We hope this indicator enhances your trading experience and contributes to your success in the markets. Happy trading!

RSI Slope Filtered Signals [UAlgo]The "RSI Slope Filtered Signals " is a technical analysis tool designed to enhance the accuracy of RSI (Relative Strength Index) signals by incorporating slope analysis. This indicator not only considers the RSI value but also analyzes the slope of the RSI over a specified number of bars, providing a more refined signal that accounts for the momentum and trend strength. By utilizing both positive and negative slope arrays, the indicator dynamically adjusts its thresholds, ensuring that signals are responsive to changing market conditions. This tool is particularly useful for traders looking to identify overbought and oversold conditions with a higher degree of precision, filtering out noise and providing clear visual cues for potential market reversals.
🔶 Key Features
Dynamic Slope Analysis: Measures the slope of RSI over a customizable number of bars, offering insights into the momentum and trend direction.
Adaptive Thresholds: Uses historical slope data to calculate dynamic thresholds, adjusting signal sensitivity based on market conditions.
Normalized Slope Calculation: Normalizes the slope values to provide a consistent measure across different market conditions, making the indicator more versatile.
Clear Signal Visualization: The indicator plots both positive and negative normalized slopes with color gradients, visually representing the strength of the trend.
Overbought and Oversold Signals: Plots overbought and oversold signals directly on the chart when the calculated value reaches the user-specified threshold, helping traders identify potential reversal points.
Customizable Settings: Allows users to adjust the RSI length, slope measurement bars, and lookback periods, providing flexibility to tailor the indicator to different trading strategies.
🔶 Interpreting the Indicator
The "RSI Slope Filtered Signals " indicator is designed to be easy to interpret. Here's how you can use it:
Normalized Slope: The indicator plots the normalized slope of the RSI, with values above zero indicating positive momentum and values below zero indicating negative momentum. A higher positive slope suggests a strong upward trend, while a deeper negative slope indicates a strong downward trend.
Reversal Signals: The indicator plots several horizontal lines at different thresholds (+3, +2, +1, 0, -1, -2, -3). These levels are used to gauge the strength of the momentum based on the normalized slope. For example, a normalized slope crossing above the +2 threshold may indicate a strong bullish trend, while crossing below the -2 threshold may suggest a strong bearish trend. These thresholds help in understanding the intensity of the current trend and provide context for interpreting the indicator's signals.
This indicator generates overbought and oversold signals not solely based on the RSI entering extreme levels (above 70 for overbought and below 30 for oversold), but also by considering the behavior of the normalized slope relative to specific thresholds. Specifically, the Overbought Signal (🔽) is triggered when the RSI is above 70 and the normalized slope from the previous bar is greater than or equal to the upper threshold, with the current slope being lower than the previous slope, indicating a potential bearish reversal as momentum may be slowing down.
Similarly, the Oversold Signal (🔼) is generated when the RSI is below 30 and the normalized slope from the previous bar is less than or equal to the lower threshold, with the current slope being higher than the previous slope, signaling a potential bullish reversal as the downward momentum may be weakening.
Area Plots: The indicator also plots the positive and negative slopes as filled areas, providing a quick visual cue for the strength and direction of the trend. Green areas represent positive slopes (upward momentum), while red areas represent negative slopes (downward momentum).
By combining these elements, the "RSI Slope Filtered Signals " provides a comprehensive view of the market's momentum, helping traders make more informed decisions by filtering out false signals and focusing on the significant trends.
🔶 Disclaimer
Use with Caution: This indicator is provided for educational and informational purposes only and should not be considered as financial advice. Users should exercise caution and perform their own analysis before making trading decisions based on the indicator's signals.
Not Financial Advice: The information provided by this indicator does not constitute financial advice, and the creator (UAlgo) shall not be held responsible for any trading losses incurred as a result of using this indicator.
Backtesting Recommended: Traders are encouraged to backtest the indicator thoroughly on historical data before using it in live trading to assess its performance and suitability for their trading strategies.
Risk Management: Trading involves inherent risks, and users should implement proper risk management strategies, including but not limited to stop-loss orders and position sizing, to mitigate potential losses.
No Guarantees: The accuracy and reliability of the indicator's signals cannot be guaranteed, as they are based on historical price data and past performance may not be indicative of future results.

ELMo HeatmapA heatmap display of the Entropy, Liquidity, and Momentum (ELMo) strategy status across a group of tickers.
Background color indicates ELMo's opinion of that row(green - bull, red - bear). White dots indicate bullish signals and black are bearish signals.
Top row is current ticker, remaining 7 rows are each a configurable ticker. The defaults are:
SPY
QQQ
DIA
IWM
BTCUSD
GLD
TLT
If you have appropriate data feeds, I also like the following ticker list:
ES1!
NQ1!
YM1!
RTY1!
BTC1!
GC1!
VX1!

Custom Supertrend Multi-Timeframe Indicator [Pineify]Supertrend Multi-Timeframe Indicator
Introduction
The Supertrend Multi-Timeframe Indicator is an advanced trading tool designed to help traders identify trend directions and potential buy/sell signals by combining Supertrend indicators from multiple timeframes. This script is original in its approach to integrating Supertrend calculations across different timeframes, providing a more comprehensive view of market trends.
Concepts and Calculations
The indicator utilizes the Supertrend algorithm, which is based on the Average True Range (ATR). The Supertrend is a popular tool for trend-following strategies, and this script enhances its capabilities by incorporating data from a larger timeframe.
Supertrend Factor: Determines the sensitivity of the Supertrend line.
ATR Length: Defines the period for calculating the Average True Range.
Larger Supertrend Factor and ATR Length: Applied to the larger timeframe for a broader trend perspective.
Larger Timeframe: The higher timeframe from which the secondary Supertrend data is sourced.
How It Works
The script calculates the Supertrend for the current timeframe using the specified factor and ATR length.
Simultaneously, it requests Supertrend data from a larger timeframe.
Buy and sell signals are generated based on crossovers and crossunders of the Supertrend lines from both timeframes.
Visual cues (up and down arrows) are plotted on the chart to indicate buy and sell signals.
Background colors change to reflect the trend direction: green for an uptrend and red for a downtrend.
Usage
Add the indicator to your TradingView chart.
Customize the Supertrend factors, ATR lengths, and larger timeframe according to your trading strategy.
Enable or disable buy and sell alerts as needed.
Monitor the chart for visual signals and background color changes to make informed trading decisions.
Note: The indicator is best used in conjunction with other technical analysis tools and should not be relied upon as the sole basis for trading decisions.
Conclusion
The Supertrend Multi-Timeframe Indicator offers a unique and powerful way to analyze market trends by leveraging the strengths of the Supertrend algorithm across multiple timeframes. Its customizable settings and clear visual signals make it a valuable addition to any trader's toolkit.

Relative Strength according to Oster (RSO)Overview:
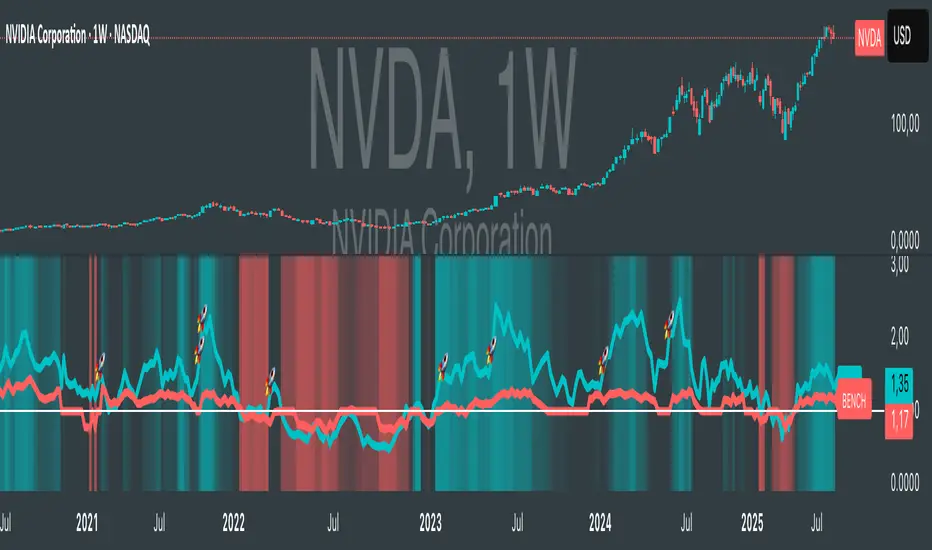
Relative Strength according to Oster (RSO) is an innovative tool that redefines how traders assess an asset's market strength. Moving beyond traditional indicators, RSO offers a sophisticated and highly responsive measure of an asset's potential to continue performing well. By integrating groundbreaking methodologies, RSO equips traders with unparalleled insights into market dynamics, making it an essential tool for anyone looking to stay ahead in today's fast-paced trading environment.
Understanding RSL (Relative Strength according to Levy):
At its core, Relative Strength according to Levy (RSL) is a powerful concept rooted in the idea that an asset currently exhibiting strength is more likely to maintain or even enhance that strength in the future. RSL calculates this by comparing an asset's current price to its moving average, providing a clear picture of its relative performance over time. The further its value is above 1, the higher the market momentum and vice versa. This relationship to the moving average is crucial, as it indicates not just where the asset stands today but also its trajectory in the context of historical performance. The ability to identify assets that consistently outperform is a game-changer for traders, and RSL has long been a cornerstone in this pursuit.
RSO vs. Traditional RSL: A Leap Forward
The RSO takes the traditional RSL concept and propels it into new territory with its innovative correlation-based approach. This is where RSO truly shines, offering a unique and sophisticated analysis that goes far beyond the basics.
Why RSO is Revolutionary:
Correlation Adjustment: The RSO doesn’t just measure an asset’s strength in isolation. Instead, it adjusts its readings based on how closely the asset's price movements correlate with a chosen benchmark. This groundbreaking feature ensures that the RSO is not just reactive to past performance but also predictive of how the asset might behave relative to the broader market, adding a layer of precision that is unparalleled in traditional strength indicators.
Superior Strength Option: With the RSO, traders have the option to include superior strength factors, adding another dimension of insight. This feature allows for more stable and reliable long-term signals. On the flip side, those who prefer a more dynamic trading style can opt to exclude this factor for more frequent, shorter-term signals. This level of customization is rare and sets the RSO apart as a truly adaptable tool.
Enhanced Market Insights: RSO’s correlation-based approach doesn’t just show how strong an asset is—it reveals how that strength is likely to develop in relation to the benchmark's underlying trends. This isn’t merely about comparing performance; it’s about understanding the asset’s potential trajectory in a much broader market context. Such insight is invaluable for making informed, strategic trading decisions.
Practical Application:
The RSO isn’t just innovative in theory; it’s designed for practical, real-world trading. Traders can set customized alerts based on RSO’s readings, ensuring they’re always aware of key buy or sell signals as they occur. The flexibility to include or exclude superior strength factors means that RSO can be tailored to fit any trading style, whether focused on long-term investments or short-term opportunities.
Conclusion:
In conclusion, the Relative Strength according to Oster (RSO) is more than just an indicator; it’s a breakthrough in market analysis. By integrating correlation adjustments and offering unparalleled customization options, RSO provides traders with insights that are both deeper and more actionable than ever before. This innovative tool is designed to empower traders, giving them the edge they need to succeed in an increasingly complex market landscape. Whether you’re a seasoned trader or just starting out, the RSO is a must-have tool for navigating market trends with confidence and precision.
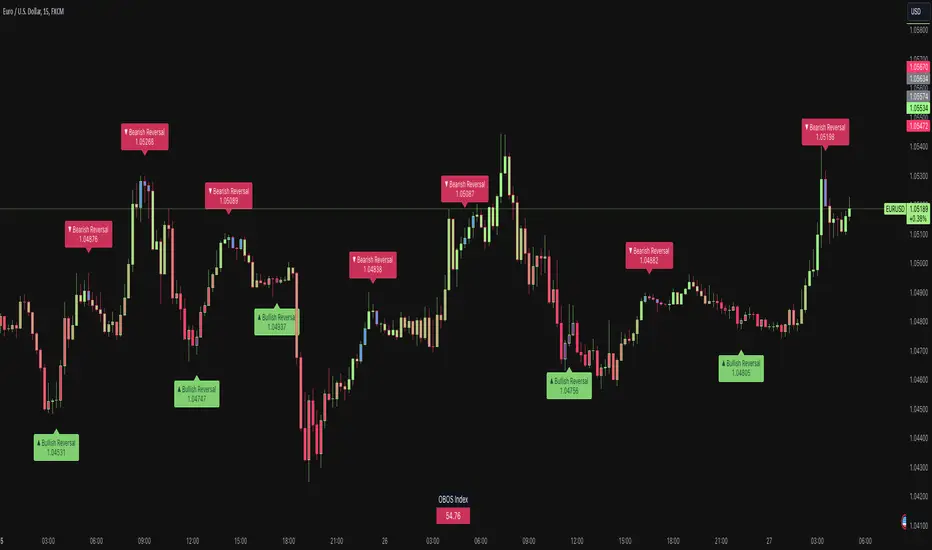
Price & Momentum Reversal Indicator [TradeDots]Price & Momentum Divergence Indicator is a variant of the Chande Momentum Oscillator (CMO), designed to identify reversal patterns in overvalued and undervalued markets. This indicator aims to mitigate the common problem of all oscillating indicators: false buy/sell signals during prolonged market trends, by incorporating a volume-weighted approach and momentum analysis.
📝 HOW IT WORKS
Price Extremeness Calculation
The indicator evaluates the extremeness of the current price by analyzing price changes over a fixed window of candlesticks.
It separates the price changes into positive and negative changes, then multiplies them by the bar volume to obtain volume-weighted values, giving higher significance to bars with larger volumes.
Extremeness Ratio
The ratio is calculated by taking the difference between the total positive changes and total negative changes, and then dividing this result by the sum of the total positive and negative changes.
The result is then smoothed to reduce market noise and rescaled to a range between -100 to 100, where 100 indicates all price changes within the window are positive.
Momentum Analysis
Momentum is calculated by measuring the rate of change of the smoothed extremeness ratio, indicating whether market extremeness is slowing and showing signs of reversion.
Reversal Signal Confirmation
For an asset to be considered a reversal, it has to be in the overvalued or undervalued zone (exceeding the overvalued & undervalued threshold). It must then show a slowed momentum change and a price reversion.
Lastly, candlestick analysis is used to confirm the reversal signal, ensuring there is no room for further breakout price movement.
🛠️ HOW TO USE
Candlestick Visualization
Candlestick bodies are painted with gradient colors representing the smoothed price extremeness (OBOS Index), ranging from -100 (solid red) to 100 (solid green). The exact value is displayed in a table at the bottom right corner.
Slowing price momentum is indicated with blue (bearish) and purple (bullish) colors, showing market pressure from the opposite side.
Reversal Confirmation
A decrease in price momentum combined with a price reversal triggers a signal label on the candlestick, indicating a potential pullback or reversal. This can serve as a reference for better entry and exit points.
⭐️ Premium Features
Higher Timeframe (HTF) Analysis
The indicator includes a feature to apply the same algorithm to a selected higher timeframe, ensuring trend alignment across multiple timeframes.
Alert Functions
Real-time notifications for overvalued and undervalued conditions, allowing traders to monitor trades and reversal signals anywhere and anytime.
❗️LIMITATIONS
Accuracy decreases in volatile and noisy markets.
Extended bullish or bearish market conditions may affect performance.
See Author's instructions below to get instant access to this indicator.
RISK DISCLAIMER
Trading entails substantial risk, and most day traders incur losses. All content, tools, scripts, articles, and education provided by TradeDots serve purely informational and educational purposes. Past performances are not definitive predictors of future results.
Momentum Trend [MT]The Momentum Trend indicator is an innovative technical analysis tool designed to capture and visualize momentum trends in financial markets. This advanced indicator goes beyond traditional momentum measures, offering a unique perspective on price action and trend strength.
Core Functionality:
Trend Momentum Index (TMI) Calculation:
At the heart of this indicator is the Trend Momentum Index (TMI), a proprietary algorithm that combines moving averages with price action analysis to gauge momentum. The TMI is calculated using a user-defined source, length, and moving average type.
Dynamic Trend Visualization:
The indicator uses a color-coded column plot to represent the TMI values, providing an intuitive visual representation of trend strength and direction. The colors change based on specific conditions, offering instant insights into the current market state.
Adaptive Momentum Analysis:
The TMI adapts to changing market conditions by comparing current values to historical ones, allowing for a more nuanced understanding of momentum shifts.
Key Inputs and Their Significance:
TMI Source:
Allows users to select the price data for TMI calculations. The default is the closing price, but users can choose alternative sources for different analytical perspectives.
TMI Length:
Defines the lookback period for the TMI calculation. The default of 8 provides a balance between responsiveness and stability, but users can adjust this to suit their trading style.
Moving Average Type:
Users can select from various moving average types (SMA, EMA, SMMA, WMA, VWMA) for the base calculation, allowing for customization based on trading preferences.
What Makes It Unique:
Comprehensive Momentum Analysis:
The TMI combines elements of trend following and momentum, providing a more holistic view of market dynamics than traditional momentum indicators.
Multi-Faceted Trend Identification:
The color-coding system doesn't just show bullish or bearish trends, but also identifies accelerating and decelerating momentum in both directions.
Flexible Moving Average Integration:
The ability to choose different moving average types allows traders to fine-tune the indicator's responsiveness and smoothness.
Visual Clarity:
The column-style plot with color changes offers clear, at-a-glance insights into trend strength and direction.
Momentum Comparison Logic:
The indicator incorporates logic to compare current momentum changes with recent historical changes, providing context for the current market state.
The Momentum Trend indicator represents a sophisticated approach to momentum and trend analysis. By combining moving averages, price action, and comparative momentum logic, it offers traders a powerful tool for identifying potential trend continuations, reversals, and momentum shifts.
This indicator is particularly valuable for traders looking to:
- Identify the start of new trends
- Spot potential trend reversals
- Gauge the strength of ongoing trends
- Time entries and exits based on momentum shifts

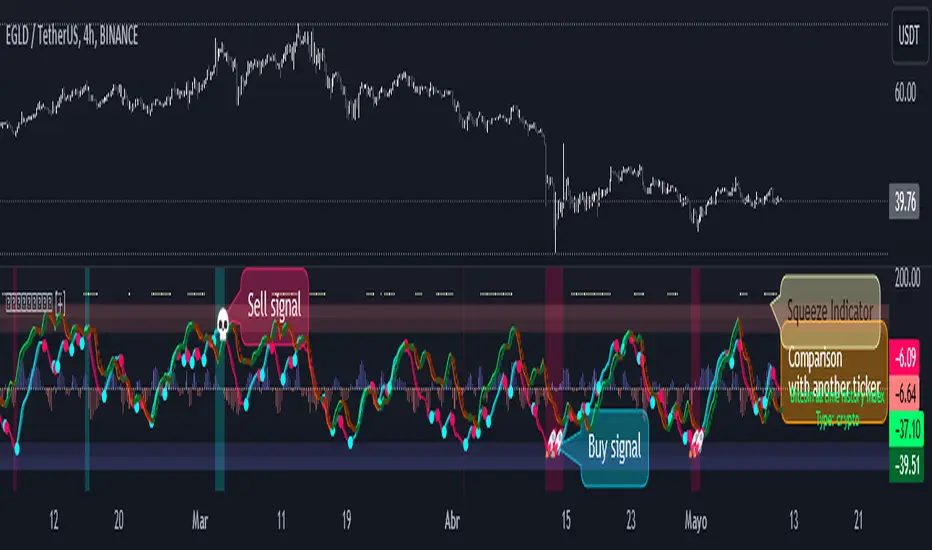
Momentum & Squeeze Oscillator [UAlgo]The Momentum & Squeeze Oscillator is a technical analysis tool designed to help traders identify shifts in market momentum and potential squeeze conditions. This oscillator combines multiple timeframes and periods to provide a detailed view of market dynamics. It enhances the decision-making process for both short-term and long-term traders by visualizing momentum with customizable colors and alerts.
🔶 Key Features
Custom Timeframe Selection: Allows users to select a custom timeframe for oscillator calculations, providing flexibility in analyzing different market periods.
Recalculation Option: Enables or disables the recalculation of the indicator, offering more control over real-time data processing.
Squeeze Background Visualization: Highlights potential squeeze conditions with a background color, helping traders quickly spot consolidation periods.
Adjustable Squeeze Sensitivity: Users can modify the sensitivity of the squeeze detection, tailoring the indicator to their specific trading style and market conditions.
Bar Coloring Condition: Option to color the price bars based on momentum conditions, enhancing the visual representation of market trends.
Threshold Bands: Option to fill threshold bands for a clearer visualization of overbought and oversold levels.
Reference Lines: Display reference lines for overbought, oversold, and mid-levels, aiding in quick assessment of momentum extremes.
Multiple Output Modes: Offers different output visualization modes, including:
ALL: Displays all calculated momentum values (fast, medium, slow).
AVG: Shows the average momentum, providing a consolidated view.
STD: Displays the standard deviation of momentum, useful for understanding volatility.
Alerts: Configurable alerts for key momentum events such as crossovers and squeeze conditions, keeping traders informed of important market changes.
🔶 Usage
The Momentum & Squeeze Oscillator can be used for various trading purposes:
Trend Identification: Use the oscillator to determine the direction and strength of market trends. By analyzing the average, fast, medium, and slow momentum lines, traders can gain insights into short-term and long-term market movements.
Squeeze Detection: The indicator highlights periods of low volatility (squeeze conditions) which often precede significant price movements. Traders can use this information to anticipate and prepare for potential breakouts.
Overbought/Oversold Conditions: The oscillator helps identify overbought and oversold conditions, indicating potential reversal points. This is particularly useful for timing entry and exit points in the market.
Momentum Shifts: By monitoring the crossover of momentum lines with key levels (e.g., the 50 level), traders can spot shifts in market momentum, allowing them to adjust their positions accordingly.
🔶 Disclaimer:
Use with Caution: This indicator is provided for educational and informational purposes only and should not be considered as financial advice. Users should exercise caution and perform their own analysis before making trading decisions based on the indicator's signals.
Not Financial Advice: The information provided by this indicator does not constitute financial advice, and the creator (UAlgo) shall not be held responsible for any trading losses incurred as a result of using this indicator.
Backtesting Recommended: Traders are encouraged to backtest the indicator thoroughly on historical data before using it in live trading to assess its performance and suitability for their trading strategies.
Risk Management: Trading involves inherent risks, and users should implement proper risk management strategies, including but not limited to stop-loss orders and position sizing, to mitigate potential losses.
No Guarantees: The accuracy and reliability of the indicator's signals cannot be guaranteed, as they are based on historical price data and past performance may not be indicative of future results.

Uptrick: Bullish/Bearish Signal DetectorDetailed Explanation of the "Uptrick: Bullish/Bearish Signal Detector" Script
The "Uptrick: Bullish/Bearish Signal Detector" script is a sophisticated tool designed for the TradingView platform, leveraging Pine Script version 5. This script is crafted to enhance traders' ability to identify bullish (buy) and bearish (sell) signals directly on their trading charts. By combining the power of the MACD (Moving Average Convergence Divergence) and RSI (Relative Strength Index) indicators, this script provides a unique and efficient method for detecting potential trading opportunities. Below is an in-depth exploration of its purpose, features, and functionality.
Purpose
The primary purpose of this script is to assist traders in identifying potential entry and exit points in the market by signaling bullish and bearish conditions. This automated detection helps traders make more informed decisions without the need to manually analyze complex indicators. By overlaying signals directly on the price chart, the script allows for quick visual identification of market trends and reversals.
Uniqueness
What sets this script apart is its dual use of MACD and RSI indicators. While many trading strategies might rely on a single indicator, combining MACD and RSI enhances the reliability of the signals by filtering out false positives. The script not only identifies trends but also adds a layer of confirmation through the RSI, which measures the speed and change of price movements.
Inputs and Features
Customizable Label Appearance:
The script allows users to customize the appearance of the labels that indicate bullish and bearish signals. Users can set their preferred colors for the labels and the text, ensuring that the signals are easily distinguishable and aesthetically pleasing on their charts.
MACD Calculation:
The script calculates the MACD line and signal line using user-defined input values for the fast length, slow length, and signal length. The MACD histogram, which is the difference between the MACD line and the signal line, is used to determine the momentum of the market.
RSI Calculation:
The RSI is calculated using a user-defined input length. The RSI helps in identifying overbought or oversold conditions, which are crucial for confirming the strength of the trend detected by the MACD.
Bullish and Bearish Conditions:
The script defines bullish conditions as those where the MACD histogram is positive and the RSI is above 50. Bearish conditions are defined where the MACD histogram is negative and the RSI is below 50. This combination of conditions ensures that signals are generated based on both momentum and relative strength, reducing the likelihood of false signals.
Label Plotting:
The script plots labels on the chart to indicate bullish and bearish signals. When a bullish condition is met, and the previous signal was not bullish, a "LONG" label is plotted. Similarly, when a bearish condition is met, and the previous signal was not bearish, a "SHORT" label is plotted. This feature helps in clearly marking the points of interest for traders, making it easier to spot potential trades.
Tracking Previous Signals:
To avoid repetitive signals, the script keeps track of the last signal. If the last signal was bullish, it avoids plotting another bullish signal immediately. The same logic applies to bearish signals. This tracking ensures that signals are spaced out and only significant changes in market conditions are highlighted.
How It Works
The script operates in a loop, processing each bar (or candlestick) on the chart as new data comes in. It calculates the MACD and RSI values for each bar and checks if the current conditions meet the criteria for a bullish or bearish signal. If a signal is detected and it is different from the last signal, a label is plotted on the chart at the current bar's price level. This real-time processing allows traders to see the signals as they form, providing timely insights into market movements.
Practical Application
For practical use, a trader would add this script to their TradingView chart. They can customize the input parameters for the MACD and RSI calculations to fit their trading strategy or preferred settings. Once added, the script will automatically analyze the price data and start plotting "LONG" and "SHORT" labels based on the detected signals. Traders can then use these labels to make decisions on entering or exiting trades, adjusting their strategy as necessary based on the signals provided.
Conclusion
The "Uptrick: Bullish/Bearish Signal Detector" script is a powerful tool for any trader looking to leverage technical indicators for better trading decisions. By combining MACD and RSI, it offers a robust method for detecting market trends and potential reversals. The customizable features and real-time signal plotting make it a versatile and user-friendly addition to any trading toolkit. This script not only simplifies the process of technical analysis but also enhances the accuracy of trading signals, thereby potentially increasing the trader's success rate in the market.

Six PillarsGeneral Overview
The "Six Pillars" indicator is a comprehensive trading tool that combines six different technical analysis methods to provide a holistic view of market conditions.
These six pillars are:
Trend
Momentum
Directional Movement (DM)
Stochastic
Fractal
On-Balance Volume (OBV)
The indicator calculates the state of each pillar and presents them in an easy-to-read table format. It also compares the current timeframe with a user-defined comparison timeframe to offer a multi-timeframe analysis.
A key feature of this indicator is the Confluence Strength meter. This unique metric quantifies the overall agreement between the six pillars across both timeframes, providing a score out of 100. A higher score indicates stronger agreement among the pillars, suggesting a more reliable trading signal.
I also included a visual cue in the form of candle coloring. When all six pillars agree on a bullish or bearish direction, the candle is colored green or red, respectively. This feature allows traders to quickly identify potential high-probability trade setups.
The Six Pillars indicator is designed to work across multiple timeframes, offering a comparison between the current timeframe and a user-defined comparison timeframe. This multi-timeframe analysis provides traders with a more comprehensive understanding of market dynamics.
Origin and Inspiration
The Six Pillars indicator was inspired by the work of Dr. Barry Burns, author of "Trend Trading for Dummies" and his concept of "5 energies." (Trend, Momentum, Cycle, Support/Resistance, Scale) I was intrigued by Dr. Burns' approach to analyzing market dynamics and decided to put my own twist upon his ideas.
Comparing the Six Pillars to Dr. Burns' 5 energies, you'll notice I kept Trend and Momentum, but I swapped out Cycle, Support/Resistance, and Scale for Directional Movement, Stochastic, Fractal, and On-Balance Volume. These changes give you a more dynamic view of market strength, potential reversals, and volume confirmation all in one package.
What Makes This Indicator Unique
The standout feature of the Six Pillars indicator is its Confluence Strength meter. This feature calculates the overall agreement between the six pillars, providing traders with a clear, numerical representation of signal strength.
The strength is calculated by considering the state of each pillar in both the current and comparison timeframes, resulting in a score out of 100.
Here's how it calculates the strength:
It considers the state of each pillar in both the current timeframe and the comparison timeframe.
For each pillar, the absolute value of its state is taken. This means that both strongly bullish (2) and strongly bearish (-2) states contribute equally to the strength.
The absolute values for all six pillars are summed up for both timeframes, resulting in two sums: current_sum and alternate_sum.
These sums are then added together to get a total_sum.
The total_sum is divided by 24 (the maximum possible sum if all pillars were at their strongest states in both timeframes) and multiplied by 100 to get a percentage.
The result is rounded to the nearest integer and capped at a minimum of 1.
This calculation method ensures that the Confluence Strength meter takes into account not only the current timeframe but also the comparison timeframe, providing a more robust measure of overall market sentiment. The resulting score, ranging from 1 to 100, gives traders a clear and intuitive measure of how strongly the pillars agree, with higher scores indicating stronger potential signals.
This approach to measuring signal strength is unique in that it doesn't just rely on a single aspect of price action or volume. Instead, it takes into account multiple factors, providing a more robust and reliable indication of potential market moves. The higher the Confluence Strength score, the more confident traders can be in the signal.
The Confluence Strength meter helps traders in several ways:
It provides a quick and easy way to gauge the overall market sentiment.
It helps prioritize potential trades by identifying the strongest signals.
It can be used as a filter to avoid weaker setups and focus on high-probability trades.
It offers an additional layer of confirmation for other trading strategies or indicators.
By combining the Six Pillars analysis with the Confluence Strength meter, I've created a powerful tool that not only identifies potential trading opportunities but also quantifies their strength, giving traders a significant edge in their decision-making process.
How the Pillars Work (What Determines Bullish or Bearish)
While developing this indicator, I selected and configured six key components that work together to provide a comprehensive view of market conditions. Each pillar is set up to complement the others, creating a synergistic effect that offers traders a more nuanced understanding of price action and volume.
Trend Pillar: Based on two Exponential Moving Averages (EMAs) - a fast EMA (8 period) and a slow EMA (21 period). It determines the trend by comparing these EMAs, with stronger trends indicated when the fast EMA is significantly above or below the slow EMA.
Directional Movement (DM) Pillar: Utilizes the Average Directional Index (ADX) with a default period of 14. It measures trend strength, with values above 25 indicating a strong trend. It also considers the Positive and Negative Directional Indicators (DI+ and DI-) to determine trend direction.
Momentum Pillar: Uses the Moving Average Convergence Divergence (MACD) with customizable fast (12), slow (26), and signal (9) lengths. It compares the MACD line to the signal line to determine momentum strength and direction.
Stochastic Pillar: Employs the Stochastic oscillator with a default period of 13. It identifies overbought conditions (above 80) and oversold conditions (below 20), with intermediate zones between 60-80 and 20-40.
Fractal Pillar: Uses Williams' Fractal indicator with a default period of 3. It identifies potential reversal points by looking for specific high and low patterns over the given period.
On-Balance Volume (OBV) Pillar: Incorporates On-Balance Volume with three EMAs - short (3), medium (13), and long (21) periods. It assesses volume trends by comparing these EMAs.
Each pillar outputs a state ranging from -2 (strongly bearish) to 2 (strongly bullish), with 0 indicating a neutral state. This standardized output allows for easy comparison and aggregation of signals across all pillars.
Users can customize various parameters for each pillar, allowing them to fine-tune the indicator to their specific trading style and market conditions. The multi-timeframe comparison feature also allows users to compare pillar states between the current timeframe and a user-defined comparison timeframe, providing additional context for decision-making.
Design
From a design standpoint, I've put considerable effort into making the Six Pillars indicator visually appealing and user-friendly. The clean and minimalistic design is a key feature that sets this indicator apart.
I've implemented a sleek table layout that displays all the essential information in a compact and organized manner. The use of a dark background (#030712) for the table creates a sleek look that's easy on the eyes, especially during extended trading sessions.
The overall design philosophy focuses on presenting complex information in a simple, intuitive format, allowing traders to make informed decisions quickly and efficiently.
The color scheme is carefully chosen to provide clear visual cues:
White text for headers ensures readability
Green (#22C55E) for bullish signals
Blue (#3B82F6) for neutral states
Red (#EF4444) for bearish signals
This color coding extends to the candle coloring, making it easy to spot when all pillars agree on a bullish or bearish outlook.
I've also incorporated intuitive symbols (↑↑, ↑, →, ↓, ↓↓) to represent the different states of each pillar, allowing for quick interpretation at a glance.
The table layout is thoughtfully organized, with clear sections for the current and comparison timeframes. The Confluence Strength meter is prominently displayed, providing traders with an immediate sense of signal strength.
To enhance usability, I've added tooltips to various elements, offering additional information and explanations when users hover over different parts of the indicator.
How to Use This Indicator
The Six Pillars indicator is a versatile tool that can be used for various trading strategies. Here are some general usage guidelines and specific scenarios:
General Usage Guidelines:
Pay attention to the Confluence Strength meter. Higher values indicate stronger agreement among the pillars and potentially more reliable signals.
Use the multi-timeframe comparison to confirm signals across different time horizons.
Look for alignment between the current timeframe and comparison timeframe pillars for stronger signals.
One of the strengths of this indicator is it can let you know when markets are sideways – so in general you can know to avoid entering when the Confluence Strength is low, indicating disagreement among the pillars.
Customization Options
The Six Pillars indicator offers a wide range of customization options, allowing traders to tailor the tool to their specific needs and trading style. Here are the key customizable elements:
Comparison Timeframe:
Users can select any timeframe for comparison with the current timeframe, providing flexibility in multi-timeframe analysis.
Trend Pillar:
Fast EMA Period: Adjustable for quicker or slower trend identification
Slow EMA Period: Can be modified to capture longer-term trends
Momentum Pillar:
MACD Fast Length
MACD Slow Length
MACD Signal Length These can be adjusted to fine-tune momentum sensitivity
DM Pillar:
ADX Period: Customizable to change the lookback period for trend strength measurement
ADX Threshold: Adjustable to define what constitutes a strong trend
Stochastic Pillar:
Stochastic Period: Can be modified to change the sensitivity of overbought/oversold readings
Fractal Pillar:
Fractal Period: Adjustable to identify potential reversal points over different timeframes
OBV Pillar:
Short OBV EMA
Medium OBV EMA
Long OBV EMA These periods can be customized to analyze volume trends over different timeframes
These customization options allow traders to experiment with different settings to find the optimal configuration for their trading strategy and market conditions. The flexibility of the Six Pillars indicator makes it adaptable to various trading styles and market environments.

20-day High BreakoutOverview:
The 20-day High Breakout Indicator is a very simple yet powerful tool designed for traders seeking to capitalize on significant price movements in the stock market. This indicator identifies potential buy and sell signals based on a stock's 20-day high breakout levels, making it an essential addition to your trading strategy.
Key Features:
Swing Period Input: Customize the swing period to your preferred number of days, with a default of 20 days, allowing flexibility based on your trading style.
Trailing Stop Level: Automatically calculates the trailing stop level based on the highest high and lowest low within the defined swing period, helping to manage risk and lock in profits.
Buy and Sell Signals: Generates clear buy signals when the price crosses above the trailing stop level and sell signals when the price crosses below, enabling timely entries and exits.
Visual Indicators: Plots buy signals as green upward triangles below the bars and sell signals as red downward triangles above the bars, providing easy-to-interpret visual cues directly on the chart.
How It Works:
Resistance and Support Levels: The indicator calculates the highest high (resistance) and lowest low (support) over the defined swing period.
Swing Direction: It determines the market direction by comparing the current closing price to the previous resistance and support levels.
Trailing Stop Calculation: Depending on the market direction, the trailing stop level is set to either the support or resistance level.
Signal Generation: Buy and sell signals are generated based on the crossover of the closing price and the trailing stop level, filtered to ensure only valid signals are displayed.
Visual Representation: The trailing stop level is plotted as a line, and buy/sell signals are marked with respective shapes for easy identification.
Usage:
Trend Following: Ideal for traders looking to follow trends and catch significant breakouts in the stock price.
Risk Management: Helps in managing risk by providing a trailing stop level that adjusts with market movements.
Visual Clarity: The clear visual signals make it easy for traders to interpret and act upon the indicator's signals.
Add the 20-day High Breakout Indicator to your TradingView charts to enhance your trading strategy and gain an edge in identifying profitable trading opportunities.

KNN OscillatorOverview
The KNN Oscillator is an advanced technical analysis tool designed to help traders identify potential trend reversals and market momentum. Using the K-Nearest Neighbors (KNN) algorithm, this oscillator normalizes KNN values to create a dynamic and responsive indicator. The oscillator line changes color to reflect the market sentiment, providing clear visual cues for trading decisions.
Key Features
Dynamic Color Oscillator: The line changes color based on the oscillator value – green for positive, red for negative, and grey for neutral.
Advanced KNN Algorithm: Utilizes the K-Nearest Neighbors algorithm for precise trend detection.
Normalized Values: Ensures the oscillator values are normalized to align with the stock price range, making it applicable to various assets.
Easy Integration: Can be easily added to any TradingView chart for enhanced analysis.
How It Works
The KNN Oscillator leverages the K-Nearest Neighbors algorithm to calculate the average distance of the nearest neighbors over a specified period. These values are then normalized to match the stock price range, ensuring they are comparable across different assets. The oscillator value is derived by taking the difference between the normalized KNN values and the source price. The line's color changes dynamically to provide an immediate visual indication of the market's state:
Green: Positive values indicate upward momentum.
Red: Negative values indicate downward momentum.
Grey: Neutral values indicate a stable or consolidating market.
Usage Instructions
Trend Reversal Detection: Use the color changes to identify potential trend reversals. A shift from red to green suggests a bullish reversal, while a shift from green to red indicates a bearish reversal.
Momentum Analysis: The oscillator's value and color help gauge market momentum. Strong positive values (green) indicate strong upward momentum, while strong negative values (red) indicate strong downward momentum.
Market Sentiment: The dynamic color changes provide an easy-to-understand visual representation of market sentiment, helping traders make informed decisions quickly.
Confirmation Tool: Use the KNN Oscillator in conjunction with other technical indicators to confirm signals and improve the accuracy of your trades.
Scalability: Applicable to various timeframes and asset classes, making it a versatile tool for all types of traders.

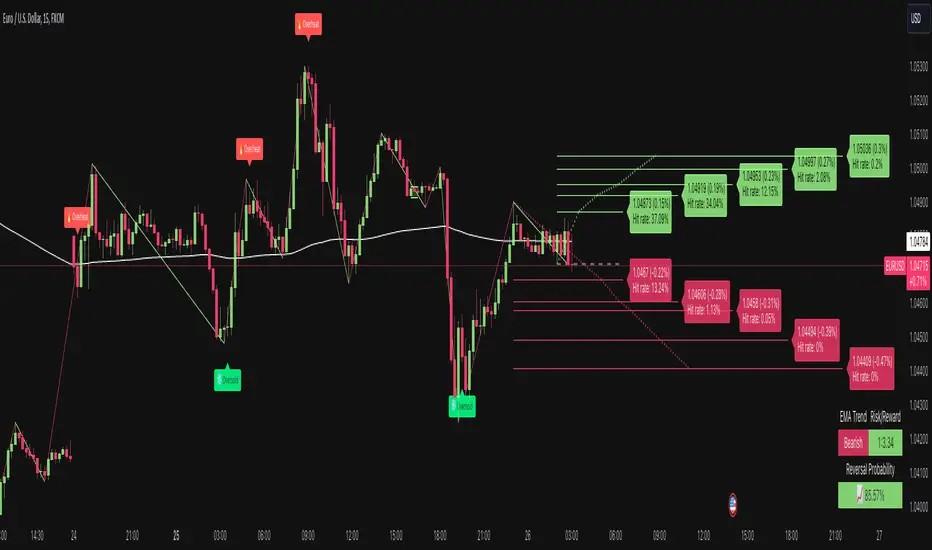
Price Reversal Probability + Price Forecast [TradeDots]The TradeDots Price Reversal Probability + Price Forecast Indicator helps traders discern market direction and identify potential trading opportunities.
📝 HOW IT WORKS
The indicator provides two types of reversal signals:
Bullish Reversal: Marked with a green label, indicating an expected upward market reversal.
Bearish Reversal: Marked with a red label, indicating an expected downward market reversal.
⭐️ Computation
This tool identifies significant reversal patterns using a mathematical model on a designated window of candlesticks to calculate price action changes. It incorporates candlestick data and price indicators, such as the Open, Close, High, Low of candlesticks and Average True Range (ATR), to detect similar occurrences in real-time.
Potential market turning points are marked with reversal labels and percentage changes , calculated using pivot high or low price data from the last reversal patterns of the opposite side.
For example, a green label on the chart indicates a bullish reversal pattern, showing the market is expected to reverse upward. However, signals are based on historical price actions and are not 100% accurate. If the price breaks down from the bullish reversal pivot low, the original signal will turn half transparent until the next reversal pattern is detected.
The algorithm groups consecutive bullish reversal patterns until a bearish reversal pattern appears. The last bullish label occurrence indicates the maximum number of bullish patterns required to confirm a reversal in the group. This information is stored to apply Bayesian statistical models and probability models to generate market insights.
⭐️ Statistical Analysis
Reversal signals are categorized into bullish and bearish groups, with each group storing consecutive reversal signals.
In the indicator table, each new reversal is labeled sequentially (e.g., "🟢 #1" for the first bullish reversal after a bearish signal). The number increases for each new signal on the same side and resets when a reversal signal on the opposite side appears.
The indicator provides two forecasts: the probability of reversal and the expected price change if the pattern is successful or unsuccessful.
⭐️ Probability of Reversal
By counting the number of consecutive reversal patterns on one side before a reversal pattern on the opposite side appears, we can calculate the probability of reversal of each signal throughout the entire price action history.
Using Bayes’ Theorem, the probability increases with each consecutive pattern. The values are displayed in the first two columns of the indicator table, with the current condition highlighted in orange.
⭐️ Price Forecast
The price forecast uses the pivot point of the last reversal pattern of the opposite side as a reference for calculating the percentage change.
For example, for a group of bullish patterns, the pivot high of the most recent bearish pattern is taken. A percentage is calculated with the pivot low of all bullish patterns in the same group. Repeating this model throughout the entire historical price action patterns gives the average price percentage difference between all bearish and bullish patterns.
Whenever a new reversal pattern is detected, a price can be forecasted using the percentage difference from the statistical model. The target price is calculated and displayed in the third and fourth columns of the indicator table.
Assisting Traders To Make Data-Informed Trading Decisions
All included features in this indicator:
Labeling of bullish and bearish reversal patterns
Success probability of each reversal pattern
Price targets of each reversal pattern
Visual aid for pattern confirmation
More (check the changelog below for current features)
🛠️ HOW TO USE
⭐️ Reversal Signals
There are two types of reversal signals identified by the algorithm that detects reversal patterns using price action analysis with candlestick data and price indicators. When the price breaks out from the labeled pivot, the label will turn half transparent.
Bullish reversal signals: Labeled in green. The number represents the price of the candlestick "low," and the percentage value indicates the price difference from the previous bearish reversal pattern's candlestick "high."
Bearish reversal signals: Labeled in red. The number represents the price of the candlestick "high," and the percentage value indicates the price difference from the previous bullish reversal pattern's candlestick "low."
⭐️ Probability Table
The probability table shows the likelihood of reversal for each number of occurrences of bullish and bearish reversal signals, displayed in the first two columns.
It also shows the target prices for both bullish and bearish conditions for each number of reversal patterns.
⭐️ Price Targets
By combining the probability of reversal and the price forecast, price targets for new reversal patterns are calculated. These insights help traders align their strategies with price action analysis and statistics by simply observing the candlestick chart in real-time.
Bullish Price Target: The average percentage price and probability that the next bearish reversal signal might hit.
Bearish Price Target: The average percentage price and probability that the next bullish reversal signal might hit.
⭐️ Market Trend Panel
The market trend panel is a small table that indicates the market trend using a 200 Exponential Moving Average (EMA) alongside reversal signals. A bullish reversal pattern above the moving average indicates a "bullish" market, while a bearish reversal pattern below it indicates a "bearish" market. If the price fluctuates around the moving average, it is identified as "choppy."
The panel also shows the risk and reward for each trade by taking the closing bullish and bearish targets from the most recent reversal pattern's price reference. Lastly, it displays the probability of reversal, consistent with the number highlighted in the probability table.
⭐️ Other Visual Aid
Other visual aids visualize the market trend and potential direction for users on the candlestick chart.
Background colors reflect the current market trend (green = bullish, red = bearish, blue = choppy).
A white plotted line represents the moving average for categorizing market trends.
❗️LIMITATIONS
Price targets represent only the mean of percentage differences. Therefore, the price could reverse before hitting either side of the price target.
When the market is in extreme price action or a new market pattern, the price targets may not be forecasted accurately and might move out of the model's range.
This model works best for assets with less price variation and a near-Gaussian distribution in returns. It may be less accurate for assets with random price movements.
CONCLUSION
This indicator uses fundamental statistics and mathematical models to generate reversal probabilities and price forecasts. It does not have the ability to predict the future with certainty. Traders should combine this indicator with other confirmation strategies to make informed investment decisions.
See Author's instructions below to get instant access to this indicator.
RISK DISCLAIMER
Trading entails substantial risk, and most day traders incur losses. All content, tools, scripts, articles, and education provided by TradeDots serve purely informational and educational purposes. Past performances are not definitive predictors of future results.
NOTES*
Calculations are based on historical data and do not guarantee future results.
Reversals exceeding ten consecutive occurrences are rare (likely <1% of total occurrences).
Users SHOULD NOT blindly follow the price targets as their trading strategy.
If you encounter a timeout with this indicator, reapply it to your chart.
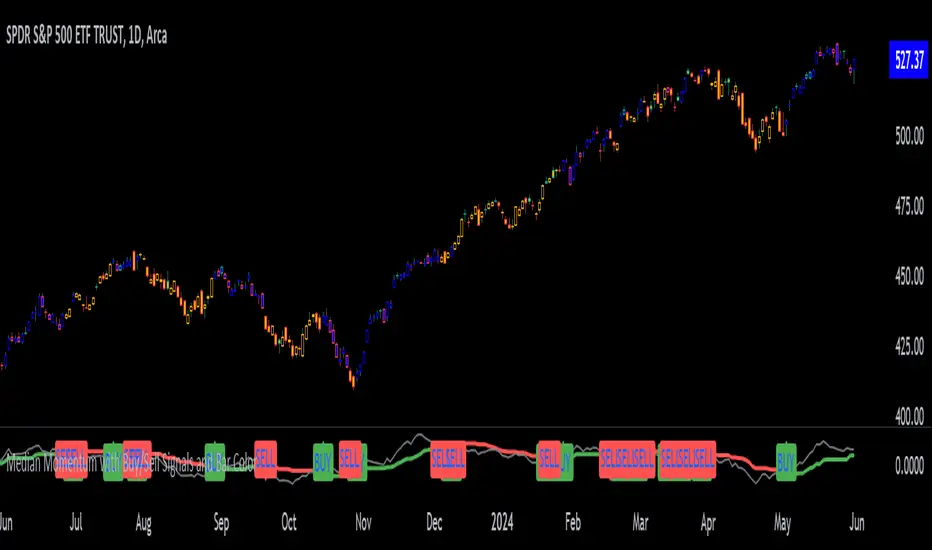
Median Momentum with Buy/Sell Signals and Bar ColorMomentum Calculation:
Momentum is calculated as the difference between the current close price and the close price momentum_length periods ago: momentum = close - close .
Highest and Lowest Momentum:
The highest and lowest momentum values over the specified length are calculated.
Median Momentum:
The median momentum is calculated as the average of the highest and lowest momentum values.
Color Setting:
medianColor is set based on whether the momentum is above, below, or equal to the median momentum.
barColor is set similarly for bar coloring.
Plotting:
The script plots the median momentum and the actual momentum values.
Buy and sell signals are generated when momentum crosses over or under the median momentum.
The script also plots the buy and sell signals with arrows on the chart.
MMI (Multi.Index.Indicator)Multi-Index Momentum Indicator (MMI)
The Multi-Index Momentum Indicator (MMI) is a custom TradingView Pine Script indicator designed to calculate and display the momentum difference between the base and quote indexes of various currency pairs. This indicator helps traders identify the relative strength or weakness of a currency pair by comparing the momentum of its base and quote indexes.
Features:
Currency Pair Detection: The indicator automatically detects the currency pair of the current chart and selects the appropriate base and quote indexes for that pair.
Index Data Retrieval: It fetches the closing prices of the base and quote indexes for the specified timeframe.
Momentum Calculation:
The indicator calculates the 14-period momentum for both the base and quote indexes and then computes the momentum difference.
Visual Representation: The momentum difference is plotted on the chart as a colored line. If the momentum difference is positive, the line is green; if negative, the line is red.
Data Availability Check:
The script checks if the index data is available. If any index data is missing, the script displays a red label on the chart indicating which index data is missing.
Zero Line: A horizontal line at the zero level is plotted for reference.
Supported Currency Pairs and Their Indexes:
USDJPY: Base Index - DXY, Quote Index - JPYX
EURUSD: Base Index - EXY, Quote Index - DXY
GBPUSD: Base Index - BXY, Quote Index - DXY
AUDUSD: Base Index - AXY, Quote Index - DXY
USDCHF: Base Index - DXY, Quote Index - SXY
USDCAD: Base Index - DXY, Quote Index - CXY
GBPJPY: Base Index - BXY, Quote Index - JPYX

WaveTrend Oscillator PlusThe WaveTrend based on “Enhanced WaveTrend” of EliCobra. The WaveTrend Oscillator is a popular technical analysis tool used to identify overbought and oversold conditions in the market and generate trading signals. This indicator introduces additional features for improved analysis and comparison across assets.
WaveTrend:
The original WaveTrend indicator calculates two lines based on exponential moving averages and their relationship to the asset's price. The first line measures the distance between the asset's price and its EMA, while the second line smooths the first line over a specific period. The result is divided by 0.015 multiplied by the smoothed difference ('d' for reference). The indicator aims to identify overbought and oversold conditions by analyzing the relationship between the two lines.
In the original formula, the rudimentary estimation factor 0.015 times 'd' fails to accomodate for approximately a quarter of the data, preventing the indicator from reaching the traditional stationary levels of +-100. This limitation renders the indicator quantitatively biased, as it relies on the user's subjective adjustment of the levels. The enhanced version replaces this factor with the standard deviation of the asset's price, resulting in improved estimation accuracy and provides a more dynamic and robust outcome, we thereafter multiply the result by 100 to achieve a more traditional oscillation.
Enhancements and Features:
Dynamic Estimation: The original indicator uses an arbitrary estimation factor, while the enhanced version replaces it with the standard deviation of the asset's price. This modification provides a more dynamic and accurate estimation, adapting to the specific price characteristics of each asset.
Stationary Support and Resistance Levels: The enhanced version provides stationary key support and resistance levels that range from -150 to 150. These levels are determined based on the analysis of the indicator's data and encompass more than 95% of the indicator's values. These levels offer important reference points for traders to identify potential price reversals or significant price movements.
Comparison Across Assets: The enhanced version allows for better comparison and analysis across different assets. By incorporating the standard deviation of the asset's price, the indicator provides a more consistent and comparable interpretation of the market conditions across multiple assets.
Z-Score Analysis:
The Z-Score is a statistical measurement that quantifies how far a particular data point deviates from the mean in terms of standard deviations. In the enhanced version, the calculation involves determining the basis (mean) and deviation (standard deviation) of the asset's price to calculate its Z-Score, thereafter applying a smoothing technique to generate the final WaveTrend value.
Utility:
The offers traders and investors valuable insights into overbought and oversold conditions in the market. By analyzing the indicator's values and referencing the stationary support and resistance levels, traders can identify potential trend reversals, evaluate market strength, and make better informed analysis.
The following indicators were added:
⎆⎆ Squeeze Momentum Indicator
⎆⎆ Elliott Wave Oscillator
⎆⎆ Expert Trend Locator
Trade Scanner Pro [MarketSignalsPro]
█ OVERVIEW
Trade Scanner Pro is a trade signal generator based on my trend following momentum reversal system. It identifies a pullback and then confirms momentum exhaustion which produces a signal appearing as a set of suggested orders (horizontal lines) on the chart. The goal is to help traders capitalize on price momentum while simplifying decision making and offering a way to gauge expectations. It can be used for any market, any time frame and configured for counter trend signals also.
█ CONCEPT
While markets are highly random, especially on smaller time frames, trends do exist.
Trade Scanner Pro offers a visually structured way to align the user
with price momentum that is relevant to the trend. It accomplishes this by incorporating a unique mix of standard technical formulas to identify a pullback followed by a momentum reversal. The process occurs in 3 steps:
1 — Identifying the trend of the current time frame.
2 — Evaluating the retrace in terms of how far it moves away from the typical price.
3 — Confirming price exhaustion by recognizing a reversal in price momentum.
Once the criteria are met, a signal appears as a blue horizontal line. This is the entry price suggestion (see label). Stop and take profit orders are also calculated simultaneously. These appear as a red line and green line respectively with price labels. The stop and take profit orders are based upon an average of previous price ranges and will be relative to the price action on the chosen time frame. The initial reward/risk ratio is set to 1.5:1, and can be changed in the settings menu.
This system can also be adjusted to cater to the experience level of the trader. For example, more advanced traders can select “counter trend” mode which will only show signals on the opposite side of the trend. A trailing stop can be activated to help stay in a trade after reaching the profit level. There is also a “heads up” mode which colors the candles orange which means a signal is more likely to appear over the next couple of candles. More on these features in the next section.
For best results, time frames of 1 minute and above should be considered. The smaller the time frame, the more signals, but also more noise and stop outs. Knowing your
market and the most active time of day is especially important for smaller time frames.
█ FEATURES
The following features can be found in the settings menu of Trade Scanner Pro.
Show Trend:
The initial setting is “on”. This shows the trend label on the upper right corner of the screen. Trend can be either bullish or bearish. At times there will be a “conflict” label that appears below the trend label. Conflict means the trend MAY be in the process of changing. This occurs when price persists against the prevailing trend for a prolonged amount of time.
Counter Trend:
When selected will ignore signals on the side of the trend and show counter trend signals only. If the “heads up” feature is selected, orange candles will only appear for potential counter trend signals.
Trailing Stop:
When selected, a trailing stop order suggestion (orange line) will appear beginning from the stop loss price (red line) after a few closed candles. The trailing stop line will follow the price upon each new close of the candles until it is touched. This serves as a point of reference to capture larger market movements and skew reward/risk favorably over time.
Heads Up:
When selected will paint orange candles when there is a greater chance a signal will appear. For example, in trend mode it will only evaluate signals on the side of the trend. In counter trend mode it will evaluate counter trend signals only. For advanced users, this “pre signal” can offer potential opportunities to enter a trade before the signal appears.
Reward Ratio:
This is the reward part of the reward/risk formula used to establish the take profit suggestion on the chart. Initially it is set at 1.5 which produces a line on the chart at a 1.5:1 ratio. The user can change this setting to better align with their expectations. For example, if a larger market movement is anticipated, 2 can be entered into the input field and will generate a take profit line 2X farther than the stop loss line (2:1 reward/risk).
█ LIMITATIONS
Markets are HIGHLY random, especially on smaller time frames. No system that is based on public domain formulas can be expected to be HIGHLY accurate. It is reasonable to expect a 50% win rate more often than not. Profitability in such systems depends on the reward/risk rather than win rate.
This is a system based on price momentum which means MOMENTUM must be present for best results especially on very short time frames.
While this system helps to reduce the burden of analysis, the user should have some basic familiarity with technical analysis. Basic knowledge can help to better determine a quality signal over noise.
█ RAMBLINGS
The stop loss orders MUST be respected otherwise the user puts their entire account at risk. Signals can appear at price locations where larger magnitude risk is extremely high. Respecting the stop loss suggestions can help to mitigate this risk.
For best results set up notifications to receive a message on your desktop, smart phone or tablet rather than sitting in front of a computer screen waiting for a signal to appear. Keep in mind a 1 minute chart in a single market can produce 5 or 6 signals throughout the entire daily session and NOT all will be profitable. A 1 hour time frame may produce 1 or 2 throughout the day. The larger the time frame the lower frequency of signals.
█ THANKS
Special thanks to Cryptosnagger for
helping me translate my concept into a pine script reality.
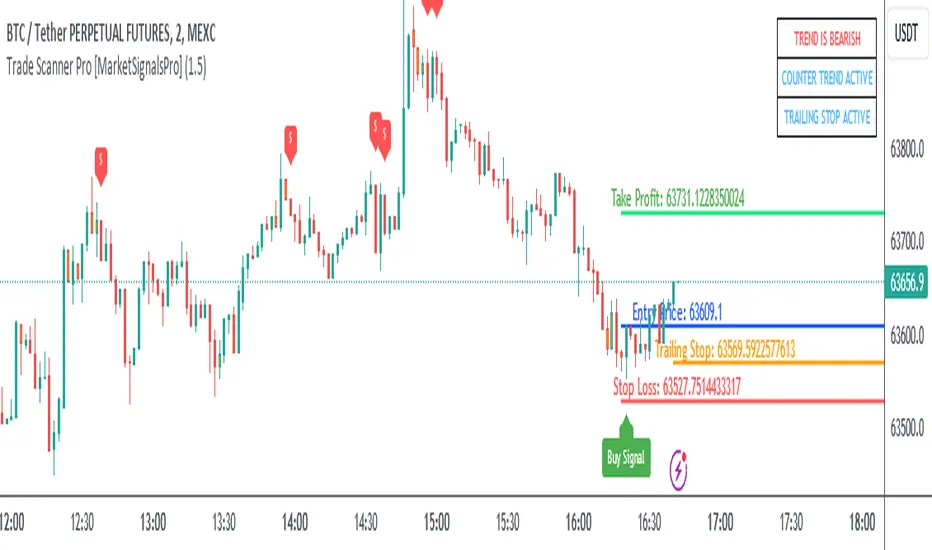
MCOTs Intuition StrategyInitial Capital: The strategy starts with an initial capital of $50,000.
Execution: Trades are executed on every price tick to capture all potential movements.
Contract Size: The default position size is one contract per trade.
Timeframe: Although not explicitly mentioned, this strategy is intended for a one-minute timeframe.
RSI Calculation: The Relative Strength Index (RSI) is calculated over a user-defined period (default is 14 periods).
Standard Deviation: The script calculates the standard deviation of the change in RSI values to determine the threshold for entering trades.
Exhaustion Detection: Before entering a long or short position, the script checks for exhaustion in the RSI’s momentum. This is to avoid entering trades during extreme conditions where a reversal is likely.
Entry Conditions: A long position is entered when the current RSI momentum exceeds the standard deviation threshold and is less than the previous momentum multiplied by an exhaustion factor. A short position is entered under the opposite conditions.
Limit Orders for Exit: Instead of traditional stop loss and take profit orders, the strategy uses limit orders to exit positions. This means the strategy sets a desired price level to close the position and waits for the market to reach this price.
Profit Target and Stop Loss: The script allows setting a profit target and stop loss in terms of ticks, which are the smallest measurable increments in price movement for the traded asset.
blah blah whatever
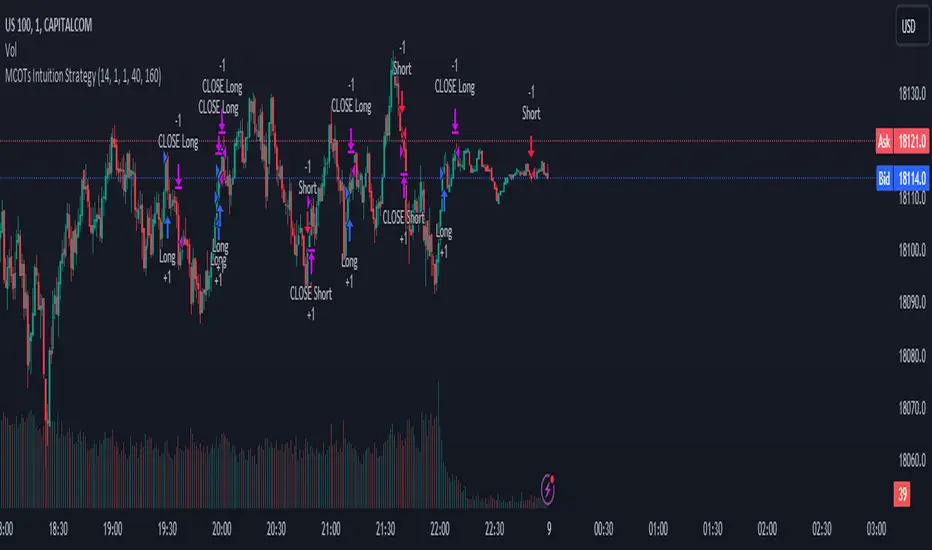
UT Bot Stochastic RSIUT Bot Stochastic RSI is a powerful trading tool designed to help traders identify potential buy and sell signals in the market. This indicator combines the Stochastic and RSI (Relative Strength Index) oscillators, two of the most popular and effective technical analysis tools, to provide a comprehensive view of market conditions.
The Stochastic oscillator is a momentum indicator that compares a security's closing price to its price range over a given time period. The RSI, on the other hand, is a momentum oscillator that measures the speed and change of price movements. By combining these two indicators, the UT Bot Stochastic RSI can help traders identify overbought and oversold conditions, as well as potential trend reversals.
The UT Bot Stochastic RSI also includes an ATR (Average True Range) trailing stop, which can be used to set stop-loss levels and manage risk. This feature is particularly useful in volatile markets, where price movements can be large and unpredictable.
In addition to its powerful technical analysis tools, the UT Bot Stochastic RSI also includes a backtesting feature, allowing traders to test their strategies on historical data. This can help traders identify the most effective settings for the indicator and improve their trading performance.
Overall, the UT Bot Stochastic RSI is a versatile and effective tool for traders of all levels, providing valuable insights into market conditions and helping to improve trading decisions

Multi-Timeframe Momentum Indicator [Ox_kali]The Multi-Timeframe Momentum Indicator is a trend analysis tool designed to examine market momentum across various timeframes on a single chart. Utilizing the Relative Strength Index (RSI) to assess the market’s strength and direction, this indicator offers a multidimensional perspective on current trends, enriching technical analysis with a deeper understanding of price movements. Other oscillators, such as the MACD and StochRSI, will be integrated in future updates.
Regarding the operation with the RSI: when its value is below 50 for a given period, the trend is considered bearish. Conversely, a value above 50 indicates a bullish trend. The indicator goes beyond the isolated analysis of each period by calculating an average of the displayed trends, based on user preferences. This average, ranging from “Strong Down” to “Strong Up,” reflects the percentage of periods indicating a bullish or bearish trend, thus providing a precise overview of the overall market condition.
Key Features:
Multi-Timeframe Analysis : Allows RSI analysis across multiple timeframes, offering an overview of market dynamics.
Advanced Customization : Includes options to adjust the RSI period, the RSI trend threshold, and more.
Color and Transparency Options : Offers color styles for bullish and bearish trends, as well as adjustable transparency levels for personalized visualization.
Average Trend Display : Calculates and displays the average trend based on activated timeframes, providing a quick summary of the current market state.
Flexible Table Positioning : Allows users to choose the indicator’s display location on the chart for seamless integration.
List of Parameters:
RSI Period : Defines the RSI period for calculation.
RSI Up/Down Threshold: Threshold for determining bullish or bearish trends of the RSI.
Table Position: Location of the indicator’s display on the chart.
Color Style : Selection of the color style for the indicator.
Strong Down/Up Color (User) : Customization of colors for strong market movements.
Table TF Transparency : Adjustment of the transparency level for the timeframe table.
Show X Minute/Hour/Day/Week Trend : Activation of the RSI display for specific timeframes.
Show AVG : Option to display or not the calculated average trend.
the Multi-Timeframe Momentum Indicator , stands as a comprehensive tool for market trend analysis across various timeframes, leveraging the RSI for in-depth market insights. With the promise of future updates including the integration of additional oscillators like the MACD and StochRSI, this indicator is set to offer even more robust analysis capabilities.
Please note that the MTF-Momentum is not a guarantee of future market performance and should be used in conjunction with proper risk management. Always ensure that you have a thorough understanding of the indicator’s methodology and its limitations before making any investment decisions. Additionally, past performance is not indicative of future results.

ROC Since MorningThe "ROC Since Morning" indicator is designed for traders who wish to gauge the momentum of an asset from a specific time in the morning, allowing for a customizable analysis of pre-market and intraday movements. This indicator calculates the Rate of Change (ROC) from a user-defined hour, offering insights into how the price has moved since then.
How to Use:
Add the "ROC Since Morning" indicator to your chart.
Adjust the start hour input to your preferred time, considering pre-market hours or the official market opening time.
Analyze the ROC values to understand price movements and momentum since your specified start hour. A positive ROC indicates an upward price movement, while a negative ROC suggests downward movement.