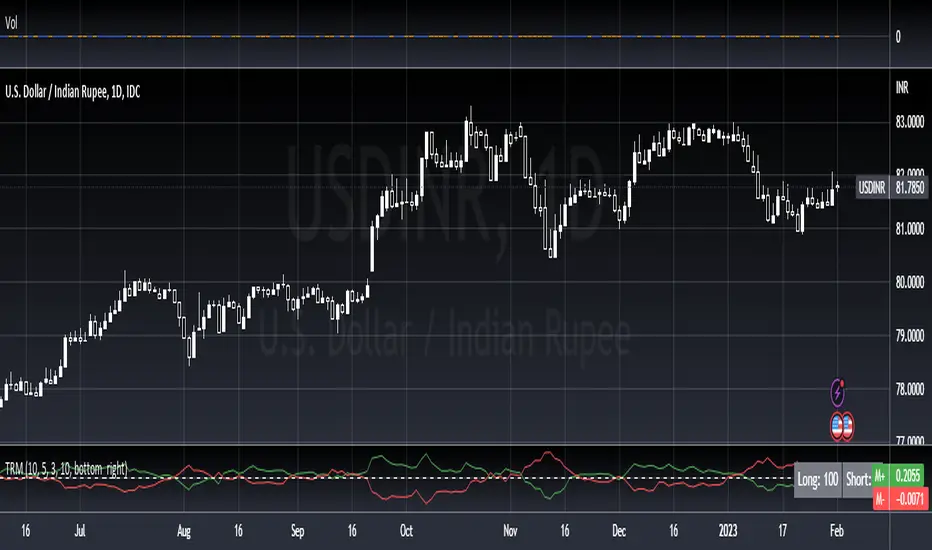
True Range MomentumThe indicator calculates the momentum of bullish and bearish based on the average true range and the highest highs and lowest lows of the historical price.
The indicator displays the strength for either taking a long position, or a short position.
The simplest way to use the indicator is to take a long position when the M+ line crosses above the 0 line. Similarly, to short, the M- line should cross above the 0 line. The exit would be when the respective line crosses below the 0 line.
The contrarian traders should wait for the lines to start rising towards the 0 line and taking an exit. In essence, the line should be going from negative to 0.
The greater the divergence between the M+ and M-, the stronger the trend.
The small table of Long and Short suggests what is in strength. A 100 will show a strong trend in the respective direction. It will be 50-50 when there is no clear direction, ideally identifying a consolidation range.
Momentum Göstergesi (MOM)
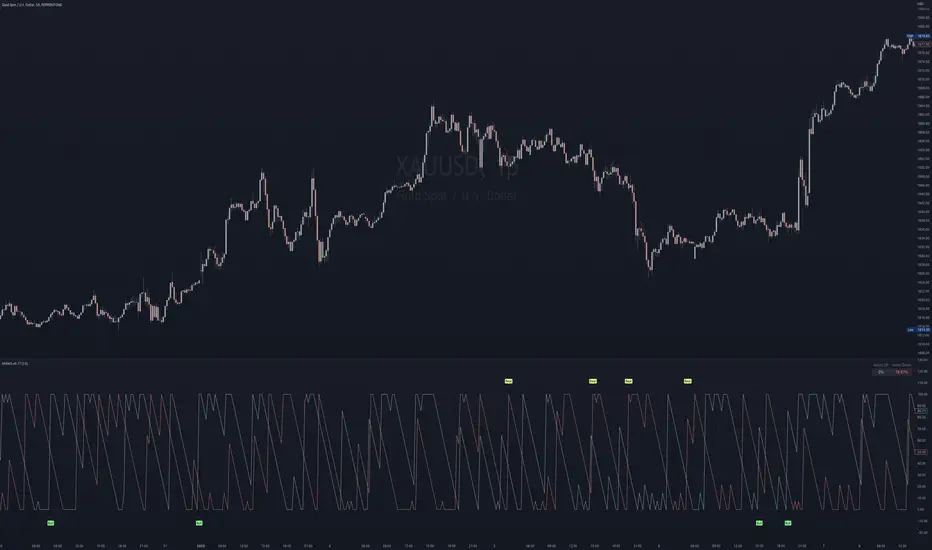
Arron Meter With Alerts [Skiploss]Arron Meter With Alerts is an indicator to identify the trend, and a meter shows the percentage of AroonUP and AroonDown.
Alert Settings
It will be part of a display of bullish and bearish signals by using the condition of the upper line cross lower line and HMA 200 cross under/over EMA 12, and also upper/lower line must be higher than 70%
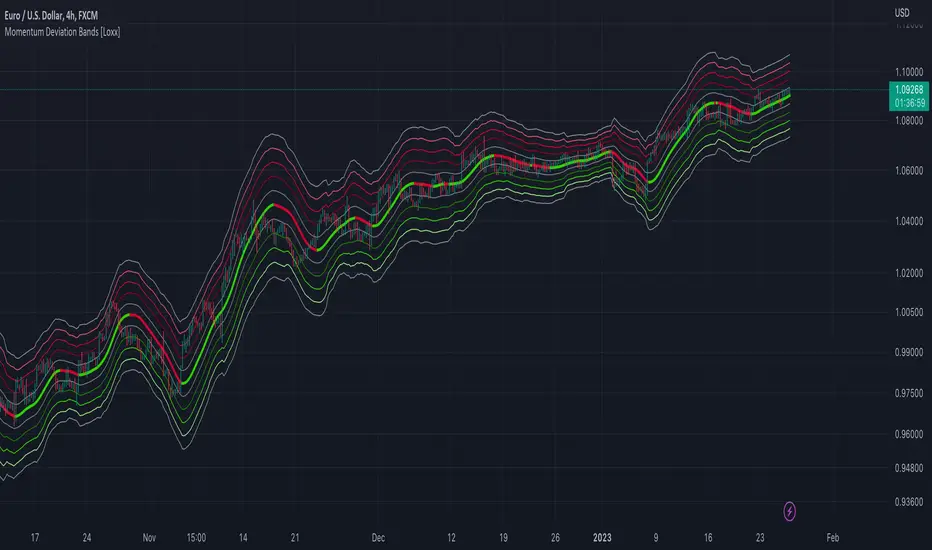
Momentum Deviation Bands [Loxx]Momentum Deviation Bands uses a variation of standard deviation. Instead of using price to calculate standard deviation, this uses momentum. This is another type of volatility that will be used in future indicators. This indicator serves more as an educational tool, but can also be used in trading.
You can read about the included moving averages here:
Included
Bar coloring
GRIDBOT Scalper by nnamWhat is this Indicator used for?
Made specifically for GRID Bots
note: before continuing... this indicator works on any timeframe, but it WORKS BEST ON THE 15 MINUTE TIMEFRAME
Straters and Forex Master Pattern Value Line Traders use this to help determine when the price could reverse.
This indicator is a scalping indicator that produces signals when a "potential" reversal in price is indicated. When the price moves UP and a Potential Bearish Reversal Signal occurs, traders can use this signal as a potential SHORT entry signal for their Short Grid Bot. The process is the same in reverse. After a sustained move down, a Potential Bullish Signal can be used by the trader as a potential LONG entry signal for their GridBot.
As shown in the screenshot below, lines develop on the chart (either RED or GREEN) indicating that a sustained move in one direction is currently occurring; however, there is no potential reversal signal plotted (this means that price action is currently moving in one direction only).
As shown in the screenshot below, lines can be used as a stop-loss after entering the GRIDbot. (usually, by this time, the Grid Bot is in Profit as it usually moves in the opposite direction first)
What this Indicator Does
The GRIDBOT Scalper provides information regarding potential reversals in the market after a sustained movement in one direction (either Bullish or Bearish).
The indicator is based on PRICE-ACTION ONLY and does not take into account the current state of the market (Bullish or Bearish).
Once the price moves in a particular direction for at least 14 bars , a line appears as shown in a previous screenshot. Once the price stops moving in that direction and begins moving in the opposite direction - and after a sustained run - a "signal" appears alerting the trader that a "potential" reversal could be on the horizon soon.
If price moves in one direction and plots both a line and a signal and then begins moving back in the other direction in a sustained manner, the original signal will remain even when a NEW line begins forming (the original line will disappear). (see below) This line will continue to move as the price continues to move. Not until a signal plots on the chart is the potential reversal forming. THE LINE DOES NOT SIGNAL A REVERSAL . Some traders, however, use this information to "ride the wave UP or DOWN" and exit their positions once the signal prints.
As shown below, optional input settings allow the trader to set the line at CLOSE or HIGH/LOW of the candle preceding the potential reversal.
It is suggested to use Close instead of High or Low but the setting allows one to use either.
As shown in the screenshot below, it is typical on LOWER TIME FRAMES to see the price pass the signal line. The Indicator works best on the 15 minute timeframe, as it gives the trader time to make the decisions required as the volatility is less on the 15 minute chart vs the 1 minute or 5 minute charts.
If you have any questions or suggestions for this indicator, please join our Discord. We offer free training on this Indicator on our Discord Server.

Multi SMI Ergodic OscillatorThe Multi SMI Ergodic Oscillator (Multi SMIEO) indicator can be used to identify potential buy and sell signals based on the relationship between the TSI and EMA lines.
The script is creating an indicator that plots multiple (3) sets of Time Series Indicator (TSI-Indicator) and Exponential Moving Average (EMA-Signal) lines as a single indicator.
The TSI is a momentum oscillator that helps identify overbought and oversold conditions. It is calculated using the close prices of an asset, a short-term moving average, and a long-term moving average. The script uses three different pairs of input values for the short-term and long-term periods, which can be adjusted by the user.
The EMA is a type of moving average that gives more weight to recent prices. It is calculated by applying a weighting factor to the most recent price, and then adding that weighted value to the previous EMA value. The script uses three different input values for the length of the EMA, which can also be adjusted by the user.
After calculating the TSI and EMA for each set, the script plots them on the same graph, with different colors and widths to differentiate them. The three sets of TSI and EMA lines are plotted to allow the user to compare the results of different periods. The script also plots a horizontal line at zero, which is used as a reference point for the oscillations of the indicator lines.
One way to use this indicator is to look for crossovers between the TSI and the EMA lines. A bullish crossover occurs when the TSI crosses above the EMA. This suggests that the buying pressure is increasing and a potential buy signal is generated. A bearish crossover occurs when the TSI crosses below the EMA. This suggests that the selling pressure is increasing and a potential sell signal is generated.
Some other ways that the indicator can be used include:
1. Identifying trends: The TSI and EMA lines can be used to identify the direction of the trend. An uptrend is present when the TSI and EMA lines are both trending upwards, while a downtrend is present when the TSI and EMA lines are both trending downwards.
2. Overbought and oversold conditions: The TSI can be used to identify overbought and oversold conditions. When the TSI is above the upper limit of the range, the asset is considered overbought and may be due for a price correction. Conversely, when the TSI is below the lower limit of the range, the asset is considered oversold and may be due for a price rebound.
3. Confirming price action: The Multi SMIEO indicator can be used to confirm price action. If a bullish divergence is present, it confirms a potential bullish reversal. If a bearish divergence is present, it confirms a potential bearish reversal.
4. Multiple time frame analysis: By using different periods for the TSI and EMA lines, the indicator can be used to analyze the asset on multiple time frames. It can be useful to compare the results of different periods to get a better understanding of the asset's price movements.
5. Risk management: This indicator can be used as an element of risk management strategy, it can help traders to identify overbought and oversold conditions to set stop loss or take profit levels.
The Multi SMI Ergodic Oscillator (Multi SMIEO) is a versatile indicator that can be used in a number of ways to analyze the price movements of an asset. It can be used to identify potential buy and sell signals, trends, overbought and oversold conditions, and to confirm price action. By using different periods for the TSI and EMA lines, the indicator can also be used to analyze the asset on multiple time frames. However, it is important to remember that indicators are based on historical data, and past performance does not guarantee future results.
It is important to use the indicator as part of a comprehensive trading strategy that includes risk management and other analysis techniques, such as fundamental and technical analysis. It is also important to keep in mind that indicators are not a standalone solution for trading, they should be used in conjunction with other market analysis and research techniques to generate better results.
Lastly, it is important to keep in mind that trading in financial markets comes with a certain level of risk and it is crucial to always have a proper risk management plan in place. Never invest more than you can afford to lose.

Stoch RSI 15 min - multi time frame tableABOUT THIS INDICATOR
This indicator calculates the Stochastic RSI for the time frames 15 min, 30 min, 1h, 4h, and 12h. However, the 15 min time frame should always be the default time frame for your chart.
IMPORTANT
* NOTE! It's extremely important that the chosen time frame for your chart is 15 min. Otherwise the Stochastic RSI for the longer time frames won’t be correctly calculated.
* Stochastic RSI will be calculated and displayed in a table for the time frames: 15 min, 30 min, 1h, 4h, 12h.
* All time frames are based on closed bars except the "15minR" that are realtime updated values calculated on a 15 min time frame.
ABOUT STOCHASTIC RSI
The Stochastic RSI (StochRSI) is a momentum indicator that ranges between 0 and 100. A Stochastic RSI value above 80 is considered overbought and below 20 is considered oversold.
By using different time frames you can get a better idea of what direction the trade could take in a "longer" perspective.
SETTINGS
1.) Length RSI = 14 (default period)
2.) Smoothing parameter of Stochastic RSI (Length Moving Average = 3) . Moving average of stochastic RSI
* By default the displayed Stochastic RSI values are smoothed values of the actual Stochastic RSI. The smoothnes is formed by a calculated moving average of with the length of 3 by default.
If you want Stochastic RSI with a sharper signal (higher risk for "false alarms" being more sensitive) change the Length Moving Average to = 1 (no smoothness at all)
You can see the selected "Length RSI" and "Length Moving Average" on top of the Stochastic RSI table.
Next version of this script will be updated with more a more flexible solution for different time frames.
* NOTE, Tradingview comes with a inbuilt Stochastic RSI. See the the chart below. The blue line in the Stochastic-RSI chart represents (K value = 3) the same value as the script calculate/display in the table.

1st Gray Cross Signals ━ Histogram SQZMOM [whvntr][LazyBear]This is the Histogram Version of one of my other indicators named: SQZ Momentum + 1st Gray Cross Signals (with arrows) Which is a modification of "Squeeze Momentum Indicator" by user: "LazyBear". In that indicator of his he described, and suggested, the use of his gray cross signals to find points of interest for trading based on the direction of momentum when the first gray cross appears... I have programmed these points, and highlighted them, for ease of use. The 1st gray cross strategy, he said , is from John F. Carter's book, Chapter 11, "Mastering the Trade".
Here we have the Histogram version, with background highlights only, and nothing on the chart, in true SQZ Momentum style.
Disclaimer: using this indicator, or any indicator anywhere, involves risk when trading and isn't a guarantee of 100% accurate results.

[LazyBear] SQZ Momentum + 1st Gray Cross Signals ━ whvntrI have modified LazyBears Squeeze Momentum Indicator with enhancements, plus added signals
LazyBear mentioned that in John F. Carter's book, Chapter 11, "Mastering the Trade", that "Mr. Carter suggests waiting till the first gray after a black cross, and taking a position in the direction of the momentum (for ex., if momentum value is above zero, go long). Exit the position when the momentum changes (increase or decrease --- signified by a color change)." I have done just that. Now at each "first gray after a black cross", there are now Bearish and Bullish signals.. The signals only appear in the direction of the momentum.
Disclaimer: This indicator does not constitute investment advice. Trade at your own
risk with this method of identifying changes in stock market momentum.

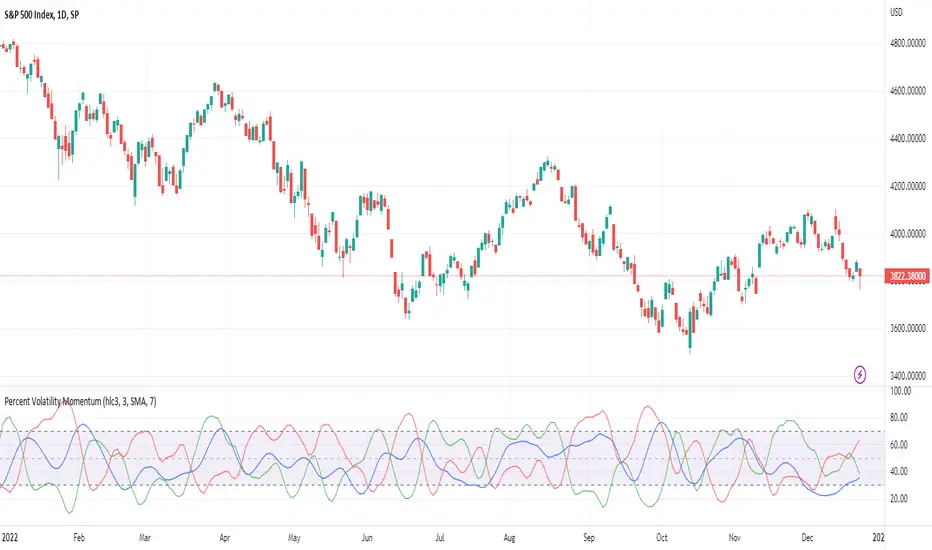
Percent Volatility MomentumThis pine script calculates percent volatility momentum, negative percent volatility and positive percent volatility. The blue line is the overall momentum of the current percent volatility trend. The red line only includes negative movements in the percent volatility of the source. The green line includes only positive movements of the percent volatility of the source. The script also includes an angle and a normalized angle setting that allows one to determine the angle of the source curve. Note, the angle was transformed from -90 to 90 to 0 to 100. Such that an angle of -90 is transformed to 0. An angle of 0 is transformed to 50 and an angle of 90 is transformed to 100. This is the first draft of this script and my first pine script published. Any feedback is welcome. I borrowed code from TradingView's Linear Regression Channel and Relative Strength Index pine scripts.
Quantum CDV HistogramThis script is an addition to Fixed Quantum Cdv.
It shows vector cdv ratio in columns.
You can select the length as an input to how many bars to look back for the whole calculation.
The green bars represent the bullish values and the red bars the bearish values.
The green line represents an ema of the bullish value and the red line the ema of the bearish value.
The momentum ema (in purple) represent the cdv ratio (bullish - bearish).
When the momentum ema is at 100% or more it’s a good sell opportunity and when the momentum ema is at or under 100% it’s a good buy opportunity. It is not financial advise. Make sure to make your own analysis. This script help to make entries, but do not enter positions only based on this signal.
In the inputs you can select the emas that you want to display on your histogram.
The original script is the Cumulative Delta Volume by LonesomeTheBlue.

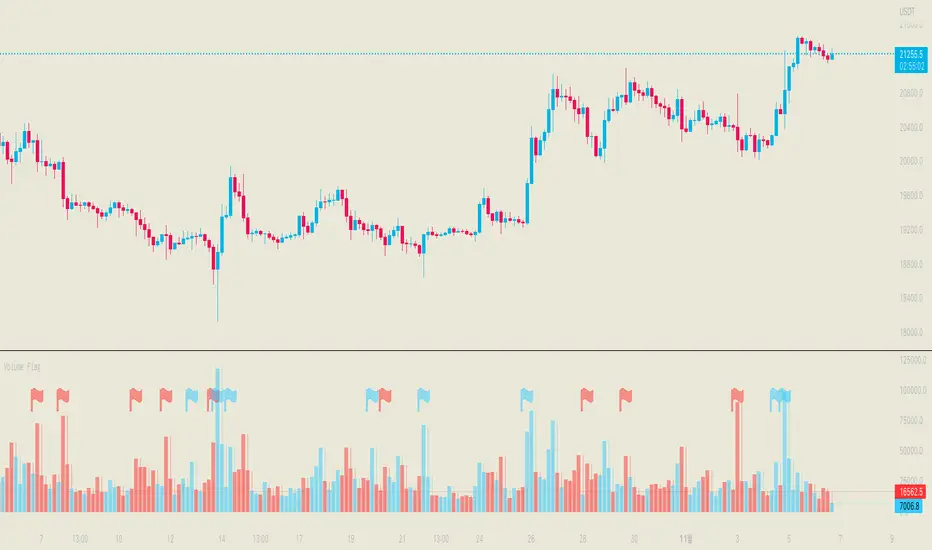
Volume FlagThis indicator shows the increased volume compared to the previous volume.
A flag is displayed when the trading volume increased by *n of the previous candle.
Receive a signal as an alert.
Thank you.
(Please comment and click on the rocket.)
-------------------
이 지표는 이전 캔들의 거래량 대비 증가된 거래량을 확인할 수 있습니다.
깃발을 사용하여 증가 감소를 확인할 수 있으며 n배 만큼의 증가 되었을때 표시됩니다.
그리고 깃발이 표시될 경우 알람을 받으실 수 있습니다.
감사합니다.
댓글과 로케트 클릭 부탁드립니다.
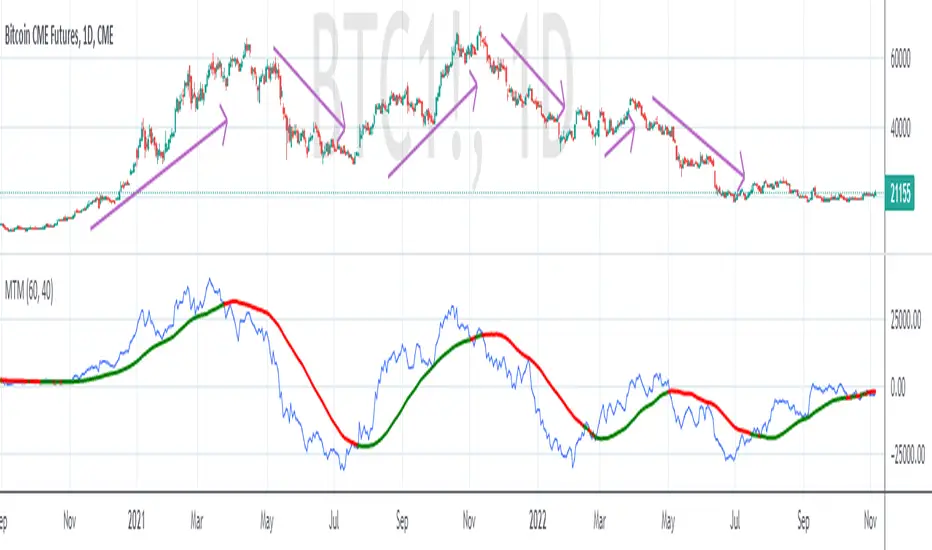
MTM - Momentum IndicatorMTM - Momentum
Description
The Momentum indicator is a speed of movement indicator that is designed to identify the speed (or strength) of price movement. This indicator compares the current close price to the close price N bars ago and also displays a moving average of this difference.
Category
Momentum Indicators
Parameters
N ( Default: 6 Min: 1 Max: 100 )
N1 ( Default: 6 Min: 1 Max: 100 )
Chart Script
MTM : CLOSE-REF(CLOSE,N);
MTMMA : MA(MTM,N1)
www.edgerater.com
TMO ScalperTMO - (T)rue (M)omentum (O)scillator) MTF Scalper Version
TMO Scalper is a special custom version of the popular TMO Oscillator. Scalper version was designed specifically for the lower time frames (1-5min intraday scalps). This version prints in the signals directly on top of the oscillator only when the higher aggregations are aligned with the current aggregation (the big wheels must be spinning in order for a small wheel to spin). The scalper consist of three MTF TMO oscillators. First one is the one that plot signals (should be the fastest aggregation), second serves as a short term trend gauge (good rule of thumb is to us 2-5x of the chart time frame or the first aggregation). The third one (optional) is shaded in the background & should only serve as a trend gauge for the day (usually higher time frames 30min+).
Time Frames Preffered by Traders:
1. 1m / 5m / 30m - This one is perfect for catching the fastest moves. However, during choppy days the 1min can produce more false signals..
2. 2m / 10m / 30m - Healthy middle, the 2min aggregation nicely smooths out the 1min mess. Short term gauge is turning slowly (10min for a signal to confirm).
3. 3m / 30m / 60m - This TF is awesome for day traders that prefer to take it slow. Obviously, this combination will produce far less signals during the day.
Hope it helps.

Macro Directional IndexCore to this indicator is the rate at which DI+ and DI- are moving away or towards each other. This is called The Rate of Change (ROC). The ROC length dictates how many bars back you want to compare to the current bar to see how much it has changed. It is calculated like this:
(source - source /source ) * 100
This indicator has 4 values in the status line:
DI+
DI-
Distance between DI+ and DI-
DI Rate of Change
DI Rate of Change
The rate of change is smoothed using an EMA. A shorter EMA length will cause the ROC to flip back and forth between positive and negative while a larger EMA length will cause the ROC to change less often. "Since the rate of change is used to indicate periods of 'consolidation', you want to find a setting that doesn't flip back and forth too often.
Directional Index Middle Channel
Between the DI+ and DI- is a black centerline. Offset from this centerline is a channel that is used to filter out false crosses of the DI+ and DI-. Sometimes, the DI+ and DI- lines will come together in this channel and cross momentarily before resuming the direction prior to the cross. When this happens, you don't want to flip your bias too soon. The wider the channel, the later the indicator will signal a DI reversal. A narrower channel will call it sooner but risks being more choppy and indicating a false cross."
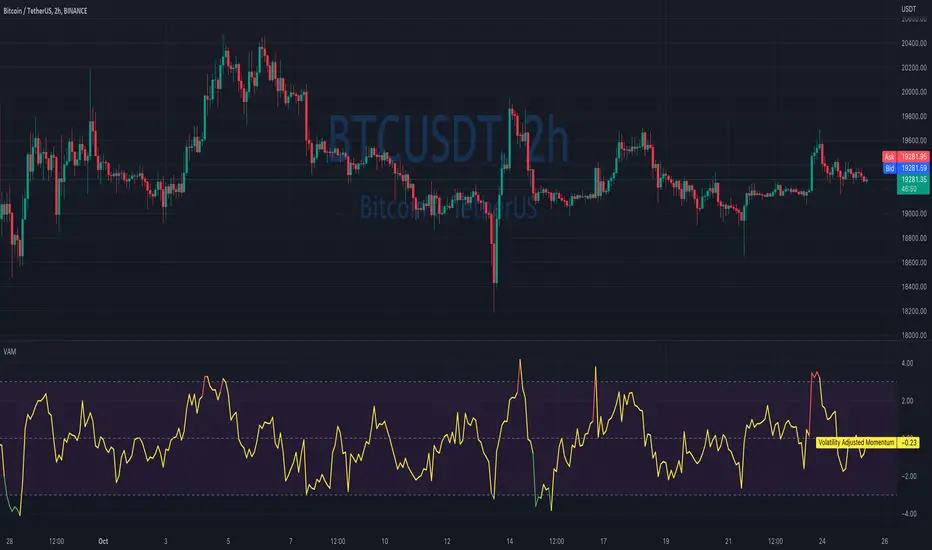
Volatility Adjusted MomentumIt's a script that computes volatility-adjusted momentum indicators.
The problem with the momentum indicator is that it's absolute and it's hard to interpret its value. For example, if you'll change the timeframe or instrument value of Momentum will be very different.
We tried to solve that by expressing momentum in volatility. This way you can easier spot overbought/oversold values.
You can choose to use Standard Deviation or ATR for adjustments.
Thanks to @MUQWISHI for helping me code it.
Disclaimer
Please remember that past performance may not be indicative of future results.
Due to various factors, including changing market conditions, the strategy may no longer perform as well as in historical backtesting.
This post and the script don’t provide any financial advice.
Ichimoku MA Up & DownIchimoku and MA use the default.
It is repainted because it uses a moving average line.
A marker is only true if it was created after the candle closed.
The principle is too simple.
Please enjoy using it.
- Up : Conversion Line > MA #1 and Base Line > MA #2
It is an uptrend. The short-term moving average should be above the conversion line. And the long-term should be above the Base Line.
- Down : Conversion Line < MA #1 and Base Line < MA #2
It's a downtrend. The short-term moving average should be below the conversion line. And the long-term should be below the Base Line.
You can get better results if you use a momentum indicator like RSI.
Thank you.

Qube [AstrideUnicorn]Qube is an indicator that shows market regimes. It is able to detect medium and long term trends and ranging markets. If the indicator bars are colored blue and are between the two blue lines, it means that the market is in sideways movement or consolidation. If indicator bars cross the upper boundary and are colored green, it means that the market is in an uptrend. Red bars crossing the lower blue line indicate a downward trend. The red or green columns are further referred as signal bars.
The indicator is based on the normalized momentum oscillator raised to the third power. This is done to increase the sensitivity of the indicator and to emphasize the difference between the market modes.
The indicator can be used in different ways. One of them is determining the trend direction based on the last signal bar. Even if the current indicator bar is blue (showing range or consolidation), the user should consider the longer-term market mode as upward if the last signal bar is green. And vice versa, if the last signal bar is red, the current market bias is downward. One other way to use the indicator is to catch active price impulses, when columns of the same color (red or green) appear consecutively.

Directional Slope Strength IndexThe most basic of trend indicators is the price change over some period of time. Rate of change is the most common indicator to use which calculates the current price minus the price n bars back. I've written this indicator to solve several problems the default value of ROC.
1. We're interested in the magnitude or strength of the slope of change.
2. We need a number that we can make decisions from between 0 and something close to a peak of 10.
3. We need the ability to define a threshold where a directional change might be taking place.
The Directional Slope Strength Index solves these problems by taking 1000 samples of your given Rate of Change input and calculating a standard score (or z-score) which represents the number of standard deviations by which the current rate of change is above or below the historical average. A higher number represents a stronger move up and a lower (negative) number represents a stronger move down. A value closer to 0 would represent a sideways trend or the slowing of a current trend.
A potential threshold could be 2 or -2 which is two standard deviations from the mean ROC.
The inputs can be modified to control the sensitivity.
1. A lower ROC length would provide a more sensitive measure, but still measure how that sensitive input changes over 1000 samples.
2. I recommend keeping the sample rate at 1000 as that provides enough historical data to give a more accurate distribution and therefore a more accurate DSSI (z-score).
A number of decisions can be made from the indicator:
1. When the DSSI crosses above 2, it could be a sign of a strong move upward. When below -2 it could be a sign of a strong downward move.
2. When the DSSI persists in a positive or negative channel between 0 and 2 or 0 and -2 this could indicate the formation of the next trend.
3. Values outside 2 and -2 standard deviations should be interpreted as high volatility environments.
4. For convenience, a highest and lowest DSSI have been plotted to provide references to the historical extremes.
I'm open to any questions and feedback as this is a first, original indicator for me.

Outback RSI & Hull [TTF]This indicator was originally made to help users following along with one of our strategies that we call The Outback (hence the name).
One of the component indicators of that strategy is an RSI with a Hull Moving Average added on top of the RSI as an additional reference for the momentum of the RSI. Many people either had difficulty setting this up correctly, or were having issues with the Indicator on Indicator component, so we built this indicator to assist in that regard.
As we continued to use it, we found it to be a pretty sound momentum indicator that had much to offer by enhancing the more normal RSI, and wanted to make this indicator generally available to the public.
The basic premise of this indicator is as follows:
The core is a traditional RSI with a "normal" (usually Simple) moving average
The "secret sauce" is adding a 2nd moving average (a Hull Moving Average, inspired by Insilico's awesome Hull Suite) based off the RSI
By leveraging the RSI's position relative to both the Simple and Hull moving averages, you can better gauge the relative strength of the current momentum, as well as better visualize longer-term momentum direction and strength based on the moving average slopes and direction.

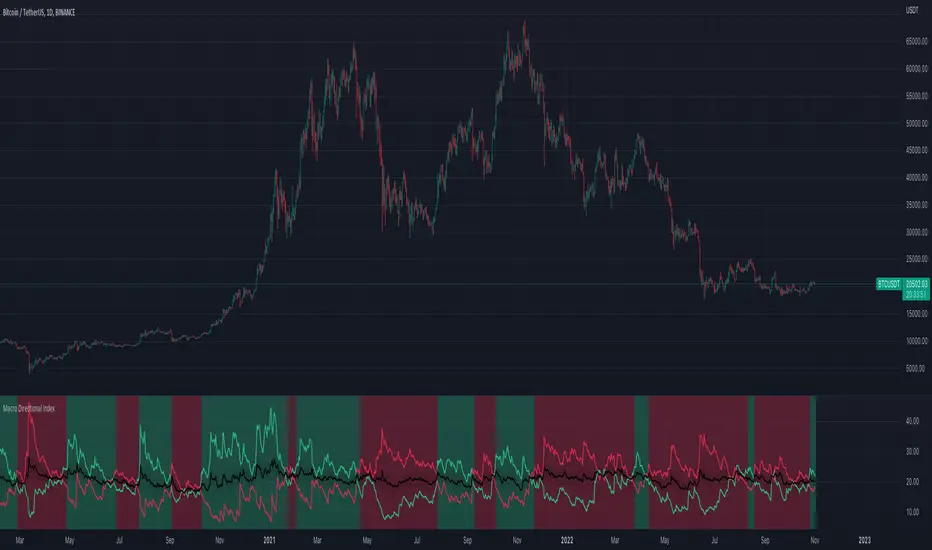
Crypto-DX Crypto Directional Index [chhslai]Crypto-DX can be used to help measure the overall strength and direction of the crypto market trend.
Furthermore, it can be used as a screener to find out cryptocurrencies which are accumulating momentum and tends to potentially pump or dump.
How this indicator works :
If the Crypto-DX cross above the zero-level, it could be an indication that there is a trend reversal into upward. You should close your short position or place a long order right away.
If the Crypto-DX cross below the zero-level, it could be an indication that there is a trend reversal into downward. You should close your long position or place a short order right away.
If the Crypto-DX is consolidated around the zero-level, it could be an indication that the trend may be ended and followed by a sideway market. You are suggested not to place any order and wait for the market moves.
Divergence based trading strategy is fully applicable, just like the MACD.
Screener features :
Plot "Crypto Index" and "5 Custom Crypto"
Plot "Crypto Index" and "Top 30 Crypto"

Point Of ControlStrategy and indicators are explained on the Chart.
Here's how i read the chart.
Entry:
1. Let the price close above the Ichimoku cloud
2. Price is above Volume Support zone
2. Make sure that momentum indicated with Green Triangles for Long Position
Exit:
1. Orange cross at the bottom of the candle indicates price is about to weaken
2. Best time to exit is Volume Resistance + Bearish(Hammer or Engulf )
PS: Use it along with R-Smart for better results

Cutlers RSICutlers' RSI is a variation of the original RSI Developed by Welles Wilder.
This variation uses a simple moving average instead of an exponetial.
Since a simple moving average is used by this variation, a longer length tends to give better results compared to a shorter length.
CALCULATION
Step1: Calculating the Gains and Losses within the chosen period.
Step2: Calculating the simple moving averages of gains and losses.
Step3: Calculating Cutler’s Relative Strength (RS). Calculated using the following:
-> Cutler’s RS = SMA(gains,length) / SMA(losses,length)
Step 4: Calculating the Cutler’s Relative Strength Index (RSI). Calculated used the following:
-> RSI = 100 —
I have added some signals and filtering options with moving averages:
Trend OB/OS: Uptrend after above Overbought Level. Downtrend after below Oversold Level.
OB/OS: When above Overbought, or below oversold
50-Cross: Above 50 line is uptrend, below is downtrend
Direction: Moving up or down
RSI vs MA: RSI above MA is an uptrend, RSI below MA is a downtrend
The signals I added are just some potential ideas, always backtest your own strategies.

Harris RSIThis is a variation of Wilder's RSI that was altered by Michael Harris.
CALCULATION
The average change of each of the length's source value is compared to the more recent source value.
The average difference of both positive or negative changes is found.
The range of 100 is divided by the divided result of the average incremented and decremented ratio plus one.
This result of the above is subracted from the range value of 100
I have added some signals and filtering options with moving averages:
Trend OB/OS: Uptrend after above Overbought Level. Downtrend after below Oversold Level (For the traditional RSI OB=60 and OS=40 is used)
OB/OS: When above Overbought, or below oversold
50-Cross: Above 50 line is uptrend, below is downtrend
Direction: Moving up or down
RSI vs MA: RSI above MA is an uptrend, RSI below MA is a downtrend
The signals I added are just some potential ideas, always backtest your own strategies.
