Open Close Profit - [Alerts]This script comes with the following indicators and features:
Moving Average trend filter (Hull, ZLEMA, McGinley)
Pin Bar Filter
MACD indicator
Pump and Dump filter
Entry, Take Profit, and Stop Loss Alerts
And a few more indicators in the back-end to increase accuracy, optimize entries and filter out sideways PA
This script works really well as a scalper on lower Time Frames as well as on higher Time Frames. Besides that you can also use it on pretty much any coin or asset.
This script is not repainting. We advise to use alerts on “Once Per Bar Close”.
If you’d like to automate this script you can do that by using AutoView, ProfitView, ProfitTrailer, CryptoHopper etc.
Leave a message if you’d like to try it out.
Metaller

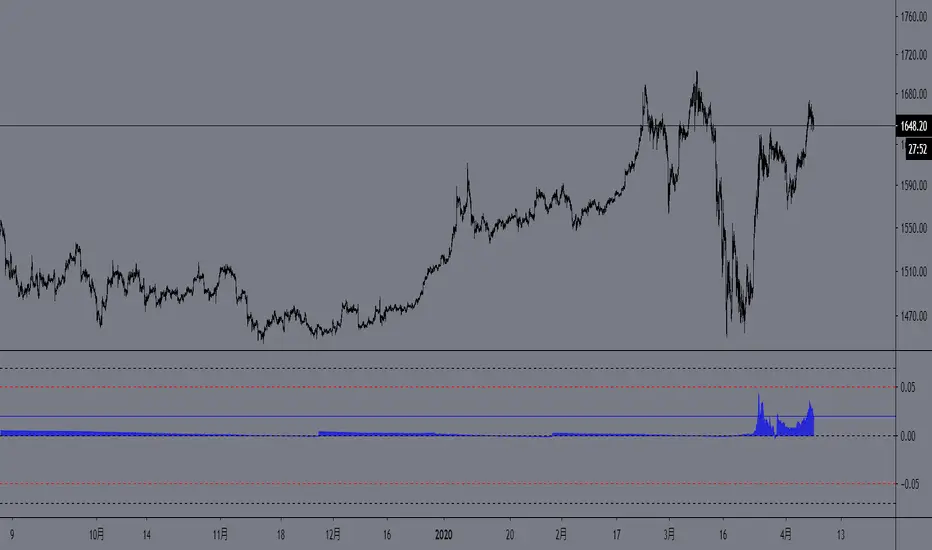
Deviation from the futures market for GOLDThis indicator shows the deviation from the gold futures market.
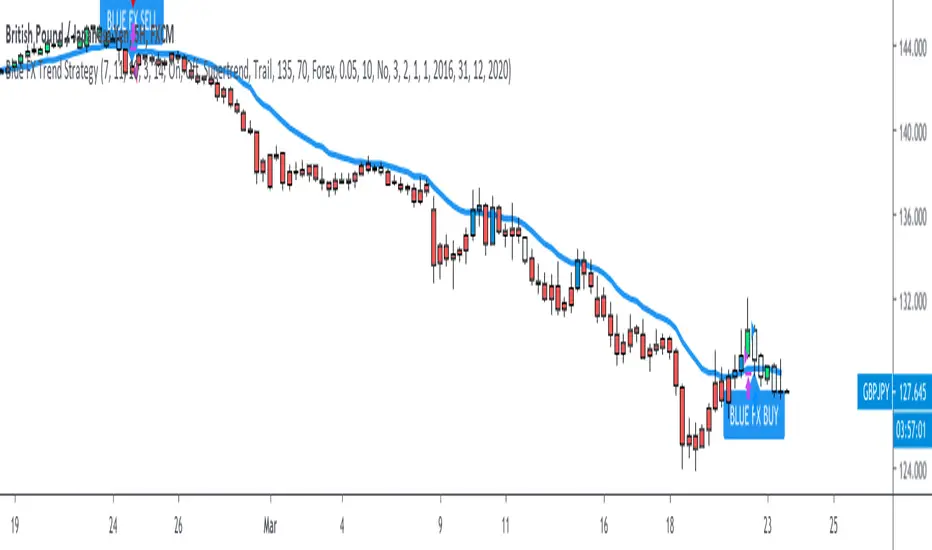
Blue FX Trend StrategyHi, welcome to the Blue FX Trend Strategy Script.
What does it do?
Our strategy will help you identify the current trend in the markets and highlight when this is changing. The strategy itself is based upon 4 indicators lining up in total confluence to increase the probability of the trade being a success, this is specifically an EMA, MACD settings, Supertrend criteria and also Momentum.
Absolutely no technical analysis is needed to trade this successfully - this can be used on all time frames and all pairs - obviously with varying profitability as all pairs work differently - this can be reviewed quickly in 'Strategy Tester' to hone in on your own desired settings.
When all criteria is in alignment the strategy will convert all candles to the relevant colour - Green for an uptrend and Red for a downtrend; a candle that is printed normally simply shows that no current trend is in place to warrant a colour change. A normal coloured candle could possibly indicate a change in current market direction or the market consolidating before a further move in the initial direction. When a new signal is valid 'Blue FX Buy'' or 'Blue FX Sell' will be displayed and the small arrow shown on candle open for entry.
How do I use it?
Our strategy is invite only - upon joining our group we will allow you access to the script. This will then simply display on your device ready for you to start trading from. There is substantial functionality within the strategy, you can;
See the success of the default settings in the past using the 'Strategy Tester' Function for numerous settings
1. Following the settings 'Trail'
2. Changing your TP function with the other criteria listed
3. Using a Fixed TP or SL function
Upon changing the Script to 'Fixed' you will see numerous trades on the chart displayed differently.
Scaling into a profitable position is also possible - this is ideally done when the candle colour confirms the trend is continuing after rejection/support from the EMA; we show this below;
You could also enter here if you missed the initial sell signal, we have MA rejection and a red printed candle indicating all confluences are in play and we have high probability for the move to continue.
How do I know its profitable?
We have built numerous customisable settings into the strategy for you to see that this is profitable - you can visually see this too. The settings are also customisable to find the right criteria for the right pair on the right time-frame. Ultimately, with the strategy confluences in place, you are putting probability in your favour and can quickly determine the trend in place if there is one. Within the customisable settings there is a compound function too, so if you were to compound your profit the results can be exceptional.
We have also added an H4 confluence, so you can ensure if trading on a lower time-frame you are in the overall direction of the H4 trend too, a useful setting for more confluence again.
Where do I set my Stop loss or Take Profit?
There is no right or wrong to this and we have attempted to build numerous ways of doing this into the strategy for reference.
For setting a SL you could;
1. Use a fixed SL.
2. Place the SL below the last high or low in the trend.
3. Use an ATR function.
4. Place the SL 5 pips below the last 3 candles.
5. Or, trail the price if you are on screen until the next signal is given and a new trend starts - although unless a big trend, you may miss out on some profit by the time price has pulled back.
For placing a Take Profit, you could;
1. Use a fixed TP.
2. Look for the next supply/demand area on the chart (if it breaks and candle colour supports direction - you could enter again).
3. Use an ATR function.
5. Or, trail the price if you are on screen until the next signal is given and a new trend starts - although unless a big trend, you may miss out on some profit by the time price has pulled back.
6. Secure multiple TPs - 20/50/100 pips with Stop loss to entry after the first target is hit.
Here are some examples of the Buy and Sell signals in action;
Will also work on Commodities and Indices as shown below too;
Our recommended visual settings are below;
1. Set to'Trail' Strategy
2. Under 'Style' tab, select Trades on Chart, but un-select both Signal Labels and Quantity to clean up the chart - these settings are useful when testing to see where the trades are opened and closed.
3. We like the candles changing colour to the trend and criteria set however, these can be turned off to display normal bullish and bearish candles.
When reviewing profitability you can do this by selecting 'Overview' 'Performance Summary' and 'List of Trades'.
Please consider that the settings based into the strategy could differ to your own money management rules and your management of your SL and TP as outlined above - we have tried to cover as many bases as possible here.
We look forward to you using this strategy to profit from the market, please share your feedback and results with us.
Kind regards
Blue FX Team
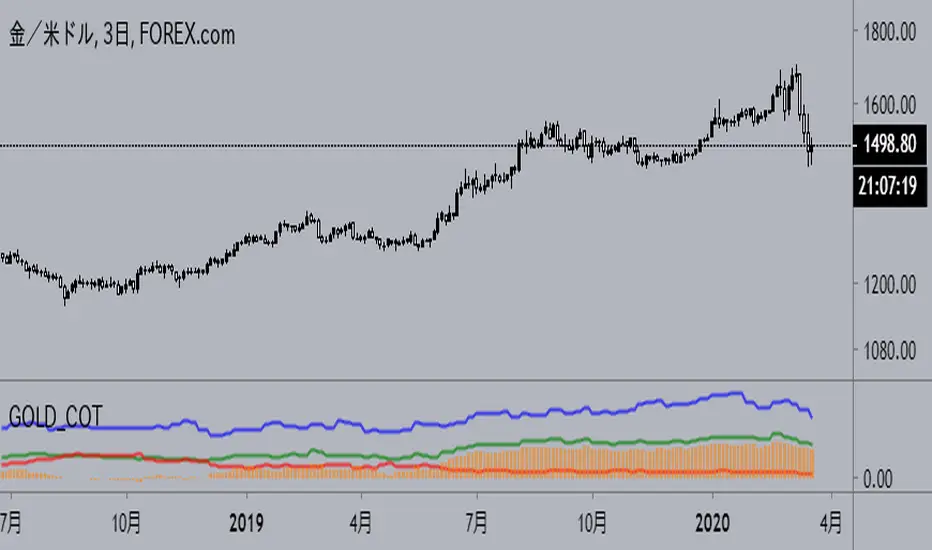
GOLD_COTThis indicator shows GOLD_COT.
Uniqueness: You can show open interest in addition to long, short and net positions.
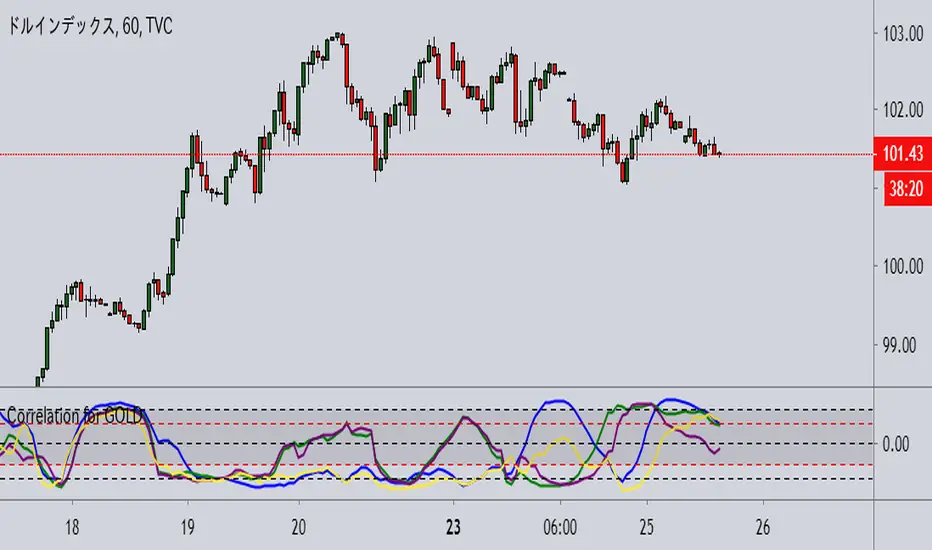
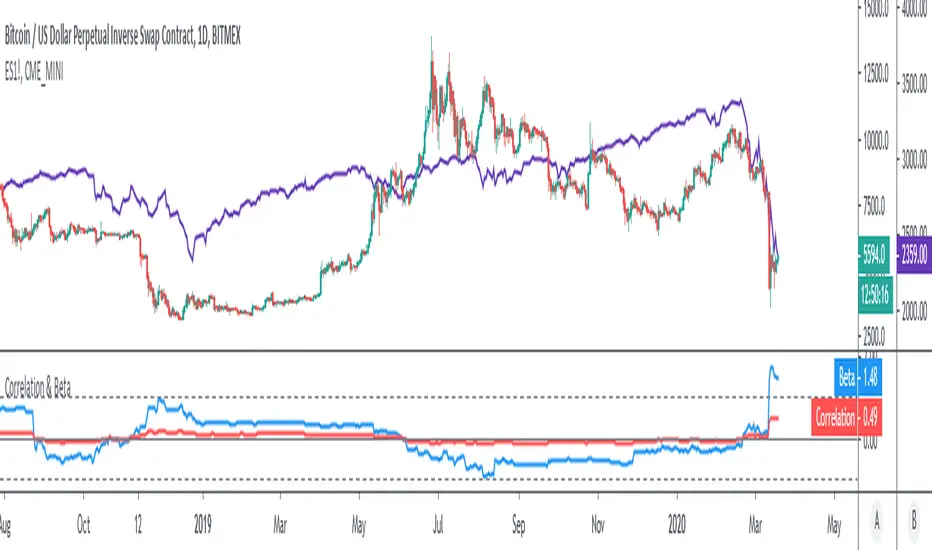
Correlation & BetaDisplay the correlation coefficient and/or Beta of an asset to a specified market.
Options to:
- Specify market (S&P500 futures by default)
- Display one or other metrics
- Modify assessment period (200 bars by default)
- Calculate on price, returns or log-returns
Yield Curve Inversion MonitorIdentifies when the US Treasury Yield Curve inverts (2 and 10 year bond rates).
When they ‘invert’ long-term bonds have a lower interest rate than short-term bonds. In other words, the bond market is pricing in a significant drop in future interest rates (which might be caused by the US Fed fighting off a recession in the future).
In the last 50 years, every time the US treasury yield curve inverted a recession followed within 3 years. On average the S&P500 gained 19.1% following the inversion and peaked 13 months later. In other words, as far as investors are concerned, the recession began roughly one year later.
However, once the market peaks, it then drops 37.6% on average, wiping out all those gains and more.
...Looks like 2020 is shaping up to be another prime example.

Gold-Stocks RatioA historic risk-off flag.
When the Gold-Stocks Ratio is above the 200 week moving average, investors may fair better holding gold and avoiding equities, as was the case for the last 20 years.

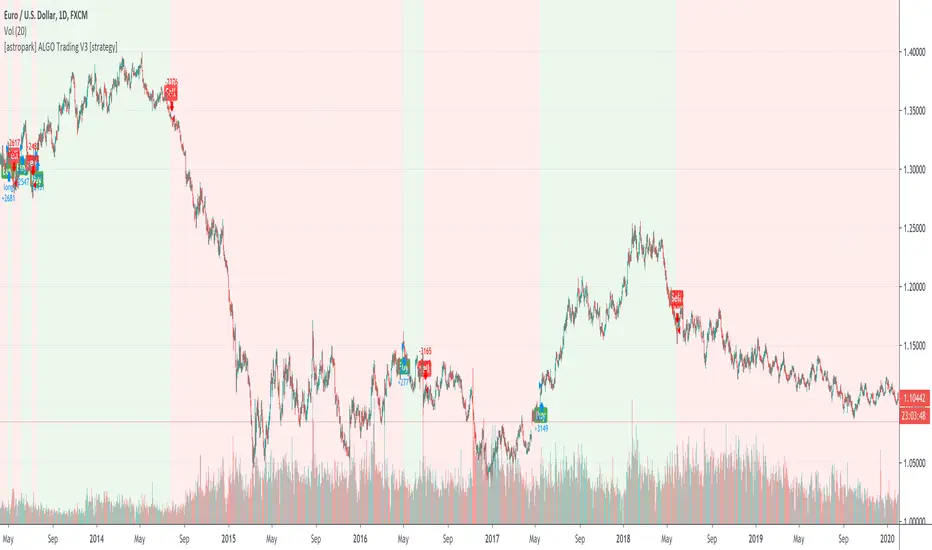
[astropark] ALGO Trading V3 [strategy]Dear Followers,
today another awesome Swing and Scalping Trading Strategy indicator, runnable on a bot , which works great on many timeframes (from 1h and above is suggested), just write me in order to help you find correct settings).
It must be said that this strategy works even better on 1m Renko chart!
If you are a scalper or you are a swing trader, you will love suggested entries for fast and long-lasting profit.
Keep in mind that a proper trailing stop strategy and risk management and money management strategies are very important (DM me if you need any clarification on these points).
This is not an evolution of "ALGO Trading V1" or "ALGO Trading V2" , but a twin sister of them.
For your reference, here it is the "ALGO Trading V1" indicator
and here the "ALGO Trading V2"
This strategy has the following options:
enable/disable signals on chart
enable/disable bars and background coloring based on trend
enable/disable a "filter noise" option , which try to reduce overtrading (you can easily check it on backtesting)
enable/disable a Take Profit / Stop Loss option (you can easily check it on backtesting too)
enable/disable a secret SmartOption which may improve profit on your chart (again, check it on you chart if it helps or not)
This strategy only trigger 1 buy or 1 sell. If you enable Take Profit / Stop Loss option, consider that many TP can be triggered before trend reversal, so take partial profit on every TP an eventually buy/sell back lower/higher to maximize your profit.
In order to get notified when a signal is triggered, you need to use the "alarms" version of this indicator (just search for astropark's "ALGO Trading V3" indicator and choose the one with "alarms" suffix).
Strategy results are calculated on the time window from 1995 to now, so on more than 15 years, using 1000$ as initial capital and working at 1x leverage (so no leverage at all! If you like to use leverage, be sure to use a safe option, like 3x or 5x at most in order to have liquidation price very far).
This is not the "Holy Grail", so use a proper risk management strategy.
This script will let you backtest how the indicator will perform on any chart and timeframe you may like to test and/or trade. Of course results will be very different depending on the chart and timeframe you will open. I tested a lot of charts and always you can find a combination that keep this strategy in profit on swing trading style (and this means that if you can have a daily look at the chart you can always manage to maximize your profit on each trade!)
This is a premium indicator , so send me a private message in order to get access to this script.
Silver Long/Short Combines Gold and Silver price ratio with SMA trend indicators for buy and sell signals.

[astropark] Ichimoku Cloud Strategy [alarms]Dear Followers,
today a Great Swing Trading Strategy , runnable on a bot , which works great on High Timeframes (1D is suggested!) but also even better on 1m Renko chart.
If you are a scalper, you will love suggested entries for fast profit. You can run it on 1h timeframe (below is not suggested) if you are used to scalp trading and close each trade whenever you feel happy (a proper trailing stop strategy is suggested anyway).
This strategy is based on the Ichimoku Cloud Indicator and let's you set a lot of settings:
works on all timeframes (but 1D and above is suggested on normal candlesticks chart)
you can run this indicator on 1m Renko chart (be sure to enable the "USING RENKO CHART? ENABLE THIS OPTION" setting)
you can use 4 kind of Ichimoku Cloud (Custom, Slow, Standard and Fast - keep only one enabled)
you can make the Ichimoku Cloud show or not
you can enable showing the possibile re-entries
you can enable an heiking ashi analysis
you can enable a trailing stop strategy ("Auto Trailing Stop Loss" and "Close Trade When Price Breaks Above the Ichimoku Cloud" are two options very much suggested to keep enabled, especially on bot trading)
you can create your own trailing stop stategy and take profit strategy
you can enable a simple take profit strategy based on RSI Overbought and Oversold levels
This strategy only trigger 1 buy or 1 sell, but if you missed the possibility to open your long or short position don't get mad, but just enable the "show re-entry signals" option, so yout will be able to enter again (be sure to always use a proper money management ).
By the way, you can set any alarms you like in order to get notified when any kind of signal is triggered (you need to use the "alarms" version for this).
Strategy results are calculated on the timeframe from May 2017 to now, so on 2 years and half, using 10000$ as initial capital and working at 1x leverage (so no leverage at all! If you like to use leverage, be sure tp use a safe option, like 3x or 5x at most in order to have liquidation price very far).
This is not the "Holy Grail", so use a proper risk management strategy.
This script will let you set all notifications you may need in order to be alerted on each triggered signals (there is also an "ALL-IN-ONE" option for free tradingview users.
The backtesting version of this indicator, which will let you backtest how the indicator will perform on any chart you may test, can be found by searching for "Ichimoku Cloud Strategy" and then choosing the astropark indicator with "red and green arrows" at the end of the name. You can find it here below too:
This is a premium indicator , so send me a private message in order to get access to this script.

RocketScalper+ Long/Short IndicatorNOTE: To use together with RocketScalper Long/Short Indicator
About the Rocketscalper+ Indicator
Derives from the RocketScalper Long/Short indicator, was worked on by PM
Used by 180+ users as of today
Was first published on Sept 10, 2019
It had 1 iteration so far.
Will be updated as needed so it keeps giving good outputs (so far no update needed).
While the RocketScalper works by merging 3 oscillators and then checking the market balance between sells and buys to give you the final output, the RocketScalper+ uses MA Crossings and adds another layer to filter than final output. It IS NOT an upgrade, use both.
Main notes about the RocketScalper+:
Wavetrend ignored
Took weight off of Godmode for the final output
Added weight to Price Oscillator for the final output
Added TakeProfit and StopLoss conditions editable for users
Turned the scalper more neutral with a slight long bias for the upcoming trend
Has several outputs on the chart that you can activate/deactivate
Long / Short Signals
Self Explanatory / It suggests you should long or short the asset.
Show Price Oscillator signals
It'll output long/short signals based on the Price Oscillator.
Show Stop/Support/Resistance warning
Not working as of now, will need to update it soon.
No Text inputs on this indicator.
Should I use it on all timeframes and all pairs?
Yes, works very well with HTF and for all pairs. As you can see above on BTCUSDT (as an example), on the 6h use it as a confirmation to get in a trade, specially if you also use the TMA.
For access, please DM us or visit the link below in our Signature.

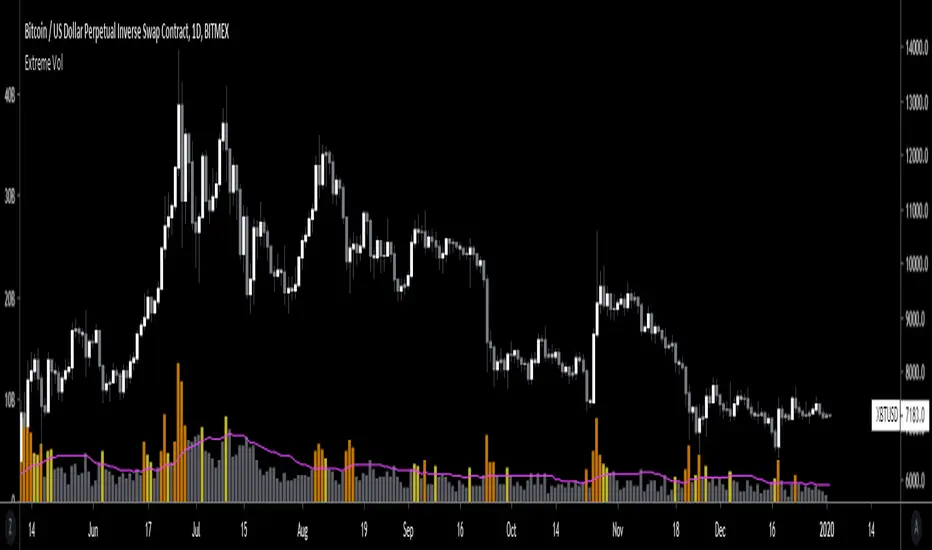
Extreme VolumeThis indicator colors volume bars that are significantly higher volume than the vol moving average ( SMA ). Utilizes two multiplier that can be adjusted by user. Defaults are that the indicator colors volume bars yellow if 20% higher than average, and orange if over 50% higher than average.
Reason why i created this indicator is i typically don't care about volume unless it is significantly higher than average. I find extreme volume useful for confirmation of a breakout, etc. This is why the rest of the volume bars are gray, they are still available for reference, but I dont pay much attention until volume is higher than average.
Also, when you load this indicator it will be in its own pane below the chart. To try and figure out how to add it to same pane as the chart was a huge pain in the ass. Once you figure it out it is pretty easy. I'll try to explain below...
Next to the indicator name you have the following options ... Hide, Settings, Show Source Code{}, Delete(X), and More (3 dots)
1) Click on "More" (3 dots)
2) Click on "Move To" then chose "Existing Pane Above"
3) Volume will likely be too large. Volume scale should be on left side, use your mouse to adjust volume smaller
4) Volume will likely be in the middle of your chart, click on it and drag it down.
ZoneBand (@Mido_yuiya)Bollinger band is converted to EMA , and support and resistance bands are made into regions

BEAM BandsBEAM Bands is a version of the BEAM indicator that is drawn directly on the price chart. It is a more visual representation of BEAM and lets you compare it directly to the price.
Disclaimer: This is not financial advice. For educational purposes only.
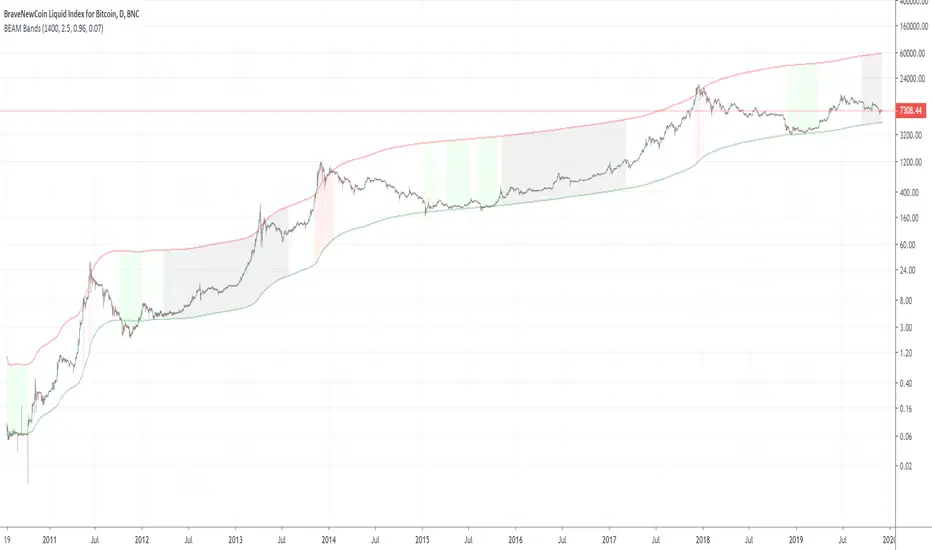
BEAMThe BEAM indicator helps identifying promising times during a cycle for buying and selling Bitcoin or other crypto currencies. It can also be used with gold or silver after adjusting its parameters, but does not work very well with stocks.
Disclaimer: This is not financial advice. For educational purposes only.

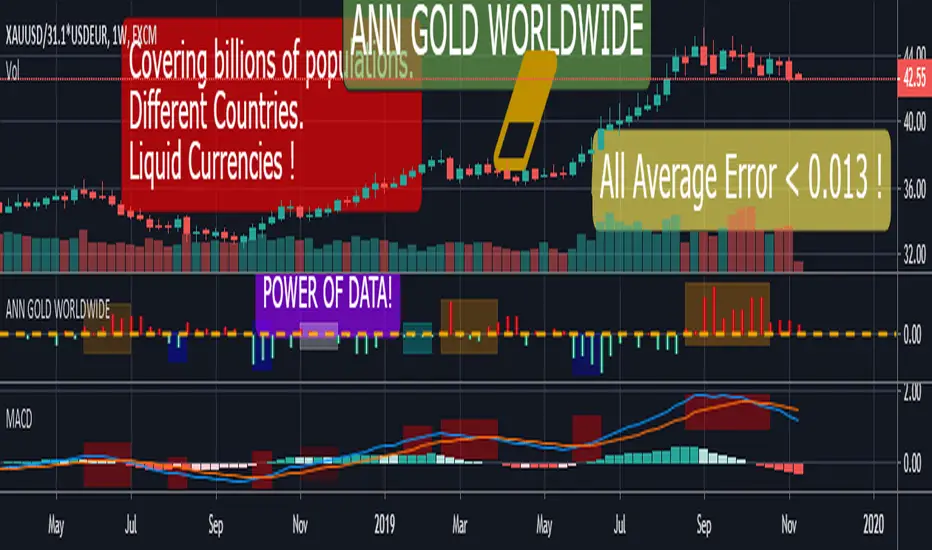
ANN GOLD WORLDWIDE This script consists of converting the value of 1 gram and / or 1 ounce of gold according to the national currencies into a system with artificial neural networks.
Why did I feel such a need?
Even though the printed products in the market are digitally circulated, only precious metals are available in full or near full.
Silver is difficult to carry because you have to buy too much because the unit price is low.
Platinum is very difficult to find and used in industry.
Gold is both practical and has less volatile movements, even more balanced than dollars, to preserve the value of money.
Uncertainty and tensions benefit gold.
Obviously this is my own opinion and is not worth the investment advice:
If there is to be an economic crisis, it is obvious that the dollar will rise against the emerging currencies, but I expect a crisis where gold and the dollar will rise together.
The world has been on a mercantilist line more than ever!
Spot gold can be bought from goldsmiths and banks.
I think this command will benefit people everywhere but in economies that are subject to developing currencies.
Now we can look at the details:
All you have to do is load the appropriate chart and select it from the menu.
Thus, the system will adjust itself to that instrument.
MENU and Tickers :
"GOLD" : XAUUSD or GC1! or GOLD (Average error = 0.0128)
"GOLDSILVER" : XAUXAG or GOLDSILVER (Gold Silver Ratio ) ( Average error : 0.01 )
"GOLD CZK " : XAUUSD/USDCZK ( 1 Ounce Gold Czech Koruna) ( Average error = 0.010879 )
"GOLD NZD " : XAUUSD/USDNZD ( 1 Ounce Gold New Zealand Dollar ) (Average error = 0.010736 )
"GOLD EURO" : XAUUSD/USDEUR ( 1 Ounce Gold Euro) ( Average error = 0.010000 )
"GOLD HUF " : XAUUSD/USDHUF ( 1 Ounce Gold Hungarian Forint ) ( Average error = 0.010000 )
"GOLD INR " : XAUUSD/USDINR (1 Ounce Gold Indian Rupee ) (Average error = 0.010458 )
"GOLD DKK" : XAUUSD/USDDKK (1 Ounce Gold Danish Krone) (Average error = 0.010671 )
"GOLD CHF" : XAUUSD/USDCHF (1 Ounce Gold Swiss Franc ) (Average error = 0.010967 )
"GOLD CNH" : XAUUSD/USDCNH(1 Ounce Gold Offshore RMB) (Average error = 0.012017 )
"GOLD MXN" : XAUUSD/USDMXN(1 Ounce Gold Mexican Peso) (Average error = 0.010000 )
"GOLD PLN" : XAUUSD/USDPLN (1 Ounce Gold Polish Zloty ) (Average error = 0.010173 )
"GOLD ZAR" : XAUUSD/USDZAR (1 Ounce Gold South African Rand (Average error = 0.010484 )
"GOLD NOK" : XAUUSD/USDNOK (1 Ounce Gold Norwegian Krone ) (Average error = 0.010842 )
"GOLD TRY" : XAUUSD/USDTRY (1 Ounce Gold Turkish Lira ) (Average error = 0.010000 )
"GOLD THB" : XAUUSD/USDTHB (1 Ounce Gold Thai Baht ) (Average error = 0.011747 )
Important note : XAUUSD/USDCUR = 1 Ounce Gold , XAUUSD/31.1*USDCUR = 1 gram Gold (CUR = Currency )
If you want to physically hold it, look gram value, because as far as I know, all goldsmiths and jewelleries in the world are selling gram gold.
I think that this command is the most useful and the concrete one that I have ever written.
I end my sentences with this anonymous proverb :
"Even if gold falls into the mud, it's still gold ! "
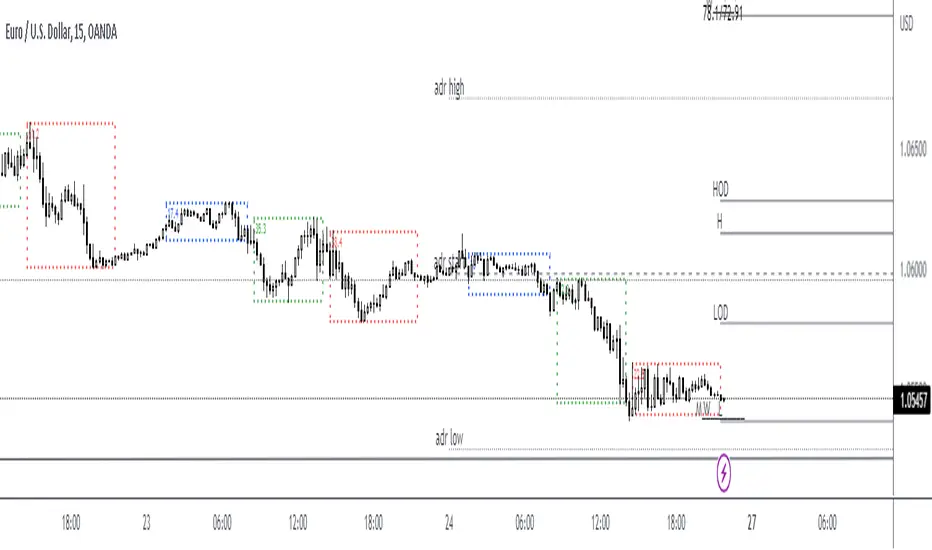
Average Daily Range Label by Theoris (ADR)This indy show Label of
* Last price
* Range of Low - High ( from Average daily range calculation )
* ADR (14 ) default period 14
* value of current range ( pip ) / Average daily range.
Example
now price is
1499.4
( 1486.959 - 1510.841 ) --- > This is range calculate from ADR for normal range.
ADR(14)
58/148.41
meaning use ADR period 14
today run 58 pips
from average 14 period is 148.41 pips
can change period to other normally I use 10 or 14
Timeframe to use default is Daily
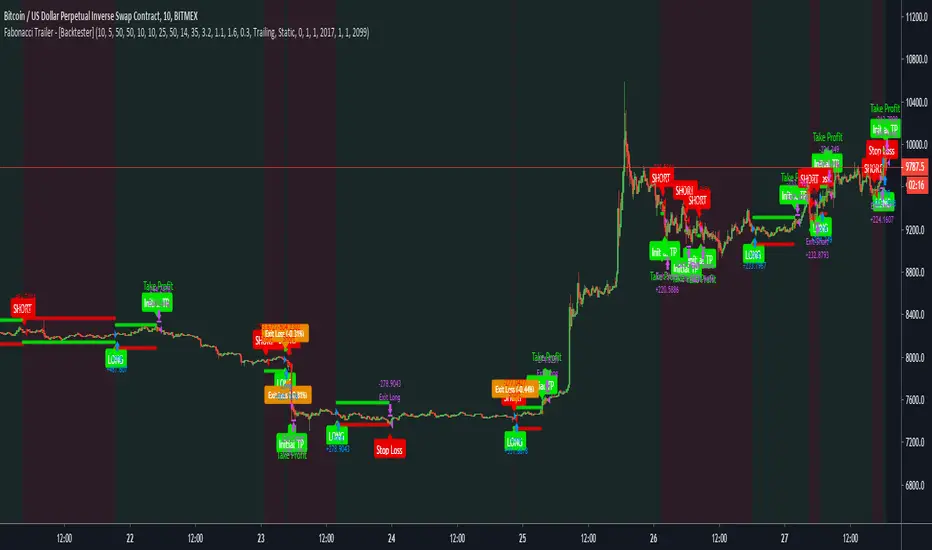
Fabonacci Trailer - [Backtester]This study comes with the following indicators and features:
ADX indicator
Chop indicator
Super Trend indicator
Trailing Take Profit and Stop Loss
Entry, Take Profit, and Stop Loss Alerts
Renko chart support
And a few more indicators in the back-end to increase accuracy and optimize entries
The study version with all alerts can be found in my profile. It is not repainting and we advise to use alerts on “Once Per Bar Close”.
Please note that this script is based on invite only.
Fabonacci Trailer - [Alerts]This script comes with the following indicators and features:
ADX indicator
Chop indicator
Super Trend indicator
Trailing Take Profit and Stop Loss
Entry, Take Profit, and Stop Loss Alerts
Renko chart support
And a few more indicators in the back-end to increase accuracy and optimize entries
This script works really well as a scalper on lower Time Frames as well as on higher Time Frames. Besides that you can also use it on pretty much any coin or asset.
This script is not repainting. We advise to use alerts on “Once Per Bar Close”.
If you’d like to automate this script you can do that by using AutoView, ProfitView, ProfitTrailer, CryptoHopper etc.
Please note that this script is based on invite only.

MA Crossover [Alerts]This is a Moving Average Crossover study .
The study comes with all alerts (Long, Short, Take Profit, and Stop Loss).
A few visuals like Exit Loss and Profit/Loss Boxes have been added as well.
The following Moving Averages are supported:
SMA
EMA
DEMA
TEMA
WMA
VWMA
SMMA
HullMA
LSMA
ALMA
SSMA
TMA
ZLEMA
If you’d like to automate this script you can do that by using AutoView, ProfitView, ProfitTrailer, CryptoHopper etc.
Feel free to leave a comment and share it with your friends. Enjoy!

OracleWhere to use?
Oracle gives the best performance on ETH/USD but also works for BTC/USD and some other charts like XAU/USD ( Gold ). Fails for almost all other cryptocurrencies.
Use 1d or 4h time frames only. 2h and 3h also work in some cases. Use Heikin Ashi candles for the best results.
The strategy is still being tested. Use at your own risk.
How to use?
Arrows start pointing upwards and candle closes above the Orange line - Price is likely to go up
Arrows start pointing downwards and candle closes below the Orange line - Price is likely to go down
Also, the orange line can be used as a mental stop loss point.

ANN MACD GOLD (XAUUSD)This script aims to establish artificial neural networks with gold data.(4H)
Details :
Learning cycles: 329818
Training error: 0.012767 ( Slightly above average but negligible.)
Input columns: 19
Output columns: 1
Excluded columns: 0
Training example rows: 300
Validating example rows: 0
Querying example rows: 0
Excluded example rows: 0
Duplicated example rows: 0
Input nodes connected: 19
Hidden layer 1 nodes: 5
Hidden layer 2 nodes: 1
Hidden layer 3 nodes: 0
Output nodes: 1
Learning rate: 0.7000
Momentum: 0.8000
Target error: 0.0100
NOTE : Alarms added.
And special thanks to dear wroclai for his great effort.
Deep learning series will continue . Stay tuned! Regards.
