Trend Impulse Channels (Zeiierman)Jun 8
Support & Resistance Aries
This indicator automatically identifies support and resistance levels based on the highest and lowest closing prices within a configurable period.
How it works:
The user sets a calculation period (default is 20 candles).
The indicator plots:
Green line = Support: lowest closing price within the period.
Red line = Resistance: highest closing price within the period.
Adjustable parameter:
Calculation Period (1 to 200): defines how many candles are used to find the price extremes.
Purpose:
Helps users quickly visualize dynamic support and resistance zones that adjust as price evolves, making it easier to identify areas for potential entries, exits, and stop placements.
Important:
This indicator should not be used as a standalone buy or sell signal, nor as a trend confirmation tool on its own.
It is recommended to use it in combination with other technical analysis tools such as MACD, RSI, Volume, Moving Averages, among others, for a more complete market view.
Disclaimer:
Investing involves financial risk. Be cautious with both profits and losses. Always define a stop loss to avoid larger losses if the trend reverses.
One of the golden rules in trading is: a trader should not lose more than 3% to 5% of their capital per trade. Protecting your capital should always be the priority.
Emtialar

Silver Bullet🎯 Silver Bullet Macro Time & Bias Framework
The Silver Bullet script is a complete framework for identifying high-probability trading windows and directional bias, inspired by ICT concepts.
✅ Key Features:
• Macro Sessions Detection – Automatically identifies key time windows (ICT Killzones or custom hours) on any timeframe.
• Dynamic Session Boxes – Visual boxes marking each session’s high/low range.
• Bias Calculation – Determines Long or Short bias using price action within the session.
• Fibonacci Levels – Automatically draws Fibonacci retracements and extensions relative to session ranges.
• Adaptive Labels & Tables – Clear labels showing session range, bias, entry, target, and stop levels.
• Customizable Timezones & Styles – Supports all chart timezones, different text sizes, and flexible display positions.
⸻
📈 Optimized for the 5-Minute Chart, but can be applied to other intraday timeframes.
🌐 Learn more & contact support: www.macrobullet.trade

RSI Multi-Timeframe Dashboard by giua64)### Summary
This is an advanced dashboard that provides a comprehensive overview of market strength and momentum, based on the Relative Strength Index (RSI) analyzed across 6 different timeframes simultaneously (from 5 minutes to the daily chart).
The purpose of this script is to offer traders an immediate and easy-to-read summary of market conditions, helping to identify the prevailing trend direction, overbought/oversold levels, and potential reversals through divergence detection. All of this is available in a single panel, eliminating the need to switch timeframes on your main chart.
### Key Features
* **Multi-Timeframe Analysis:** Simultaneously monitors the 5m, 15m, 30m, 1H, 4H, and Daily timeframes.
* **Scoring System:** Each timeframe is assigned a score based on multiple RSI conditions (e.g., above/below 50, overbought/oversold status, direction) to quantify bullish or bearish strength.
* **Aggregated Signal:** The dashboard calculates a total percentage score and provides a clear summary signal: **LONG**, **SHORT**, or **WAIT**.
* **Divergence Detection:** Automatically identifies Bullish and Bearish divergences between price and RSI for each timeframe.
* **Non-Repainting Option:** In the settings, you can choose to base calculations on the close of the previous candle (`Use RSI on Closed Candle`). This ensures that past signals (like status and score) do not change, providing more reliable data for analysis.
* **Fully Customizable:** Users can modify the RSI period, overbought/oversold thresholds, divergence detection settings, and the appearance of the table.
### How to Read the Dashboard
The table consists of 6 columns, each providing specific information:
* **% (Total Score):**
* **Header:** Shows the overall strength as a percentage. A positive value indicates bullish momentum, while a negative value indicates bearish momentum. The background color changes based on intensity.
* **Rows:** Displays the numerical score for the individual timeframe.
* **RSI:**
* **Header:** The background color indicates the average of all RSI values. Green if the average is > 50, Red if < 50.
* **Rows:** Shows the real-time RSI value for that timeframe.
* **Signal (Status):**
* **Header:** This is the final operational signal. It turns **🟢 LONG** when bullish strength is high, **🔴 SHORT** when bearish strength is high, and **⚪ WAIT** in neutral conditions.
* **Rows:** Describes the RSI status for that timeframe (e.g., Bullish, Bearish, Overbought, Oversold).
* **Dir (Direction):**
* **Header:** Displays an arrow representing the majority direction across all timeframes.
* **Rows:** Shows the instantaneous direction of the RSI (↗️ for rising, ↘️ for falling).
* **Diverg (Divergence):**
* Indicates if a bullish (`🟢 Bull`) or bearish (`🔴 Bear`) divergence has been detected on that timeframe.
* **TF (Timeframe):**
* Indicates the reference timeframe for that row.
### Advantages and Practical Use
This tool was created to solve a common problem: the need to analyze multiple charts to understand the bigger picture. With this dashboard, you can:
1. **Confirm a Trend:** A predominance of green and a "LONG" signal provides strong confirmation of bullish sentiment.
2. **Identify Weakness:** Red signals on higher timeframes can warn of an impending loss of momentum.
3. **Spot Turning Points:** A divergence on a major timeframe can signal an excellent reversal opportunity.
### Originality and Acknowledgements
This script is an original work, written from scratch by giua64. The idea was to create a comprehensive and visually intuitive tool for RSI analysis.
Any feedback, comments, or suggestions to improve the script are welcome!
**Disclaimer:** This is a technical analysis tool and should not be considered financial advice. Always do your own research and backtest any tool before using it in a live trading environment.
Script open-source
In pieno spirito TradingView, il creatore di questo script lo ha reso open-source, in modo che i trader possano esaminarlo e verificarne la funzionalità. Complimenti all'autore! Sebbene sia possibile utilizzarlo gratuitamente, ricorda che la ripubblicazione del codice è soggetta al nostro Regolamento.
giua64
borsamercati.it – Educational tools by giua64
Anche su:
Declinazione di responsabilità
Le informazioni ed i contenuti pubblicati non costituiscono in alcun modo una sollecitazione ad investire o ad operare nei mercati finanziari. Non sono inoltre fornite o supportate da TradingView. Maggiori dettagli nelle Condizioni d'uso.

CHN BUY SELL with EMA 200Overview
This indicator combines RSI 7 momentum signals with EMA 200 trend filtering to generate high-probability BUY and SELL entry points. It uses colored candles to highlight key market conditions and displays clear trading signals with built-in cooldown periods to prevent signal spam.
Key Features
Colored Candles: Visual momentum indicators based on RSI 7 levels
Trend Filtering: EMA 200 confirms overall market direction
Signal Cooldown: Prevents over-trading with adjustable waiting periods
Clean Interface: Simple BUY/SELL labels without clutter
How It Works
Candle Coloring System
Yellow Candles: Appear when RSI 7 ≥ 70 (overbought momentum)
Purple Candles: Appear when RSI 7 ≤ 30 (oversold momentum)
Normal Candles: All other market conditions
Trading Signals
BUY Signal: Triggered when closing price > EMA 200 AND yellow candle appears
SELL Signal: Triggered when closing price < EMA 200 AND purple candle appears
Signal Cooldown
After a BUY or SELL signal appears, the same signal type is suppressed for a specified number of candles (default: 5) to prevent excessive signals in ranging markets.
Settings
RSI 7 Length: Period for RSI calculation (default: 7)
RSI 7 Overbought: Threshold for yellow candles (default: 70)
RSI 7 Oversold: Threshold for purple candles (default: 30)
EMA Length: Period for trend filter (default: 200)
Signal Cooldown: Candles to wait between same signal type (default: 5)
How to Use
Apply the indicator to your chart
Look for yellow or purple colored candles
For LONG entries: Wait for yellow candle above EMA 200, then enter BUY when signal appears
For SHORT entries: Wait for purple candle below EMA 200, then enter SELL when signal appears
Use appropriate risk management and position sizing
Best Practices
Works best on timeframes M15 and higher
Suitable for Forex, Gold, Crypto, and Stock markets
Consider market volatility when setting stop-loss and take-profit levels
Use in conjunction with proper risk management strategies
Technical Details
Overlay: True (plots directly on price chart)
Calculation: Based on RSI momentum and EMA trend analysis
Signal Logic: Combines momentum exhaustion with trend direction
Visual Feedback: Colored candles provide immediate market condition awareness

Adaptive Multi-TF Indicator Table with Presets giua64📌 Script Name:
Adaptive Multi-Timeframe Indicator Table with Presets — giua64
📄 Description:
This script displays an adaptive multi-timeframe dashboard that summarizes the signals of three key technical indicators:
Moving Averages (MAs), Relative Strength Index (RSI), and MACD.
It provides a fast and visually intuitive overview of market conditions across five timeframes (5m, 15m, 30m, 1h, 4h), helping traders quickly identify potential directional biases (e.g., bullish, bearish, or neutral) based on either predefined presets or fully manual settings.
🧰 Preset Configurations:
You can choose between four trading styles, each with optimized indicator parameters:
Scalping
• MAs: 5 / 10 (Fast), 20 / 50 (Slow)
• RSI: 7 periods | Overbought: 70 | Oversold: 30
• MACD: 5 / 13 | Signal: 3
Intraday
• MAs: 9 / 21 (Fast), 50 / 100 (Slow)
• RSI: 14 periods | Overbought: 60 | Oversold: 40
• MACD: 12 / 26 | Signal: 9
Swing
• MAs: 10 / 20 (Fast), 50 / 200 (Slow)
• RSI: 14 periods | Overbought: 65 | Oversold: 35
• MACD: 12 / 26 | Signal: 9
Manual
• Full custom control over all indicator settings.
🛠️ All settings can be customized manually from the options panel, including the exact MA periods, RSI thresholds, and MACD structure.
🧠 How It Works:
For each timeframe, the script evaluates:
MA crossover status (two levels):
The first symbol refers to the crossover of the fast MAs
The second symbol refers to the crossover of the slow MAs
🟢 = Bullish crossover
🔴 = Bearish crossover
➖ = Flat or no clear signal
RSI Direction:
↑ = RSI above upper threshold (potential overbought)
↓ = RSI below lower threshold (potential oversold)
→ = RSI in neutral range
MACD Line vs Signal Line:
↑ = MACD line is above signal line (bullish)
↓ = MACD line is below signal line (bearish)
→ = Flat or neutral signal
Each signal is assigned a numerical score. These are aggregated per timeframe to compute a combined score that reflects the directional bias for that specific time window.
🧠 Adaptive Logic by Asset:
This script is designed to be universally compatible across all asset types — including forex, crypto, stocks, indices, and commodities.
Thanks to its multi-timeframe nature and flexible indicator presets, the script automatically adjusts its behavior based on the asset selected, ensuring relevant analysis without requiring manual recalibration.
🧾 Summary Table Output:
At the bottom of the dashboard, a combined sentiment is displayed for:
3TF → 5m, 15m, 30m
4TF → Adds 1h
5TF → Adds 4h
Each row shows:
Signal → LONG / SHORT / NEUTRAL
Confidence (%) → Based on score aggregation and signal consistency
📌 Customization Options:
Table Position: Left, Right, or Center
Text Size: Small, Normal, or Large
Full Manual Configuration: All MA, RSI, and MACD parameters can be adjusted as needed
⚠️ Disclaimer:
This script is for educational and analytical purposes only.
It does not constitute financial advice or guarantee any trading results.
Always do your own research and apply responsible risk management.

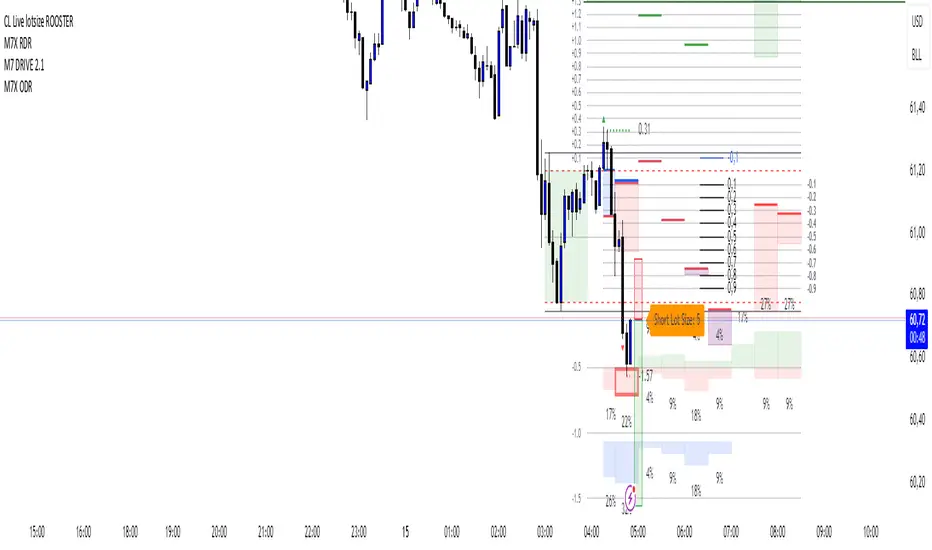
CL Live lotsize ROOSTER📄 Description:
This is a utility script designed for manual futures traders who enter with market orders and want to size their positions precisely based on $ risk.
⚙️ Features:
✅ Calculates live contract size based on:
A fixed dollar risk amount (e.g. $100)
A manually set static stop-loss price
The live market price as your entry
✅ Uses a configurable risk-reward ratio (e.g. 1:3)
✅ Plots entry, stop, and target levels on the chart
✅ Displays calculated contract size as a floating label
🎯 Why this tool?
Built to support fast execution workflows , this tool helps traders who:
Enter trades at candle close or open
Want to pre-calculate their market order size before the signal
Prefer a visual, consistent, real-time R:R validation system
Avoid fumbling with the long/short position tool at the last second
🔧 Settings:
Static Stop-Loss Price: Enter the price level where you'd place your SL
Account Risk ($): How much you’re willing to risk per trade
Risk-Reward Ratio: Set your target multiplier (e.g. 3 for 3R)
ATR Volatility giua64ATR Volatility giua64 – Smart Signal + VIX Filter
📘 Script Explanation (in English)
Title: ATR Volatility giua64 – Smart Signal + VIX Filter
This script analyzes market volatility using the Average True Range (ATR) and compares it to its moving average to determine whether volatility is HIGH, MEDIUM, or LOW.
It includes:
✅ Custom or preset configurations for different asset classes (Forex, Indices, Gold, etc.).
✅ An optional external volatility index input (like the VIX) to refine directional bias.
✅ A directional signal (LONG, SHORT, FLAT) based on ATR strength, direction, and external volatility conditions.
✅ A clean visual table showing key values such as ATR, ATR average, ATR %, VIX level, current range, extended range, and final signal.
This tool is ideal for traders looking to:
Monitor the intensity of price movements
Filter trading strategies based on volatility conditions
Identify momentum acceleration or exhaustion
⚙️ Settings Guide
Here’s a breakdown of the user inputs:
🔹 ATR Settings
Setting Description
ATR Length Number of periods for ATR calculation (default: 14)
ATR Smoothing Type of moving average used (RMA, SMA, EMA, WMA)
ATR Average Length Period for the ATR moving average baseline
🔹 Asset Class Preset
Choose between:
Manual – Define your own point multiplier and thresholds
Forex (Pips) – Auto-set for FX markets (high precision)
Indices (0.1 Points) – For index instruments like DAX or S&P
Gold (USD) – Preset suitable for XAU/USD
If Manual is selected, configure:
Setting Description
Points Multiplier Multiplies raw price ranges into useful units (e.g., 10 for Gold)
Low Volatility Threshold Threshold to define "LOW" volatility
High Volatility Threshold Threshold to define "HIGH" volatility
🔹 Extended Range and VIX
Setting Description
Timeframe for Extended High/Low Used to compare larger price ranges (e.g., Daily or Weekly)
External Volatility Index (VIX) Symbol for a volatility index like "VIX" or "EUVI"
Low VIX Threshold Below this level, VIX is considered "low" (default: 20)
High VIX Threshold Above this level, VIX is considered "high" (default: 30)
🔹 Table Display
Setting Description
Table Position Where the visual table appears on the chart (e.g., bottom_center, top_left)
Show ATR Line on Chart Whether to display the ATR line directly on the chart
✅ Signal Logic Summary
The script determines the final signal based on:
ATR being above or below its average
ATR rising or falling
ATR percentage being significant (>2%)
VIX being high or low
Conditions Signal
ATR rising + high volatility + low VIX LONG
ATR falling + high volatility + high VIX SHORT
ATR flat or low volatility or low %ATR FLAT

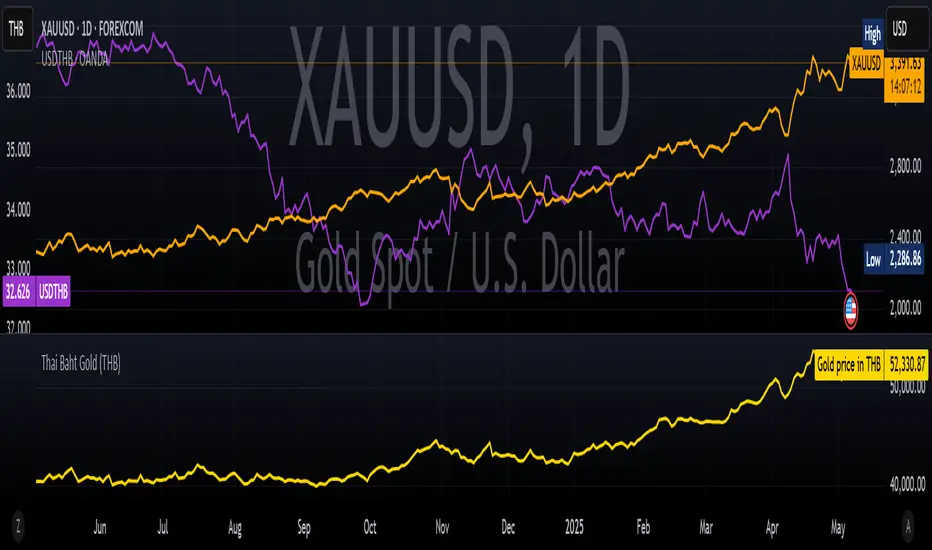
Thai Gold BahtIndicator Name: Thai Gold Baht
Short Title: Thai Gold Baht
Purpose
This indicator calculates and visualizes the real-time price of 1 Thai Gold Baht (15.244 grams) based on the global gold price ( XAU/USD ) and the USD/THB exchange rate .
Users can customize gold weight and purity to simulate the local Thai gold market price.
What it does
Retrieves live gold price per troy ounce in USD
Retrieves current USD to Thai Baht exchange rate
Converts the value using user-defined weight and purity
Displays result as a real-time chart
Shows calculation details in the Data Window
Ideal for
Traders tracking Thai gold based on international prices
Analysts comparing local and global bullion markets
Anyone needing a configurable, transparent gold price conversion
Pine Script Functionality
// Uses XAU/USD and USD/THB as inputs
// Calculates 1 Baht Gold (96.5% default purity)
// Outputs the value in THB as a chart line
ชื่ออินดิเคเตอร์: Thai Gold Baht
ชื่อย่อ: Thai Gold Baht
วัตถุประสงค์
อินดิเคเตอร์นี้ใช้คำนวณและแสดงราคาทองคำไทย 1 บาท (15.244 กรัม) แบบเรียลไทม์
โดยอ้างอิงจากราคาทองคำในตลาดโลก ( XAU/USD ) และอัตราแลกเปลี่ยน USD/THB
ผู้ใช้สามารถกำหนดน้ำหนักทองและความบริสุทธิ์เองได้ เพื่อจำลองราคาทองคำในประเทศไทยอย่างแม่นยำ
สิ่งที่อินดิเคเตอร์นี้ทำ
ดึงราคาทองคำแบบเรียลไทม์ต่อทรอยออนซ์ในสกุลเงิน USD
ดึงอัตราแลกเปลี่ยน USD → THB แบบเรียลไทม์
คำนวณราคาจากน้ำหนักและเปอร์เซ็นต์ความบริสุทธิ์ที่ผู้ใช้กำหนด
แสดงผลลัพธ์เป็นกราฟแบบเรียลไทม์ในหน่วยบาทไทย
แสดงรายละเอียดการคำนวณในหน้าต่าง Data Window ของ TradingView
เหมาะสำหรับ
นักเทรดที่ต้องการติดตามราคาทองคำไทยจากราคาทองคำตลาดโลก
นักวิเคราะห์ที่เปรียบเทียบราคาทองคำในประเทศและต่างประเทศ
ผู้ใช้งานที่ต้องการการแปลงราคาทองคำระหว่างประเทศให้โปร่งใสและปรับแต่งได้
การทำงานของ Pine Script
// ใช้ข้อมูล XAU/USD และ USD/THB เป็นอินพุต
// คำนวณราคาทองคำไทย 1 บาท (ความบริสุทธิ์เริ่มต้นที่ 96.5%)
// แสดงผลเป็นเส้นกราฟของราคาทองคำในหน่วยบาทไทย
Gold/Silver RatioOverview
This indicator displays the Gold/Silver Ratio by dividing the price of gold (XAUUSD) by the price of silver (XAGUSD) on the same timeframe. It is a widely used tool in macroeconomic and precious metals analysis, helping traders and investors evaluate the relative value of gold compared to silver.
📈 What it does
Plots the ratio between gold and silver prices as a line on the chart.
Displays two key horizontal levels:
Overbought level at 90 (dashed red line).
Oversold level at 70 (dashed green line).
Highlights the chart background to show extreme conditions:
Red shading when the ratio exceeds 90 (gold is likely overvalued relative to silver).
Green shading when the ratio drops below 70 (silver is likely overvalued relative to gold).
🧠 How to Use
When the ratio exceeds 90, it suggests that gold may be overbought or silver may be undervalued. Historically, these have been good times to consider shifting exposure from gold to silver.
When the ratio falls below 70, it may indicate silver is overbought or gold is undervalued.
This tool is best used in conjunction with technical analysis, macroeconomic trends, or RSI/Bollinger Bands applied to the ratio.
⚙️ Inputs
This version of the script uses OANDA's XAUUSD and XAGUSD pairs for spot gold and silver prices. You may edit the request.security() calls to change data sources (e.g., FXCM, FOREXCOM, or CFD tickers from your broker).
✅ Best For:
Macro traders
Commodity investors
Ratio and spread traders
Long-term portfolio reallocators

Global M2 [BizFing]MARKETSCOM:BITCOIN ECONOMICS:USM2
This is an indicator designed to show the correlation between the global M2 money supply and Bitcoin.
This indicator basically provides a Global M2 index by summing the M2 money supply data from the United States, South Korea, China, Japan, the EU, and the United Kingdom.
Furthermore, it is configured to allow you to add or remove the M2 data of desired countries within the settings.
I hope this proves to be a small aid in predicting the future price of Bitcoin.
If you have any questions or require any improvements while using it, please feel free to contact me.
Thank you.

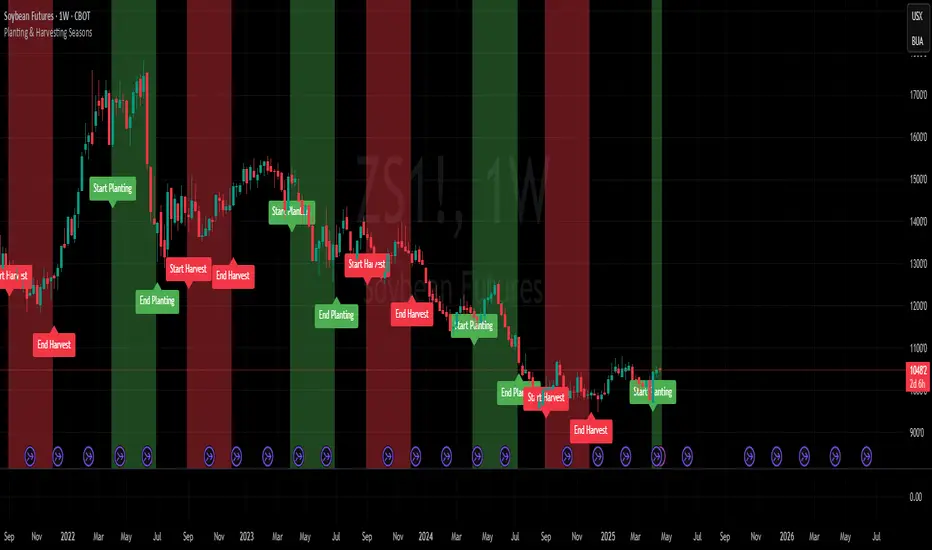
Planting & Harvesting SeasonsHello all,
as a commodity trader, I use a lot of seasonal patterns in my analysis. Some time ago, I came up with the idea to develop a simple script that visually overlays the typical planting and harvesting periods for key agricultural futures directly on the chart.
This script automatically detects the underlying commodity based on the symbol (e.g. ZC, ZW, ZS, CT) and displays color-coded zones for each seasonal window. These zones are based on historical crop calendars and help identify when planting or harvesting typically takes place. The goal is to better align technical setups with fundamental seasonal factors.
This is a basic version and meant as a visual aid — not a trading signal in itself.
Hope you enjoy it and any feedback is highly appreciated!
Gas/Oil SpreadGas/Oil Spread Analyzer with Static Overbought/Oversold Zones
This indicator measures the spread between the actual price of natural gas and its oil-based equivalent, derived from a defined oil/gas ratio. It helps traders identify potential mispricings and mean-reversion opportunities between the two energy commodities.
Key Features:
- Calculates spread: Gas Price – Oil-Based Equivalent Price
- Supports dynamic or static oil/gas ratio
- Plots a smoothed version of the spread (SMA)
- Displays static overbought and oversold zones to highlight extreme deviations
Use Cases:
- Detect overvalued or undervalued gas relative to oil
- Spot potential reversion setups in intermarket trading
- Evaluate energy market dislocations and hedging opportunities

Oil/gas ratio MAOil/Gas Ratio-Based Equivalent Price
This indicator calculates the gas-equivalent price based on the current oil price and a defined oil/gas ratio. It helps identify relative overvaluation or undervaluation of natural gas compared to oil.
Features:
- Choose between a static or dynamic (SMA-based) oil/gas ratio
- Displays the fair value of gas derived from oil prices
- Works with any oil ticker symbol (e.g. BRENT, USOIL, etc.)
Useful for traders analyzing intermarket relationships and looking for relative value signals between energy commodities.

Reversal Strength Meter – Adib NooraniThe Reversal Strength Meter is an oscillator designed to identify potential reversal zones based on supply and demand dynamics. It uses smoothed stochastic logic to reduce noise and highlight areas where momentum may be weakening, signaling possible market turning points.
🔹 Smooth, noise-reduced stochastic oscillator
🔹 Custom zones to highlight potential supply and demand imbalances
🔹 Non-repainting, compatible across all timeframes and assets
🔹 Visual-only tool — intended to support discretionary trading decisions
This oscillator assists scalpers and intraday traders in tracking subtle shifts in momentum, helping them identify when a market may be preparing to reverse — always keeping in mind that trading is based on probabilities, not certainties.
📘 How to Use the Indicator Efficiently
For Reversal Trading:
Buy Setup
– When the blue line dips below the 20 level, wait for it to re-enter above 20.
– Look for reversal candlestick patterns (e.g., bullish engulfing, hammer, or morning star).
– Enter above the pattern’s high, with a stop loss below its low.
Sell Setup
– When the blue line rises above the 80 level, wait for it to re-enter below 80.
– Look for bearish candlestick patterns (e.g., bearish engulfing, inverted hammer, or evening star).
– Enter below the pattern’s low, with a stop loss above its high.
🛡 Risk Management Guidelines
Risk only 0.5% of your capital per trade
Book 50% profits at a 1:1 risk-reward ratio
Trail the remaining 50% using price action or other supporting indicators

Reversal Scalping Ribbon - Adib NooraniThe Reversal Scalping Ribbon is a trend-following overlay tool designed to visually identify potential reversal zones based on price extremes and dynamic volatility bands. It calculates adaptive upper and lower bands using price action and custom ATR logic, helping traders quickly assess market direction and possible turning points
🔹 Volatility-adjusted bands based on price highs/lows
🔹 Color-coded ribbons to indicate trend bias and potential reversal shifts
🔹 No repainting, works on all timeframes and assets
🔹 Visual-only display, no trade signals — supports discretion-based entries
This ribbon is designed for scalpers and intraday traders to spot reversal setups with clarity. It enhances your trading by showing real-time market bias without unnecessary distractions. By focusing on probabilities, it helps to improve decision-making in fast-paced environments
How to use the indicator efficiently
For Reversal Trading:
Buy: When price closes below the green ribbon with a red candle, then re-enters with a green candle. Enter above the high of the green candle with a stop loss below the lowest low of the recent green/red candles
Sell: When price closes above the red ribbon with a green candle, then re-enters with a red candle. Enter below the low of the red candle with a stop loss above the highest high of the recent red/green candles
Risk Management:
Limit risk to 0.5% of your capital per trade
Take 50% profit at a 1:1 risk-reward ratio
For the remaining 50%, trail using the lower edge of the green band for buys and the upper edge of the red band for sells

BeSight Mega SpotBeSight Mega Spot – Zone Based Price Grid Indicator
สคริปต์นี้ถูกออกแบบมาเพื่อช่วยเทรดเดอร์มองเห็นโซนราคาสำคัญที่ราคาอาจเกิดปฏิกิริยา โดยอ้างอิงจากระดับราคาที่ลงท้ายด้วย 0 และ 5 (เช่น 1350, 1355, 1360 เป็นต้น) ซึ่งมักเป็นระดับที่มีการตั้งคำสั่งซื้อขายจำนวนมากในตลาด
BeSight Mega Spot – Zone-Based Price Grid Indicator
This indicator is designed to help traders visualize key price zones where the market often reacts, based on price levels ending with 0 or 5 (e.g., 1350, 1355, 1360). These levels are commonly used for pending orders, liquidity, or price clustering zones.
It displays horizontal grid lines at fixed step intervals (default: every 5 points), covering the entire visible price range of the chart. Each price level is labeled for better clarity and planning.
🟦 Blue lines: Price levels ending in 0
⬜ Gray lines: Price levels ending in 5
This tool is useful for identifying potential institutional behavior zones, price consolidation, accumulation/distribution areas, or psychological support/resistance levels.
🧠 Notes:
- This indicator is not a buy/sell signal tool or predictive system.
- It works best when used in conjunction with other technical tools such as Supply/Demand zones or Smart Money Concepts (SMC) analysis.
- Compatible with all instruments: stocks, futures, forex, crypto, etc.
✅ How to use:
1. Add the indicator to your chart
2. Observe how price interacts with the 0/5 grid zones
3. Use the lines to assist with breakout, retest, or reversal planning
4. Combine with price action or other indicators for higher precision
✨ Developed by BeSight – A Community Of Traders
---------------------------------------------------------------------------------------
อินดิเคเตอร์นี้จะแสดงเส้นแนวนอนแบบตาราง (Grid) ที่แบ่งช่วงราคาออกเป็นระยะ ๆ ตามค่าที่ผู้ใช้กำหนด เช่น ทุก ๆ 5 จุด และครอบคลุมช่วงราคาทั้งหมดของกราฟ โดยแสดงเป็นเส้นแบบ dotted พร้อมป้ายราคาเพื่อให้มองเห็นได้ชัดเจน
🟦 เส้นสีน้ำเงิน: แสดงระดับราคาที่ลงท้ายด้วย 0
⬜ เส้นสีเทา: แสดงระดับราคาที่ลงท้ายด้วย 5
เหมาะสำหรับผู้ที่ต้องการดูโซนราคา "หยุดพัก / เก็บของ / เปิดโพซิชัน" ซึ่งอาจสะท้อนพฤติกรรมของผู้เล่นรายใหญ่หรือสถาบันในตลาด
🧠 ข้อควรรู้:
- อินดิเคเตอร์นี้ไม่ได้บอกจุดเข้าเทรดหรือการคาดการณ์ แต่ช่วยในการวางแผนแนวรับ-แนวต้านร่วมกับเครื่องมือวิเคราะห์อื่น ๆ
- รองรับทุกสินทรัพย์ที่มีหน่วยราคาคงที่ (หุ้น, ฟิวเจอร์ส, ฟอเร็กซ์, คริปโต ฯลฯ)
✅ วิธีใช้งาน:
1. เพิ่มอินดิเคเตอร์นี้ลงบนกราฟ
2. ใช้เส้น Grid เป็นแนวประกอบในการดูพฤติกรรมราคา เช่น การหยุดลง, การเบรกแนว, การกลับตัว
3. ผสมผสานกับโซน Demand/Supply หรือโซน SMC เพื่อความแม่นยำ
✨ พัฒนาโดย BeSight – คอมมูนิตี้ของเทรดเดอร์ตัวจริง

RiskCalc FX & GoldRiskCalc FX & Gold is a multi-market position sizing tool designed to help you manage risk quickly and accurately. With this script, simply enter your account capital, the percentage of risk you wish to take, and your stop in ticks. Depending on the selected market—Forex or XAUUSD—the script automatically adjusts its calculations:
Forex: Assumes 1 lot equals 100,000 units.
XAUUSD: Assumes 1 lot equals 100 ounces.
The script calculates your risk in dollars and, using a fixed value of 1 USD per tick per lot, determines the ideal position size in both lots and total contracts. Results are displayed in a clear, centralized table at the top of the chart for real-time decision-making.
Perfect for traders operating across multiple markets who need an automated and consistent approach to risk management.

Economic Crises by @zeusbottradingEconomic Crises Indicator by @zeusbottrading
Description and Use Case
Overview
The Economic Crises Highlight Indicator is designed to visually mark major economic crises on a TradingView chart by shading these periods in red. It provides a historical context for financial analysis by indicating when major recessions occurred, helping traders and analysts assess the performance of assets before, during, and after these crises.
What This Indicator Shows
This indicator highlights the following major economic crises (from 1953 to 2020), which significantly impacted global markets:
• 1953 Korean War Recession
• 1957 Monetary Tightening Recession
• 1960 Investment Decline Recession
• 1969 Employment Crisis
• 1973 Oil Crisis
• 1980 Inflation Crisis
• 1981 Fed Monetary Policy Recession
• 1990 Oil Crisis and Gulf War Recession
• 2001 Dot-Com Bubble Crash
• 2008 Global Financial Crisis (Great Recession)
• 2020 COVID-19 Recession
Each of these periods is shaded in red with 80% transparency, allowing you to clearly see the impact of economic downturns on various financial assets.
How This Indicator is Useful
This indicator is particularly valuable for:
✅ Comparative Performance Analysis – It allows traders and investors to compare how different assets (e.g., Gold, Silver, S&P 500, Bitcoin) performed before, during, and after major economic crises.
✅ Identifying Market Trends – Helps recognize recurring patterns in asset price movements during times of financial distress.
✅ Risk Management & Strategy Development – Understanding how markets reacted in the past can assist in making better-informed investment decisions for future downturns.
✅ Gold, Silver & Bitcoin as Safe Havens – Comparing precious metals and cryptocurrencies against traditional stocks (e.g., SPY) to analyze their performance as hedges during economic turmoil.
How to Use It in Your Analysis
By overlaying this indicator on your Gold, Silver, SPY, and Bitcoin chart (for example), you can quickly spot historical market reactions and use that insight to predict possible behaviors in future downturns.
⸻
How to Apply This in TradingView?
1. Click on Use on chart under the image.
2. Overlay it with Gold ( OANDA:XAUUSD ), Silver ( OANDA:XAGUSD ), SPY ( AMEX:SPY ), and Bitcoin ( COINBASE:BTCUSD ) for comparative analysis.
⸻
Conclusion
This indicator serves as a powerful historical reference for traders analyzing asset performance during economic downturns. By studying past crises, you can develop a data-driven investment strategy and improve your market insights. 🚀📈
Let me know if you need any modifications or enhancements!

MACD Volume Strategy for XAUUSD (15m) [PineIndicators]The MACD Volume Strategy is a momentum-based trading system designed for XAUUSD on the 15-minute timeframe. It integrates two key market indicators: the Moving Average Convergence Divergence (MACD) and a volume-based oscillator to identify strong trend shifts and confirm trade opportunities. This strategy uses dynamic position sizing, incorporates leverage customization, and applies structured entry and exit conditions to improve risk management.
⚙️ Core Strategy Components
1️⃣ Volume-Based Momentum Calculation
The strategy includes a custom volume oscillator to filter trade signals based on market activity. The oscillator is derived from the difference between short-term and long-term volume trends using Exponential Moving Averages (EMAs)
Short EMA (default = 5) represents recent volume activity.
Long EMA (default = 8) captures broader volume trends.
Positive values indicate rising volume, supporting momentum-based trades.
Negative values suggest weak market activity, reducing signal reliability.
By requiring positive oscillator values, the strategy ensures momentum confirmation before entering trades.
2️⃣ MACD Trend Confirmation
The strategy uses the MACD indicator as a trend filter. The MACD is calculated as:
Fast EMA (16-period) detects short-term price trends.
Slow EMA (26-period) smooths out price fluctuations to define the overall trend.
Signal Line (9-period EMA) helps identify crossovers, signaling potential trend shifts.
Histogram (MACD – Signal) visualizes trend strength.
The system generates trade signals based on MACD crossovers around the zero line, confirming bullish or bearish trend shifts.
📌 Trade Logic & Conditions
🔹 Long Entry Conditions
A buy signal is triggered when all the following conditions are met:
✅ MACD crosses above 0, signaling bullish momentum.
✅ Volume oscillator is positive, confirming increased trading activity.
✅ Current volume is at least 50% of the previous candle’s volume, ensuring market participation.
🔻 Short Entry Conditions
A sell signal is generated when:
✅ MACD crosses below 0, indicating bearish momentum.
✅ Volume oscillator is positive, ensuring market activity is sufficient.
✅ Current volume is less than 50% of the previous candle’s volume, showing decreasing participation.
This multi-factor approach filters out weak or false signals, ensuring that trades align with both momentum and volume dynamics.
📏 Position Sizing & Leverage
Dynamic Position Calculation:
Qty = strategy.equity × leverage / close price
Leverage: Customizable (default = 1x), allowing traders to adjust risk exposure.
Adaptive Sizing: The strategy scales position sizes based on account equity and market price.
Slippage & Commission: Built-in slippage (2 points) and commission (0.01%) settings provide realistic backtesting results.
This ensures efficient capital allocation, preventing overexposure in volatile conditions.
🎯 Trade Management & Exits
Take Profit & Stop Loss Mechanism
Each position includes predefined profit and loss targets:
Take Profit: +10% of risk amount.
Stop Loss: Fixed at 10,100 points.
The risk-reward ratio remains balanced, aiming for controlled drawdowns while maximizing trade potential.
Visual Trade Tracking
To improve trade analysis, the strategy includes:
📌 Trade Markers:
"Buy" label when a long position opens.
"Close" label when a position exits.
📌 Trade History Boxes:
Green for profitable trades.
Red for losing trades.
📌 Horizontal Trade Lines:
Shows entry and exit prices.
Helps identify trend movements over multiple trades.
This structured visualization allows traders to analyze past performance directly on the chart.
⚡ How to Use This Strategy
1️⃣ Apply the script to a XAUUSD (Gold) 15m chart in TradingView.
2️⃣ Adjust leverage settings as needed.
3️⃣ Enable backtesting to assess past performance.
4️⃣ Monitor volume and MACD conditions to understand trade triggers.
5️⃣ Use the visual trade markers to review historical performance.
The MACD Volume Strategy is designed for short-term trading, aiming to capture momentum-driven opportunities while filtering out weak signals using volume confirmation.

MATA GOLD RATIOMata Gold Instrument: User Guide
The Instrument to Gold Oscillator is a technical analysis tool that normalizes the ratio of an instrument's price (e.g., BTC/USD) to the price of gold (XAU/USD) into a 0-100 scale. This provides a clear and intuitive way to evaluate the relative performance of an instrument compared to gold over a specified period.
---
How It Works
1. Calculation of the Ratio:
The ratio is calculated as:
\text{Ratio} = \frac{\text{Instrument Price}}{\text{Gold Price}}
2. Normalization:
The ratio is normalized using the highest and lowest values over a user-defined period (length), typically 14 periods:
\text{Normalized Ratio} = \frac{\text{Ratio} - \text{Min(Ratio)}}{\text{Max(Ratio)} - \text{Min(Ratio)}} \times 100
3. Overbought/Oversold Levels:
Above 80: The instrument is relatively expensive compared to gold (overbought).
Below 20: The instrument is relatively cheap compared to gold (oversold).
---
How to Use the Oscillator
1. Identify Overbought and Oversold Levels:
If the oscillator rises above 80, the instrument may be overvalued relative to gold. This could signal a potential reversal or correction.
If the oscillator falls below 20, the instrument may be undervalued relative to gold. This could signal a buying opportunity.
2. Track Trends:
Rising oscillator values indicate the instrument is gaining value relative to gold.
Falling oscillator values indicate the instrument is losing value relative to gold.
3. Crossing the Midline (50):
When the oscillator crosses above 50, the instrument's value is gaining strength relative to gold.
When it crosses below 50, the instrument is weakening relative to gold.
4. Combine with Other Indicators:
Use this oscillator alongside other technical indicators (e.g., RSI, MACD, STOCH) for more robust decision-making.
Confirm signals from the oscillator with price action or volume analysis.
---
Example Scenarios
1. Trading Cryptocurrencies Against Gold:
If BTC/USD's oscillator value is above 80, Bitcoin may be overvalued relative to gold. Consider reducing exposure or looking for short opportunities.
If BTC/USD's oscillator value is below 20, Bitcoin may be undervalued relative to gold. This could be a good time to accumulate.
2. Commodities vs. Gold:
Analyze the relative strength of commodities (e.g., oil, silver) against gold using the oscillator to identify periods of overperformance or underperformance.
---
Advantages of the Oscillator
Relative Performance Insight: Tracks the performance of an instrument relative to gold, providing a macro perspective.
Clear Visual Representation: The 0-100 scale makes it easy to identify overbought/oversold conditions and trend shifts.
Customizable Periods: The user-defined length allows flexibility in analyzing short- or long-term trends.
---
Limitations
Dependence on Gold: As the oscillator is based on gold prices, any external shocks to gold (e.g., geopolitical events) can influence its signals.
No Absolute Buy/Sell Signals: The oscillator should not be used in isolation but as part of a broader analysis strategy.
---
By using the Instrument to Gold Oscillator effectively, traders and investors can gain valuable insights into the relative valuation and performance of assets compared to gold, enabling more informed trading and investment decisions.

Fractal levels Gold [AstroHub]This indicator detects key fractal points on a price chart and visually marks them with shapes and levels. It helps traders identify potential reversal zones and dynamic support/resistance levels, enhancing market analysis.
Key Features:
Fractal Detection:
The indicator identifies top and bottom fractals using a 5-bar pattern.
A top fractal forms when the middle bar has a higher high compared to the two bars on either side.
A bottom fractal forms when the middle bar has a lower low compared to the two bars on either side.
Fractal Filtering:
The indicator can filter out "pristine" fractals (uninterrupted fractal patterns) based on custom conditions, making it more selective and reducing false signals.
Fractal Plotting:
are plotted as downward triangles.
are plotted as upward triangles.
Users can choose to display or hide fractal points and their corresponding labels.
Fractal Levels:
The indicator automatically plots fractals' levels on the chart, marking potential resistance and support zones.
Fractal levels change dynamically as new fractals are identified.
Customizable Display Options:
Show or hide fractals and levels with adjustable settings.
Choose whether to apply filtering for pristine fractals.
Display the pivot labels to easily track fractal positions.
How It Works:
The indicator uses a simple approach to recognize top and bottom fractals . When a valid fractal is detected, it highlights it on the chart and plots the corresponding price level.
By default, top fractals are shown above the bars (red color), and bottom fractals are shown below the bars (green color).
Fractal levels represent potential reversal points and can act as dynamic support and resistance zones.
Best Use:
The indicator is particularly useful in identifying reversal points and trend changes, helping traders to spot key price levels.
It can be used across various timeframes and markets, particularly for trend-following or reversal strategies.
Customizable Settings:
Show Pivots: Toggle the display of pivot points.
Show Pivot Labels: Display labels for pivot levels.
Show Fractals: Toggle fractal points on the chart.
Show Fractal Levels: Show or hide the levels corresponding to the detected fractals.
Filter for Pristine Fractals: Enable this option to filter out non-pristine fractals for higher accuracy.
Conclusion:
This indicator provides clear, actionable fractal signals, helping traders easily identify critical levels for entry and exit. With customizable settings and visual cues, it's suitable for both novice and expe

Marcel's Dynamic Profit / Loss Calculator for GoldOverview
This Dynamic Risk / Reward Tool for Gold is designed to help traders efficiently plan and manage their trades in the volatile gold market. This script provides a clear visualisation of trade levels (Entry, Stop Loss, Take Profit) while dynamically calculating potential profit and loss. It ensures gold traders can assess their positions with precision, saving time and improving risk management.
Key Features
1. Trade Level Visualisation:
Plots Entry (Blue), Stop Loss (Red), and Take Profit (Green) lines directly on the chart.
Helps you visualise and confirm trade setups quickly which is good for scalping and day trades.
2. Dynamic Risk and Reward Calculations:
Calculates potential profit and loss in real time based on user-defined inputs such as position size, leverage, and account equity.
Displays a summary panel showing risk/reward metrics directly on the chart.
3. Customisable Settings:
Allows you to adjust key parameters like account equity, position size, leverage, and specific price levels for Entry, Stop Loss, and Take Profit.
Defaults are dynamically generated for convenience but remain fully adjustable for flexibility.
How It Works
The script uses gold-specific conventions (e.g., 1 lot = 100 ounces, 1 pip = 0.01 price change) to calculate accurate risk and reward metrics.
It dynamically positions Stop Loss and Take Profit levels relative to the entry price, based on user-defined or default offsets.
A real-time summary panel is displayed in the bottom-right corner of the chart, showing:
Potential Profit: The monetary value if the Take Profit is hit.
Potential Lo
ss: The monetary value if the Stop Loss is hit.
How to Use It
1. Add the script to your chart on a gold trading pair (e.g., XAUUSD).
2. Input your:
Account equity.
Leverage.
Position size (in lots).
Desired En
try Price (default: current close price).
3. Adjust the Stop Loss and Take Profit levels to your strategy, or let the script use default offsets of:
500 pips below the Entry for Stop Loss.
1000 pips above the Entry for Take Profit.
4. Review the plotted levels and the summary panel to confirm your trade aligns with your risk/reward goals.
Why Use This Tool?
Clarity and Precision:
Provides clear trade visuals and financial metrics for confident decision-making.
Time-Saving:
Automates the calculations needed to evaluate trade risk and reward.
Improved Risk Management:
Ensures you never trade without knowing your exact potential loss and gain.
This script is particularly useful for both novice and experienced traders looking to enhance their risk management and trading discipline in the Gold market. Enjoy clearer trades at speed.

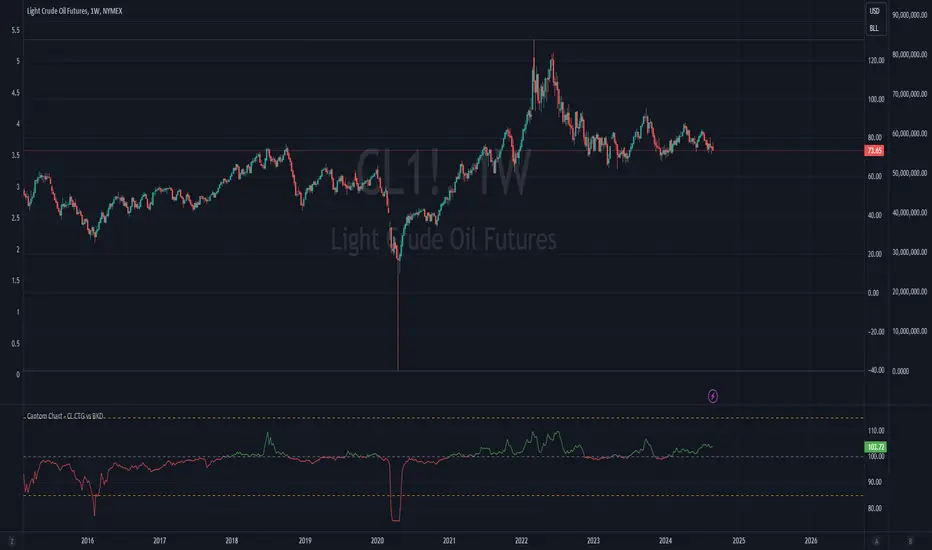
Cantom Chart - CL CTG vs BKDEnglish : This Pine Script indicator, named "Cantom Chart - CL CTG vs BKD," uniquely analyzes the immediate state of oil futures contracts to determine if they are in contango or backwardation. The script uses the price ratio between the nearest (CL1) and the next nearest (CL2) NYMEX crude oil futures contracts. It multiplies this ratio by 100 for clarity and scales fluctuations for enhanced visibility.
Key Features:
Dynamic Ratio Calculation: Computes the ratio (CL1/CL2 * 100) to determine the immediate market state.
Market State Interpretation: A ratio above 100 indicates backwardation, suggesting higher demand than supply, while a ratio below 100 indicates contango, suggesting higher supply than demand.
Volatility Adjustment: Amplifies market state changes by tripling the deviation from the baseline of 100, making it easier to observe subtle shifts.
Anomaly Detection: Caps the adjusted ratio at 125 for highs and 75 for lows, maintaining these limits until the ratio returns to normal levels.
Usage: This indicator is especially useful for traders analyzing supply-demand dynamics and inflationary pressures in the oil market. To apply it, simply add the script to your TradingView chart and adjust the 'Lower Threshold' and 'Upper Threshold' lines as needed based on your trading strategy.
-----
日本語 : この「Cantom Chart - CL CTG vs BKD」Pine Scriptインジケーターは、直近の原油先物契約がコンタンゴまたはバックワーデーションにあるかを特定するための独自の分析を提供します。最近の(CL1)と次の(CL2)NYMEX原油先物契約間の価格比を使用し、この比率に100を掛けて明確性を高め、変動の視認性を向上させます。
主要機能:
動的比率計算: 市場の即時状態を判断するために比率(CL1/CL2 * 100)を計算します。
市場状態の解釈: 比率が100を超える場合はバックワーデーション(需要が供給を上回る)、100未満の場合はコンタンゴ(供給が需要を上回る)を示します。
変動調整: 基準値100からの偏差を3倍にして、微妙な変化を容易に観察できるようにします。
異常値検出: 調整された比率を高値で125、低値で75に制限し、通常のレベルに戻るまでこれらの限界を維持します。
使用方法: このインジケーターは、原油市場における需給ダイナミクスとインフレ圧力を分析するトレーダーにとって特に有用です。使用するには、このスクリプトをTradingViewチャートに追加し、トレーディング戦略に基づいて「Lower Threshold」と「Upper Threshold」のラインを必要に応じて調整します。