TTC EMA Scalping Machine with RSI Filter and MACDTTC EMA Scalping Machine with RSI Filter and MACD
TTC EMA Scalping Machine with RSI Filter and MACD is a multi-layered technical analysis tool designed for traders looking to scalp the markets with a combination of trend-following and momentum-based indicators. This strategy leverages Exponential Moving Averages (EMAs) , Relative Strength Index (RSI) , MACD , and Volume Analysis to help traders identify high-probability entry points for short and long trades. The indicator can be used in multiple market conditions and is suited for both beginners and experienced traders looking for clear entry signals.
---
Key Features :
1. EMA-Based Trend Filtering :
- The indicator uses four Exponential Moving Averages (EMAs) with different periods:
- EMA 10 (Short-Term) : The fastest-moving average for detecting quick price movements.
- EMA 20 (Medium-Term) : A central trendline for market momentum.
- EMA 30 (Long-Term) : To observe broader market trends.
- EMA 50 (Longest-Term) : To identify the overall market direction.
- These EMAs are plotted on the chart and used to create EMA bands , visually displaying potential support and resistance levels. Price action inside these bands helps identify scalping opportunities.
2. RSI Filter :
- RSI (Relative Strength Index) is used to gauge overbought and oversold conditions in the market:
- Overbought condition (RSI > 70) : The market may be overextended, signaling the possibility of a short.
- Oversold condition (RSI < 30) : The market may be undervalued, signaling the possibility of a long.
- The RSI filter ensures that trades are not taken when the market is overextended, offering a more conservative approach to trade entries.
3. MACD Momentum Analysis :
- The MACD (Moving Average Convergence Divergence) indicator is included to confirm the trend and momentum direction:
- Long Condition : The MACD line crosses above the signal line, confirming a bullish momentum.
- Short Condition : The MACD line crosses below the signal line, confirming a bearish momentum.
- This serves as an additional filter to verify if the market momentum aligns with the long or short entry criteria.
4. Long Entry (Buy Signal) :
- A long entry signal is triggered when the following conditions are met:
- The price is above EMA 20 (indicating an overall bullish market).
- The price is within the green EMA band (EMA 10 and EMA 20), suggesting short-term support.
- The RSI is below 70 (indicating the market is not overbought).
- The MACD line is above the signal line , showing bullish momentum.
- These conditions combined suggest an ideal environment for entering a long position.
5. Short Entry (Sell Signal) :
- A short entry signal is triggered when the following conditions are met:
- The price is below EMA 20 (indicating an overall bearish market).
- The price is within the green EMA band (EMA 20 and EMA 30), suggesting short-term resistance.
- The RSI is above 30 (indicating the market is not oversold).
- The MACD line is below the signal line , showing bearish momentum.
- These conditions combined suggest an ideal environment for entering a short position.
6. Signal Alerts :
- Long Alerts : Users can set alerts to notify them when a long condition is met. These alerts are triggered when all the criteria for a long entry are satisfied.
- Short Alerts : Similarly, users can set alerts for short signals, notifying them when all the conditions for a short entry are satisfied.
7. EMA Bands :
- The EMA bands are visually represented with colored fills between the EMAs, providing a visual aid to recognize potential trading zones. These zones can serve as a reference for traders to make quick decisions regarding entries and exits.
8. Volume Filter :
- The indicator also includes a volume filter , which compares the current volume to its 20-period simple moving average. Higher volumes provide confirmation of price movement, which can indicate stronger potential for the trade.
---
How It Works :
- Long Trades : The indicator suggests a long position when the price is above the EMA 20, within the green EMA band, the RSI is not overbought, and MACD confirms bullish momentum (MACD line above the signal line).
- Short Trades : The indicator suggests a short position when the price is below the EMA 20, within the green EMA band, the RSI is not oversold, and MACD confirms bearish momentum (MACD line below the signal line).
- Volume Confirmation : The indicator uses a volume-based filter to ensure the trade is backed by sufficient market participation.
---
Usage :
- Best for Scalping : This strategy is designed for short-term trades ( scalping ) and can be applied to any time frame, though it works best on intraday charts, such as 5-minute or 15-minute charts.
- Ideal for Trend-Following : With the use of EMAs and MACD, the strategy is best suited for markets that exhibit clear trends. It helps to avoid whipsaw trades and focuses on capturing medium-term trends.
- Risk Management : By using RSI, MACD, and volume analysis together, this strategy reduces the likelihood of entering a trade in an overextended market, which helps with risk management.
---
Alerts and Signals :
- Long Signals : When all conditions are met for a long trade, a green label appears below the price bar, indicating a potential buy opportunity. An alert is also generated, notifying the user.
- Short Signals : When all conditions are met for a short trade, a red label appears above the price bar, indicating a potential sell opportunity. An alert is also generated, notifying the user.
---
This combination of EMA , RSI , MACD , and volume-based filters creates a balanced approach to scalping, ensuring that traders receive clear, actionable entry signals with trend confirmation, while avoiding overbought and oversold conditions that may lead to false signals. The indicator is designed to help traders confidently identify high-probability trades while maintaining simplicity and clarity in its setup.
Macdivergence

mr.crypto731Description:
📊 Enhanced MACD with Strong Buy/Sell Signals 🚀
This script is designed to enhance the standard MACD indicator by adding clear, strong buy and sell signals. It includes:
MACD Line: A fast-moving average that reacts quickly to price changes.
Signal Line: A slower-moving average that smooths out price fluctuations.
MACD Histogram: The difference between the MACD Line and Signal Line, helping to identify trend strength and direction.
Key Features:
Strong Buy/Sell Signals: Uses crossovers of the MACD Line and Signal Line to generate strong buy/sell signals.
Color-Coded Background: Provides visual cues with background colors to highlight strong signals.
User-Friendly Interface: Customizable settings for MACD Fast Length, Slow Length, and Signal Smoothing.

5x Volume indicator - Day Trading5x Volume Screener - Day Trading
Version: 6.0
Description:
This indicator is designed to identify significant volume spikes in crypto and stock markets,
specifically targeting instances where volume exceeds 5x the average of a 10-period Simple Moving Average (SMA) as the baseline.
Perfect for day traders and momentum traders looking for high-volume breakout opportunities.
Key Features:
Tracks real-time volume compared to 5-period moving average
Visual alerts through green histogram bars for 5x volume spikes
Dynamic volume ratio display showing exact multiple of average volume
Clear threshold line for quick reference
Optional labels showing precise volume ratios
Benefits:
Instantly spot unusual volume activity
Identify potential breakout opportunities
Validate price movements with volume confirmation
Perfect for day trading and scalping
Works across multiple timeframes
Best Used For:
Day trading setups
Breakout trading
Volume confirmation
Momentum trading
Market reversal identification
Created by: CigarSavant
Last Updated: December 2024

E9 MACD
The E9 MACD (Moving Average Convergence Divergence) indicator is a powerful tool used in technical analysis to help traders identify potential buy and sell signals based on price action. It is designed to provide clear visual cues and alerts for trading decisions. Here’s how it applies to price action and its key functionalities:
Key Features and Functionality
MACD Line and Signal Line:
MACD Line: Represents the difference between a fast and a slow moving average of the price. It helps in identifying the momentum of the price movement.
Signal Line: A smoothed average of the MACD Line, used to generate trading signals when the MACD Line crosses above or below it.
Histogram: The histogram shows the difference between the MACD Line and the Signal Line. It visually represents the strength of the trend, with positive values indicating bullish momentum and negative values indicating bearish momentum.
Trend Coloring:
Uptrend: When the MACD Line is above the Signal Line, the bars can be colored green to indicate a potential buying opportunity.
Downtrend: When the MACD Line is below the Signal Line, the bars can be colored red to signal a potential selling opportunity.
Timeframe Flexibility:
The E9 MACD can be adjusted to different timeframes, allowing traders to analyze short-term or long-term trends based on their trading strategy. This flexibility helps in tailoring the indicator’s analysis to different market conditions.
Visual Alerts and Highlights:
The indicator includes options to highlight price bars and background colors when significant crossovers occur, making it easier to spot key trading signals.
Circles can be plotted on the MACD Line to indicate cross events, enhancing visual clarity.
Customizable Appearance:
Traders can customize the appearance of the MACD Line, Signal Line, and Histogram, including color and line width, to suit their personal preferences and improve readability.
Alerts for Trading Signals:
The E9 MACD can generate alerts for crossovers of the MACD Line and Signal Line, helping traders stay informed of potential trading opportunities even when they are not actively monitoring the charts.
Application in Trading
The E9 MACD is particularly useful for:
Identifying potential entry and exit points based on the crossing of the MACD Line and Signal Line.
Gauging the strength of the current trend through the histogram.
Adjusting to different timeframes to align the indicator with various trading strategies, from day trading to long-term investing.
By providing clear visual indicators and alerts, the E9 MACD helps traders make more informed decisions and better understand the momentum and direction of price movements.

[KVA] KMACDKMACD Indicator: Advanced Market Analysis Through Central Tendency Metrics
The KMACD (KAMVIA Moving Average Convergence Divergence) indicator is an advanced, multi-dimensional tool designed to provide traders and analysts with a deeper understanding of market dynamics. By integrating the classical MACD framework with statistical measures of central tendency, KMACD offers a sophisticated approach to identifying trends, reversals, and potential trading opportunities.
Key Features of the KMACD Indicator:
1. Enhanced MACD Calculation :
- The KMACD employs dual moving averages (fast and slow) of user-defined types (SMA, EMA, WMA) to calculate the MACD line, which represents the difference between these moving averages. This traditional approach is further enhanced by customizable signal smoothing, allowing users to fine-tune the sensitivity of the indicator.
2. Central Tendency Metrics :
- The indicator integrates additional statistical measures, such as Mean, Median, Mode, Standard Deviation, and Variance, calculated over a rolling window. These metrics provide insights into the central tendencies of the MACD values, helping traders understand the overall trend direction and the dispersion of price movements around the trend.
3. RSI-Like Oscillator :
- A unique RSI-like value derived from the MACD line is included to highlight overbought and oversold conditions. This offers a dual-layered perspective, combining the power of MACD and RSI methodologies, to signal potential market extremes with greater precision.
4. Customizable Visual Elements :
- KMACD allows users to toggle the visibility of the MACD line, Signal line, and Histogram, providing flexibility in how the data is presented. The histogram dynamically changes color—green when above zero, indicating bullish momentum, and red when below zero, indicating bearish momentum.
5. Horizontal Line Customization :
- The indicator includes customizable horizontal lines for the zero level, overbought, and oversold thresholds. These lines serve as visual cues to identify key price levels and market conditions.
6. Adaptive to Various Market Conditions :
- KMACD's comprehensive features make it adaptable to various market conditions, from trending markets to sideways consolidations. Whether you're looking to capture momentum shifts or identify potential reversal points, KMACD provides the analytical power needed to make informed trading decisions.
How to Use KMACD:
- Trend Identification : Use the MACD line in conjunction with central tendency measures (Mean, Median, Mode) to gauge the overall market trend and its strength. A rising MACD line, supported by higher mean and median values, typically indicates an uptrend.
- Momentum Analysis : The histogram and RSI-like value help in identifying the momentum behind price movements. Positive histogram bars suggest increasing bullish momentum, while negative bars suggest increasing bearish momentum.
- Overbought/Oversold Conditions : Monitor the RSI-like oscillator and the overbought/oversold levels to detect when the market may be poised for a reversal.
- Divergence Detection : Look for divergences between the MACD line and price action, supported by the central tendency measures, to spot potential reversal points.
Conclusion
The KMACD indicator is more than just a traditional MACD; it’s a comprehensive tool designed to cater to both novice and experienced traders. By incorporating central tendency metrics and customizable features, KMACD stands out as a versatile and powerful indicator that enhances market analysis and trading strategies. Whether you're navigating volatile markets or steady trends, KMACD offers the precision and depth needed to stay ahead.

MACD Highlight Zones for PrimetimeUse the MACD Highlight Zones to easily spot changes in market momentum and make more informed trading decisions.
The MACD Highlight Zones script visually enhances your chart by highlighting different zones based on the MACD's relationship to the zero line and its signal line. This script helps traders quickly identify the market's momentum and potential reversal points.
Features:
🟢 Green Background: Indicates the MACD line is above 0, signaling bullish momentum.
🟡 Yellow Background: Indicates the MACD line crosses the signal line, suggesting a potential momentum shift.
🔴 Red Background: Indicates the MACD line is below 0, signaling bearish momentum.

Divergence Detector [TradingFinder] RSI + MACD + AO Oscillator 🔵 Introduction
🟣 Understanding Divergence
As mentioned, divergence occurs in technical analysis when a stock's price behaves contrary to indicators on the price chart. Divergence can signify either a reversal of the stock's trend or a continuation of the previous trend correction.
Divergences can act as reversal patterns or continuation patterns. Moreover, divergences can be utilized to identify potential support and resistance levels.
For instance, when an indicator is trending upwards and positive, but the price is declining and trending downwards, divergence occurs. Divergence in a stock indicates trader indecision in buying and selling and warns traders to reconsider their decisions regarding buying or holding the stock.
Divergence aids analysts in identifying critical price points. In indicator divergences, it serves as a potent signal in the realm of technical analysis.
🟣 Types of Divergence
1.Regular Divergence
o Positive Regular Divergence (RD+)
o Negative Regular Divergence (RD-)
2.Hidden Divergence
o Positive Hidden Divergence (HD+)
o Negative Hidden Divergence (HD-)
3.Time Divergence
Key Note : This indicator is specifically designed to identify "Regular Divergence" only. Therefore, the following explanation pertains to this type of divergence.
🔵 Regular Divergence/Convergence
Regular Divergence(Convergence) occurs due to conflicting behavior between the indicator and the price chart, typically at the end of a trend. Recognizing Regular Divergence suggests an anticipation of a trend reversal or a pattern resembling a reversal.
🟣 Positive Regular Divergence (RD+)
In contrast to negative divergence, positive Regular Divergence occurs at the end of a downtrend and between two price lows. It manifests when the price forms a new low on the price chart, but the indicator fails to recognize it.
Positive Regular Divergence indicates strong buying pressure and weak selling pressure. Following the identification of positive divergence on the chart, one can anticipate a price increase for the examined stock.
🟣 Negative Regular Divergence (RD-)
This type of Regular Divergence emerges between two price highs during an uptrend. A new high is formed on the price chart, but the indicator fails to acknowledge it. This scenario indicates negative Regular Divergence.
The likelihood of a subsequent market downturn is high. Negative divergence signifies strong selling pressure and weak buying pressure, suggesting an unfavorable future for the stock.
🔵 How to use
By utilizing the "Fractal Period" input, you can specify your desired periods for identifying divergences.
Additionally, through the "Divergence Detect Method" feature, you can choose which oscillators (MACD, RSI, or AO) to base divergence identification on.
Divergence in MACD Oscillator :
Divergence in the MACD indicator occurs when the price chart and the MACD line form a noticeable opposing pattern, meaning the price moves contrary to the MACD line. In this scenario, one expects a reversal in price direction.
Divergence in RSI Oscillator :
If divergence occurs during a downtrend on the price chart (two consecutive lows, with the second low being lower) and on the corresponding RSI point (two consecutive lows, with the second low being higher), it signifies positive Regular Divergence and implies a buying signal.
Conversely, if divergence occurs during an uptrend on the price chart (two consecutive highs, with the second high being higher) and on the corresponding RSI point (two consecutive highs, with the second high being lower), it indicates negative Regular Divergence, signaling a selling opportunity.
Divergence in AO Oscillator :
The AO indicator calculates histograms similar to the AO base. It calculates the difference between the simple moving averages of 5 and 34 periods based on the median of each bar. Then, it plots the bars based on the difference.
It then compares the histograms to detect peaks and troughs in the AO histograms and compares the identified peaks and troughs to the price. Whenever divergence is detected, it plots lines and arrows.
🔵 Table
The table contains information on the functional features of this oscillator that you can utilize. Four categories of information are presented in the table: "Exist," "Consecutive," "Divergence Quality," and "Change Phase Indicator."
Exist :
If divergence exists, you'll see "+" in this row.
Consecutive :
Divergences may occur consecutively. If same-type divergences form within short intervals, you can observe the count in this row.
Divergence Quality : Based on the number of consecutive divergences, their quality can be evaluated. If one divergence exists, its quality is considered "Normal." If two divergences exist, the quality is "Good," and if three or more divergences exist, the quality is considered "Strong."
Change Phase Indicator : If a phase change occurs between two oscillation peaks formed based on divergence, this change is identified and displayed in this row.

Divergence Signal [TradingFinder] RSI & MACD Reversal On Swing🔵 Introduction
Sometimes in analyzing price charts using indicators, you may observe a discrepancy. For instance, while the price of stocks, currencies, or commodities is increasing, the indicator shows a decrease. Such a phenomenon in technical analysis is termed "divergence." Divergences are categorized into three types based on their formation and the prediction they make about the continuation of the price trend: "Regular Divergence," "Hidden Divergence," and "Time Divergence."
🟣 Important :
• This indicator exclusively identifies regular divergences since its primary function is to detect reversal points.
• This indicator identifies divergences using three indicators: "Moving Average Convergence Divergence" (MACD), "Relative Strength Index" (RSI), and "Awesome Oscillator" (AO). The user can choose each of these indicators in the settings using the "Divergence Detection Method" dropdown menu for identifying divergences. These settings are by default set to the MACD mode.
🔵Types of Divergence
Divergences, as mentioned, offer different predictions about the continuation of price trends. Hence, they have various types. We will focus on explaining regular divergences based on this indicator.
🟣 Regular Divergence(RD) :
Regular divergence is a situation arising from contradictory behavior between the indicator and the price chart at the end of a trend. By identifying regular divergences, we anticipate a change in trend direction resembling a reversal pattern.
Regular divergence has two types based on the trend and prediction:
Negative Regular Divergence (RD-) :
This type occurs between two price peaks at the end of an uptrend. Despite forming a new high, the indicator fails to recognize it, indicating a negative regular divergence. The likelihood of a subsequent downtrend is high. Negative divergence suggests strong selling pressure and weak buying power, portraying an unfavorable future for the stock.
Positive Regular Divergence (RD+) :
In contrast, positive regular divergence happens at the end of a downtrend and between two price troughs. As depicted in the chart, although the price forms a new low, the indicator doesn't acknowledge it. Positive regular divergence indicates robust buying pressure and weak selling power. Upon identifying positive divergence in the chart, we expect a price increase for the stock under review
🔵 How to Use
Information from the indicator is displayed in two ways: Table and Label.
🟣 Table : The table displays information about the latest divergence. This includes the type of divergence, existence or absence of divergence, consecutive divergences, divergence quality, and change in indicator phase.
Type Divergence : Indicates the type of divergence, which can be either "Bullish Divergence" or "Bearish Divergence."
Exist : Indicates the presence of divergence with a "+" sign and absence with a "-" sign. A green color is used for bullish divergence and red for bearish divergence.
Consecutive : Shows the number of consecutive divergences. For example, if there are 3 consecutive divergences, the number 3 is displayed.
Divergence Quality : Displays the quality of the divergence based on the number of consecutive divergences. If there is 1 divergence, the quality is "Normal"; for 2 divergences, it's "Good"; and for 3 or more divergences, it's "Strong."
Change Phase Indicator : Indicates whether a phase change in the indicator has occurred with "+" for yes and "-" for no.
🟣 Label : Unlike the table, which only shows information about the latest divergence, labels display information about each divergence at the point where it occurs. The information includes the type of divergence, detection method, divergence quality, consecutive divergences, and change in phase indicator. The selected method of detection is also displayed. For example, if the chosen method is the "AO" indicator, the label will show "Method: AO."
🔵 Settings
Fractal Period : Determines the period of swings. The minimum and default value is 2.
Divergence Detect Method : Selects the indicator (MACD, RSI, or AO) used for detecting divergences. The default indicator is MACD.
Show Fractal : Chooses whether to display fractals or not. The default is "No."
Show Table : Determines whether to display the table or not. The default is "Yes."
Show Label : Chooses whether to display labels or not. The default is "Yes."
Label Size : Adjusts the size of the labels from "Tiny" to "Large."

Bimmeresty's MACDImproved MACD with labels on histogram and color change feature on signal line.
Labels on histogram help gauge how strong the change is rather than visually comparing heights.
example: "histogram just put in its first rising candle, but its only rising by 0.01 therefore i should be suspicious of it and possibly wait for a second rising candle for further confirmation of reversal"
Color change on signal slope is better for gauging the directional bias and spotting reversals.
example: "slope is red, so negative, so i should prioritize shorts"
example: "slope just turned green, so positive, so we might be reversing bias here"
buy/sell signals with Support/Resistance (InvestYourAsset) 📣The present indicator is a MACD based buy/sell signals indicator with support and resistance, that can be used to identify potential buy and sell signals in a security's price.
📣It is based on the MACD (Moving Average Convergence Divergence) indicator, which is a momentum indicator that shows the relationship between two moving averages of a security's price.
📣 The indicator also plots support and resistance levels, which can be used to confirm buy and sell signals. The support and resistance can also be used as a stoploss for existing position.
👉 To use the indicator, simply add it to your trading chart. The indicator will plot three sections:
📈 Price and Signals: This section plots the security's price and the MACD buy and sell signals.
📈 MACD Oscillator: This section plots the MACD oscillator, which is a histogram that shows the difference between the two moving averages.
📈 Moving Averages: This section plots the two moving averages that the MACD oscillator is based on.
📈 Support and Resistance: This section plots support and resistance levels, which are calculated based on the security's recent price action.
👉 To identify buy and sell signals, you can look for the following:
📈 Buy signal: When shorter Moving Average crosses over longer Moving Average.
📈 Sell signal: When shorter moving average crosses under longer moving average.
📈 You can also look for divergences between the MACD oscillator and the security's price. A divergence occurs when the MACD oscillator is moving in one direction, but the security's price is moving in the opposite direction. Divergences can be a sign of a potential trend reversal.
👉 To confirm buy and sell signals, you can look for support and resistance levels take a look at below snapshot. If a buy signal occurs at a support level, it is a stronger signal than if it occurs at a random price level. Similarly, if a sell signal occurs at a resistance level, it is a stronger signal than if it occurs at a random price level.
⚡ Here is a example of how to use the indicator to identify buy signal:
☑ Add the indicator to your trading chart.
☑Look for a buy signal when short MA crosses over Long MA.
☑Look for the buy signal to occur at a support level.
☑Enter a long position at the next candle.
☑Place a stop loss order below the support level.
☑Take profit when the MACD line crosses below the signal line, or when the security reaches a resistance level.
⚡ Here is an example of how to use the indicator to identify a sell signal:
☑Add the indicator to your trading chart.
☑Look for a sell signal, when shorter moving average crosses under longer moving average.
☑Look for the sell signal to occur at a resistance level.
☑Enter a short position at the next candle.
☑Place a stop loss order above the resistance level.
☑Take profit when the MACD line crosses above the signal line, or when the security reaches a support level.
✅Things to consider while using the indicator:
📈Look for buy signals in an uptrend and sell signals in a downtrend. This will increase the likelihood of your trades being successful.
📈Place your stop losses below the previous swing low or support for buy signals and above the previous swing high or resistance for sell signals. This will help to limit your losses if the trade goes against you.
📈Consider taking profits at key resistance and support levels. This will help you to lock in your profits and avoid giving them back to the market.
Follow us for timely updates regarding indicators that we may publish in future and give it a like if you appreciate the indicator.

MA + MACD alert TrendsThis is a strategy/combination of warning indicators using 6MA+MACD.
The strategy details are as follows: This is a simple warning strategy created so that we don't have to monitor the candlestick chart too often.
Note: This isn't an entry strategy; it's a signaling strategy for upcoming trends. For maximum efficiency, we should incorporate more formulas into the command. In the case below, I use Fibonacci to enter the command.
This strategy setting works for a 15-minute time frame, but it can still work for different time frames.
It has been working well with Gold and USOIL for the last two years, as well as with currency pairs like EURUSD and many others.
Components:
EMA100 + EMA200 + MA400 + MA800
MACD (timeframe greater than 1 timeframe)
Fibonacci retreat.
Uptrend alert:
Candles on both EMAs (100-200) + 2 SMAs (400-800)
In the previous 80 candles:
EMA100 cross up to EMA200
At the same time, the MACD cross up 0.
The uptrend warning will trigger when EMA6 cuts down to MA10. That's when the price creates the top and we'll wait for the market to go back to the Fibonacci threshold of 0.618 and start buying (or wait for markets to break up the trendline to buy).
Downtrend alert:
Candles are below both EMAs ( 100-200 ) + 2 SMAs ( 400-800 )
In the previous 80 candles:
EMA100 cross down to EMA200
At the same time, the MACD cross down zero.
The downtrend warning will trigger when EMA6 cuts to MA10. That's when the price creates a bottom and we'll wait for the market to go back to the Fibonacci threshold of 0.618 and start selling (or wait for the market to break down the trendline to sell).
Recommended RR: 1:1
If you have any questions please let me know!

Weighted Oscillator Convergence DivergenceThe Weighted Oscillator Convergence Divergence (WOCD) aims to help traders identify potential trend reversals or momentum shifts in financial markets by calculating and visualizing the difference between a smoothed oscillator (WMA) value and its exponential moving average (EMA) and simple moving average (SMA) counterparts. This indicator is particularly useful for traders who want an alternative perspective on price momentum and divergence.
Key Features:
Inputs:
Length: The user can specify the number of bars to consider for calculations (default is 9).
Smoothing 1: Defines the smoothing factor for the first smoothed value (default is 5).
Smoothing 2: Specifies the smoothing factor for the second smoothed value (default is 7).
Ma Type: There are three types of moving averages you can choose (Wilder, non-lag, Weighted is by default).
Color Settings: Users can customize the indicator's colors for various elements, such as length, smoothing values, and different sections of the histogram.
Calculation:
WOCD calculates the raw oscillator value by subtracting the close price from a 3-period High, Low, Close (HLC3) moving average.
It then applies smoothing to this raw oscillator value using two different methods: exponential moving average (EMA) and simple moving average (SMA) with user-defined smoothing periods.
Histogram Plot:
The indicator plots a histogram based on the difference between the smoothed oscillator and the first smoothed value.
When the histogram is above zero and rising, it is colored according to the "Above Grow" color setting. When it's above zero and falling, it uses the "Fall" color for visualization.
Similarly, when the histogram is below zero and rising, it is colored according to the "Below Grow" color setting, and when it's below zero and falling, it uses the "Fall" color.
Oscillator and Smoothed Values:
The indicator also plots the smoothed oscillator, smoothed value 1 (EMA-based), and smoothed value 2 (SMA-based) on the chart.
Zero Line:
A horizontal line at zero is drawn on the chart for reference.
How to Use the WOCD Indicator:
Trend Identification: Observe the histogram's direction and color. A rising histogram above zero may indicate bullish momentum, while a falling histogram below zero could signal bearish momentum.
Divergence: Look for divergences between price action and the histogram. When the histogram and price move in opposite directions, it can be a potential reversal signal.
Crossovers: Pay attention to crossovers between the smoothed oscillator and its smoothed counterparts (EMA and SMA). These crossovers can indicate changes in trend strength or direction.
Zero Line: The zero line can act as a reference point. Positive histogram values suggest bullish sentiment, while negative values indicate bearish sentiment.
Comparison to MACD Indicator:
The WOCD indicator shares some similarities with the Moving Average Convergence Divergence (MACD) indicator but also has distinct differences:
Similarities:
Both WOCD and MACD are momentum oscillators designed to identify potential trend reversals and divergences.
They use moving averages (EMA in the case of MACD) to smooth the raw oscillator values.
Both indicators provide histogram representations of the difference between the oscillator and its smoothed counterpart.
Differences:
WOCD uses a 3-period High, Low, Close (HLC3) moving average to calculate the raw oscillator value, whereas MACD uses the difference between two exponential moving averages (usually 12-period and 26-period EMAs).
The smoothing in WOCD employs both EMA and SMA, while MACD exclusively uses EMA.
WOCD allows users to customize colors for various elements, enhancing visual clarity.

Volatility Adjusted MACDMACD, short for moving average convergence/divergence, is a trading indicator used in technical analysis of securities prices, created by Gerald Appel in the late 1970s. It is designed to reveal changes in the strength, direction, momentum, and duration of a trend in a stock's price.
The MACD indicator (or "oscillator") is a collection of three time series calculated from historical price data, most often the closing price. These three series are: the MACD series proper, the "signal" or "average" series, and the "divergence" series which is the difference between the two. The MACD series is the difference between a "fast" (short period) exponential moving average (EMA), and a "slow" (longer period) EMA of the price series. The average series is an EMA of the MACD series itself.
This version of MACD follows the work of Alex Spiroglou, DipTA(ATAA), CFTe in his 2022 paper that was awarded Charles H. Dow Award by CMT Association . The paper is available on papers.ssrn.com or on website.of CMT Association.
Please refer to the paper for details on construction and trading rules . I personally find the volatility adjusted version as described in this paper more responsive in terms of signals and divergences.
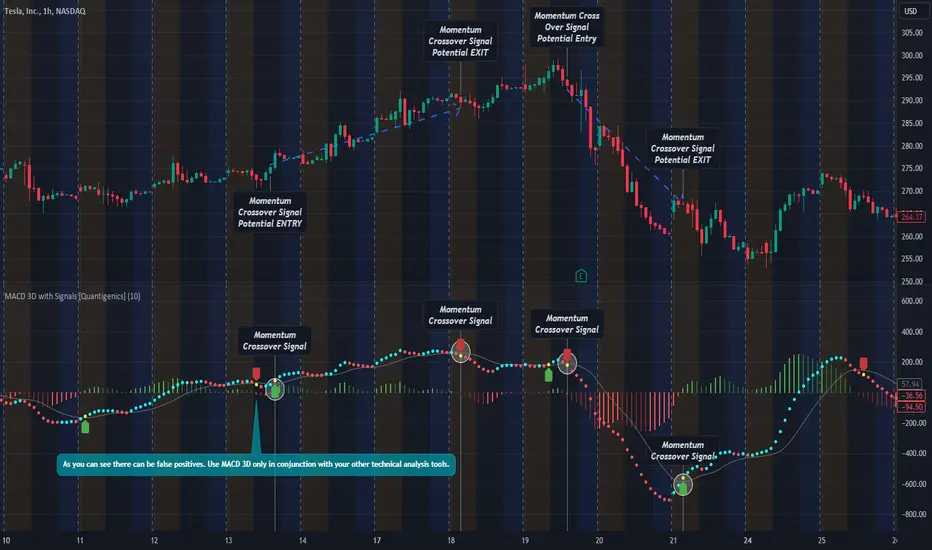
MACD 3D with Signals [Quantigenics]Quantigenics MACD 3D with Buy Sell Signals is a MACD-based trading indicator that aims to identify market trends and potential turning points, for Buy/Sell opportunities, by leveraging price data and volatility.
Unlike the traditional MACD indicator, the average price is calculated from the high, low, and close prices, from which a specialized MACD value is derived. This MACD value, combined with an average and standard deviation, takes into account volatility, and is used to generate an upper and lower boundary.
The indicator color-codes market trends: aqua indicates upward trends (signifying increased buying pressure), red suggests downward trends (increased selling pressure). When the MACD value crosses above the upper boundary or falls below the lower boundary, the color changes to yellow indicating a possible reversal point and "Momentum Crossover Signals" can be plotted at this point. "Standard Signal" arrows can also plotted when the MACD 3D changes from auqa to red and vice-versa.
A trendline is drawn at the median value, providing a baseline for comparison. A differential value, which measures the distance between the MACD value and the median line, provides additional insight into the price's deviation from this baseline (divergences from the underlying price can be spotted using this data as well). The differential is color-coded: green when MACD is above the median, and red when it's below, with darker shades representing a decreasing gap.
Alerts can be set to trigger with the "Standard Signal" arrows appearing after MACD 3D changes from auqa to red and vice-versa and when the "Momentum Crossover Signal" arrows appear when the MACD value crosses above the upper boundary or falls below the lower boundary indicating a potential reversal. Providing immediate notifications which can be especially helpful in larger time frames where it may take time for a trade setup to develop.
CME_MINI:NQ1!
OANDA:XAUUSD
Enjoy the MACD 3D indicator. Happy Trading!
Price Exhaustion IndicatorThe Price Exhaustion Indicator (PE) is a powerful tool designed to identify trends weakening and strengthening in the financial markets. It combines the concepts of Average True Range (ATR), Moving Average Convergence Divergence (MACD), and Stochastic Oscillator to provide a comprehensive assessment of trend exhaustion levels. By analyzing these multiple indicators together, traders and investors can gain valuable insights into potential price reversals and long-term market highs and lows.
The aim of combining the ATR, MACD, and Stochastic Oscillator, is to provide a comprehensive analysis of trend exhaustion. The ATR component helps assess the volatility and range of price movements, while the MACD offers insights into the convergence and divergence of moving averages. The Stochastic Oscillator measures the current price in relation to its range, providing further confirmation of trend exhaustion. The exhaustion value is derived by combining the MACD, ATR, and Stochastic Oscillator. The MACD value is divided by the ATR value, and then multiplied by the Stochastic Oscillator value. This calculation results in a single exhaustion value that reflects the combined influence of these three indicators.
Application
The Price Exhaustion Indicator utilizes a unique visual representation by incorporating a gradient color scheme. The exhaustion line dynamically changes color, ranging from white when close to the midline (40) to shades of purple as it approaches points of exhaustion (overbought at 100 and oversold at -20). As the exhaustion line approaches the color purple, this represents extreme market conditions and zones of weakened trends where reversals may occur. This color gradient serves as a visual cue, allowing users to quickly gauge the strength or weakness of the prevailing trend.
To further enhance its usability, the Price Exhaustion Indicator also includes circle plots that signify potential points of trend reversion. These plots appear when the exhaustion lines cross or enter the overbought and oversold zones. Red circle plots indicate potential short entry points, suggesting a weakening trend and the possibility of a downward price reversal. Conversely, green circle plots represent potential long entry points, indicating a strengthening trend and the potential for an upward price reversal.
Traders and investors can leverage the Price Exhaustion Indicator in various ways. It can be utilized as a trend-following tool, or a mean reversion tool. When the exhaustion line approaches the overbought or oversold zones, it suggests a weakening trend and the possibility of a price reversal, helping identify potential market tops and bottoms. This can guide traders in timing their entries or exits in anticipation of a trend shift.
Utility
The Price Exhaustion Indicator is particularly useful for long-term market analysis, as it focuses on identifying long-term market highs and lows. By capturing the gradual weakening or strengthening of a trend, it assists investors in making informed decisions about portfolio allocation, trend continuation, or potential reversals.
In summary, the Price Exhaustion Indicator is a comprehensive and visually intuitive tool that combines ATR, MACD, and Stochastic Oscillator to identify trend exhaustion levels. By utilizing a gradient color scheme and circle plots, it offers traders and investors valuable insights into potential trend reversals and long-term market highs and lows. Its unique features make it a valuable addition to any trader's toolkit, providing a deeper understanding of market dynamics and assisting in decision-making processes. Please note that future performance of any trading strategy is fundamentally unknowable, and past results do not guarantee future performance.

MOM HEATThe "MOM HEAT" indicator combines MACD, Stochastic, MFI, and RSI to create a heat map of market momentum.
It calculates wave values based on these indicators for four different timeframes.
The wave values are then normalized and combined to determine overall momentum.
The indicator plots squares on the chart to represent the wave values for each timeframe.
It also draws a line to indicate potential momentum shifts.
Additionally, a table displays the timeframes and their corresponding colors (lib kaigouthro/hsvColor/15).
Overall, the indicator provides a visual representation of market momentum and potential shifts.

Multi-Divergence Buy/Sell IndicatorThe "Multi-Divergence Buy/Sell Indicator" is a technical analysis tool that combines multiple divergence signals from different indicators to identify potential buy and sell opportunities in the market. Here's a breakdown of how the indicator works and how to use it:
Input Parameters:
RSI Length: Specifies the length of the RSI (Relative Strength Index) calculation.
MACD Short Length: Specifies the short-term length for the MACD (Moving Average Convergence Divergence) calculation.
MACD Long Length: Specifies the long-term length for the MACD calculation.
MACD Signal Smoothing: Specifies the smoothing length for the MACD signal line calculation.
Stochastic Length: Specifies the length of the Stochastic oscillator calculation.
Stochastic Overbought Level: Defines the overbought level for the Stochastic oscillator.
Stochastic Oversold Level: Defines the oversold level for the Stochastic oscillator.
Calculation of Indicators:
RSI: Calculates the RSI based on the specified RSI Length.
MACD: Calculates the MACD line, signal line, and histogram based on the specified MACD parameters.
Stochastic: Calculates the Stochastic oscillator based on the specified Stochastic parameters.
Divergence Detection:
RSI Divergence: Identifies a bullish divergence when the RSI crosses above its 14-period simple moving average (SMA).
MACD Divergence: Identifies a bullish divergence when the MACD line crosses above the signal line.
Stochastic Divergence: Identifies a bullish divergence when the Stochastic crosses above its 14-period SMA.
Buy and Sell Conditions:
Buy Condition: Triggers a buy signal when all three divergences (RSI, MACD, and Stochastic) occur simultaneously.
Sell Condition: Triggers a sell signal when both RSI and MACD divergences occur, but Stochastic divergence does not occur.
Plotting Buy/Sell Signals:
The indicator plots green "Buy" labels below the price bars when the buy condition is met.
It plots red "Sell" labels above the price bars when the sell condition is met.
Usage:
The indicator can be used on any timeframe and for any trading instrument.
Look for areas where all three divergences (RSI, MACD, and Stochastic) align to generate stronger buy and sell signals.
Consider additional technical analysis and risk management strategies to validate the signals and manage your trades effectively.
Remember, no indicator guarantees profitable trades, so it's essential to use this indicator in conjunction with other tools and perform thorough analysis before making trading decisions.
Feel free to ask any questions

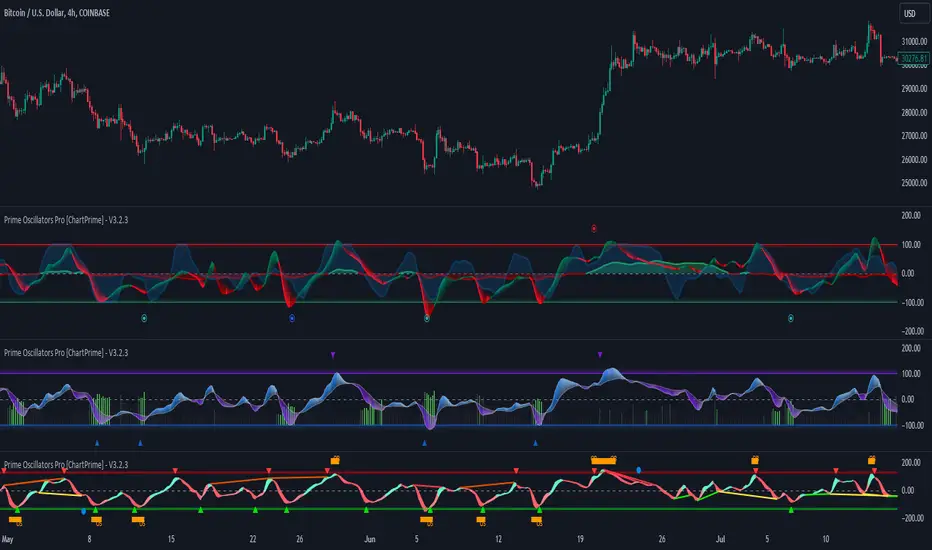
Prime Oscillators Pro [ChartPrime]The Prime Oscillators Pro suite provides two unique oscillators that provide useful insights on divergences, overbought and over sold conditions, momentum reversals, confluence alerts, amongst a myriad of other features.
The Trend Fusion Oscillator
This oscillator uses an amalgamation of price and volume to give market participants useful insight into possible future price action. It is designed in the format of a classical oscillator to be recogniseable and have a easy learning curve.
The main features of the Trend Fusion Oscillator:
Trend mode: The price volume oscillator uses an adaptive calculation to signify when price is entering a downtrend or and uptrend. When the price volume oscillator intersects with the adaptive plot the color of the price volume band will change to signify an uptrend or a down trend. This is easy to interpret with red signifying a down trend and green signifying an uptrend.
Oversold or overbought conditions: A reasonable range calculation was implemented and normalized in order to extrapolate areas of overbought an oversold conditions.
Divergences: When the price volume oscillator ribbon peaks and valleys are diverging with price action a thin line will connect the two diverging peaks or vallyes to indicate to market participants that there is a higher probability of a reversal. Divergences can be used in a classical fashion for trading.
Areas of reversal: These signals incorporate an algorithm that takes the median length of the assets trends, average true range, price deviation, volatility, and gap conditions, to signal areas with high a probability of reversal.
Main Settings
Oscillator Mode: Select the desired type of oscillator via this dropdown
Bands On/Off: Display deviation bands on the oscillators
Bearish Divergences On/Off: Allow for toggling of bearish divergences
Hidden Bearish Divergences On/Off: Allow for toggling of hidden bearish divergences
Bullish Divergences On/Off: Allow for toggling of bullish divergences
Hidden Bullish Divergences On/Off: Allow for toggling of bullish divergences
Max disatance between points: Input to adjust the distances between divergences in terms of candles
Use cases
The Trend Fusion Oscillator can be used in a simple fashion using the red/green waves to idenfity market direction. Using the waves of the market, a trader can filter other indicators and build confluence. This can also apply to contrarian logic. Divergences and oversold/bought levels can be used in confluence with other factors such as classical SR or other user selected indicators.
The Prime oscillator
Reversal signals: These are in essence a contrarian signal predicting the reversal of the market and the oscillator.
The peak seekers are blue dots that analyse multiple indicators to deduce more accurate and confluence within divergences. Settings here are auto optimised depending on the user selected timeframe.
The momentum ribbon analyses market volatility and produces an actionable ribbon on which other calculations are deduced. When it twists it can indicate a shift in the trend.
Divergences are calculated so the indicator can catch the maxmimum number of divergences in order to avoid possible reversals being missed by the trader.
Risk Disclaimer
All content and developments created by ChartPrime are purely for informational & educational purposes only. Past performance does not guarantee future results.
Ücretli komut dosyası
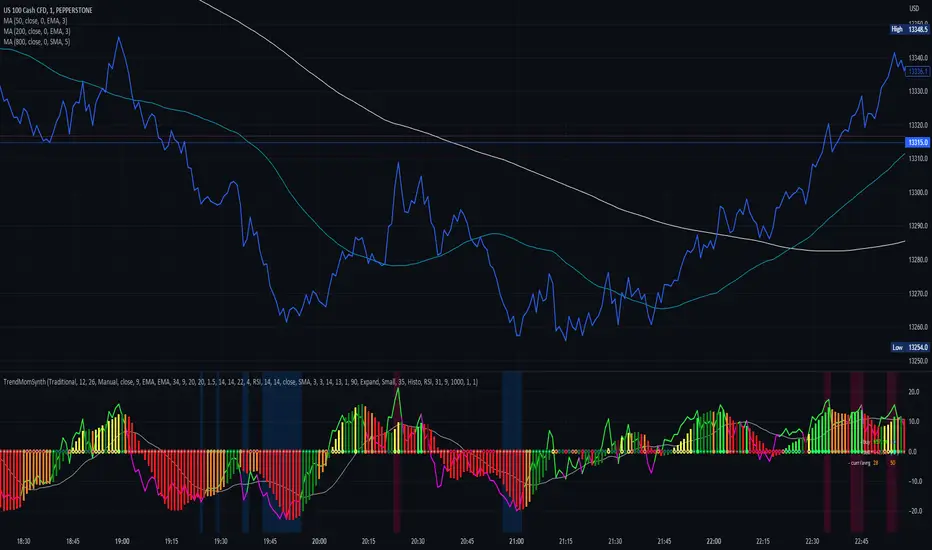
Trend Momentum SynthesizerBy analyzing the MACD (Moving Average Convergence Divergence) and Squeeze Momentum indicators, this indicator helps identify potential bullish, bearish, or undecided market conditions.
The algorithm within considers the positions of the MACD and Squeeze Momentum indicators to determine the overall market sentiment. When the indicators align and indicate a bullish market condition, the indicator's plot color will be either dark green, green, yellow, or lime, indicating a potential bullish trend. Conversely, if the indicators align and indicate a bearish market condition, the plot color will be maroon or red, denoting a potential bearish trend. When the indicators are inconclusive, the plot color will be orange, suggesting an undecided market.
The ADX is an addon component of this indicator, helping to assess the strength of a trend. By analyzing the ADX, the indicator determines whether a trend is strong enough, providing additional confirmation for potential trade signals. The ADX smoothing and DI (Directional Index) length parameters can be customized to suit individual trading preferences.
By combining these indicators, the algorithm provides traders with a comprehensive view of the market, helping them make informed trading decisions. It aims to assist traders in identifying potential market opportunities and aligns with the objective of maximizing trading performance.
How to use the indicator:
Note: I used back-testing for fine tuning do not base your trades on signals from the testing framework.
TDMACD Divergence Multi Timeframe and Alert [5ema]I reused some functions, made by (i believe that):
@paaax: The table position function.
@everget: The RSI divergence function.
@QuantNomad: The function calculated value and array to show on table for input symbols.
@ChaosTrader: The function calculated value TDMACD.
-----
What to do?
MACD divergence signal.
The crossing of MACD and Signal line.
The reversal of MACD.
The reversal of Signal line.
The screener follow 6 different timeframes.
Set notification alert when signal appears.
-----
How is it created?
MACD line = fastMA - slowMA.
Signal line = ta.ema(macd(), signalLength)
Make function for pivot low & high point of MACD and price.
Request.security that function for earch time frame.
-----
How to use?
Can be combined with many other indicators or candlestick patterns.
Customize the input indicators to suit your strategy
1. MACD reversed:
2. Signal line reversed:
3. MACD Divergence :
4. MACD crossing Signal line:
5. Signal on Screener for multi time frame:
Green ⦿: Buy.
Red ⦿: Sell.
Green 〇: Review Buy.
Red 〇: Review Sell.
-----
This indicator is for reference only, you need your own method and strategy.
If you have any questions, please let me know in the comments.

CoffeeShopCrypto 3pl MAThe CoffeeShopCrypto 3pl MA indicator is a technical analysis tool that uses three different moving averages to identify trends in the price of an asset. The three moving averages have lengths of 12, 26, and 50. If these numbers sound familiar its because they are based off the standard of the MACD indicator, and can be either simple moving averages (SMA) or exponential moving averages (EMA), depending on user preference.
The following is plotted on the chart
The fast EMA/SMA (based on the 12-period length) in yellow.
The mid EMA/SMA (based on the 26-period length) in gray.
The slow EMA/SMA (based on the 50-period length) in either green or red, depending on whether the current close price is above or below the Overall Trend MA.
In addition to the moving averages, the indicator also calculates the MACD (Moving Average Convergence Divergence), and uses it to color the bars based on the momentum of the asset.
The MACD is calculated using two user-defined lengths (fast and slow), as well as a user-defined smoothing length for the signal line. The oscillator and signal line can be either SMA or EMA, and the colors of the MACD bars are based on whether the histogram is growing or falling, and whether it is above or below the zero line.
Overall, this indicator provides traders with a comprehensive tool for understanding the trend of an asset, as well as the momentum behind that trend. The moving averages provide a clear visual representation of the trend, while the MACD bars give insight into the strength of that trend and potential shifts in momentum.
---------------LONG ENTRY----------------
MA1 above MA2 and Overall trend = Green
IF RSI is above its midline you are confirmed for a long entry
-----------Short Entry--------------
MA1 below MA2 and Overall trend = Red
IF RSI is below its midline you are confirmed for a short entry

SynthSAR ConfirmationThis indicator represents confirmation of a trend based on the PSAR indicator and includes signals from the MACD, stochastic oscillator, and awesome oscillator. It displays the points of the parabolic SAR on the chart, which help determine the direction of the trend. Additionally, the indicator allows for tracking signals based on the combined analysis of three other technical indicators: MACD, stochastic oscillator, and awesome oscillator. Furthermore, the indicator includes the ability to display buy/sell labels and signals for changing the trend direction. This is not an investment recommendation.Very effective in higher timeframes.If the MACD "macd line" crosses the "signal line" from above and the Stochastic %K line crosses the %D line from above, and the last column in the Avesome Oscillator is red, then the indicator gives a signal to sell. If the MACD "macd line" crosses the "signal line" from below and the Stochastic %K line crosses the %D line from below, and the last column in the Avesome Oscillator is green, then the indicator gives a signal to buy.

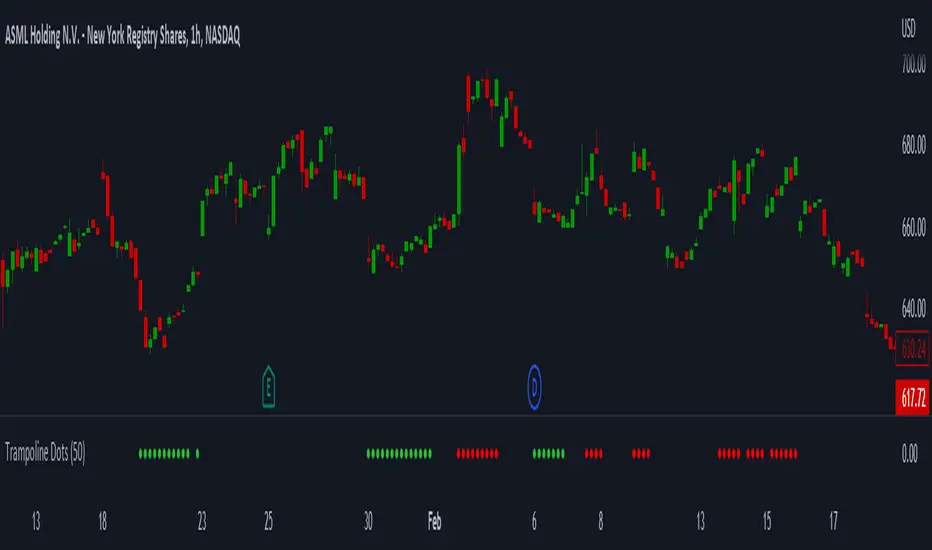
Trampoline DotsTrampoline Dots (Price Divergence)
Higher Time Frame Price Divergence:
Trampoline Dots serve as a "quick bounce" tool. These little dots will trigger whenever the higher aggregation MACD is above / below zero and the price is below / above the 50 period simple moving average. When these criteria are met, the price is usually under pressure of strong divergence, more often than not price will sharply reverse into the trend direction usually within the next few bars.
The Use of The Trampoline Dots:
This indicator can serve multiple ways. Obviously the main use case is the price divergence. These "dots" will not give you any precise & exact entry. But rather a zone of possible incoming reversal. There is no timing to it. All these dots will do is warn you about potential sharp reversal in the upcoming bars. It can be used by itself alone for sure, but the best way to utilize the dots is to use them in combination of other trend or momentum studies. The best signals are the ones that are within the larger time frame trend. Another great thing is that the visuals are really straight-forward and simple. It is either green dot or a red dot. Nothing more, nothing less. Also since the indicator is pretty small, it can be easily layered onto other studies as well which can create an additional confirmation for different patterns or setups.
Which Time Frame Are Reliable?
This indicator works on any time frame. But the most "stable" one is the daily & hourly time frame. My personal favorite is the hourly since these divergences can produce amazing entries in the daily trends (which are usually hidden on the daily chart). In the most aggresive trends, I like to see the green dots triggering around the 8 EMA and 13 EMA. Daily chart can show the daily and weekly (big divergences) that can take multiple days & weeks to resolve.
Hope it helps.