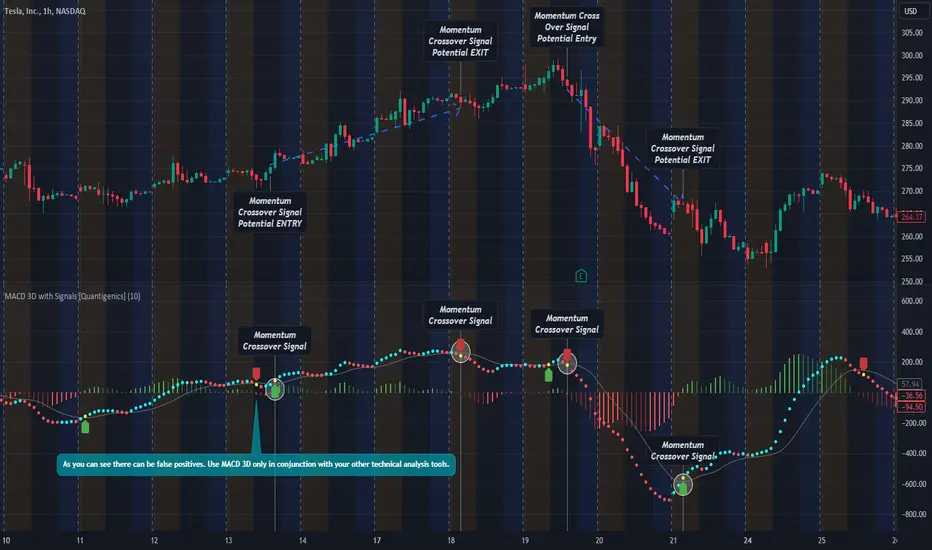
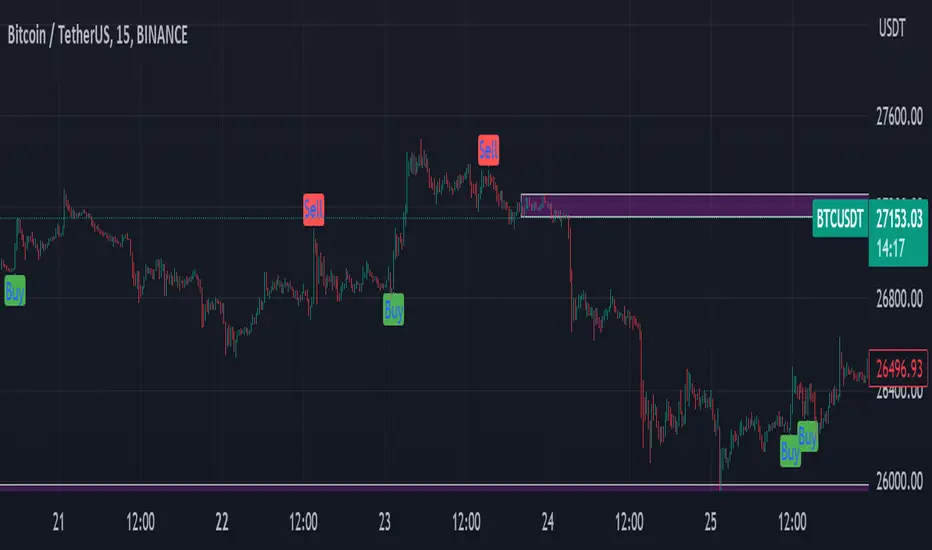
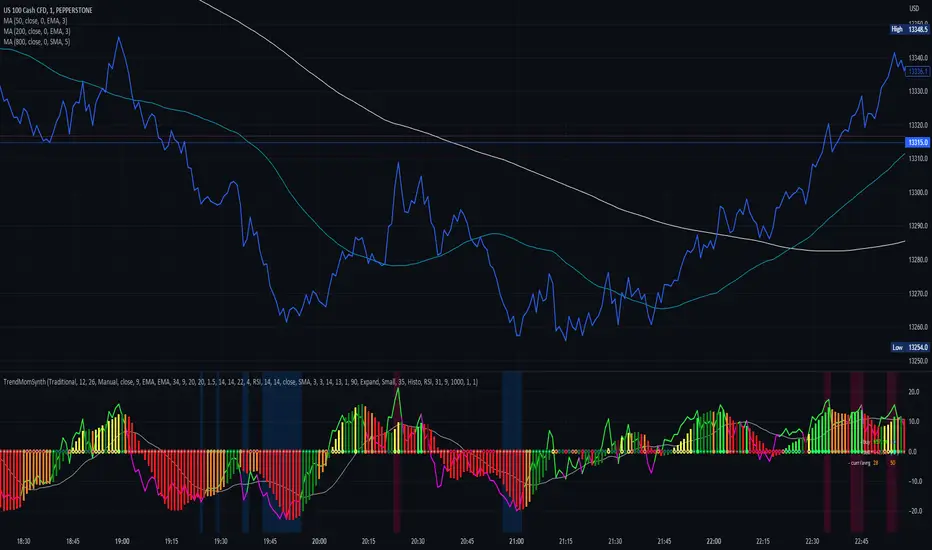
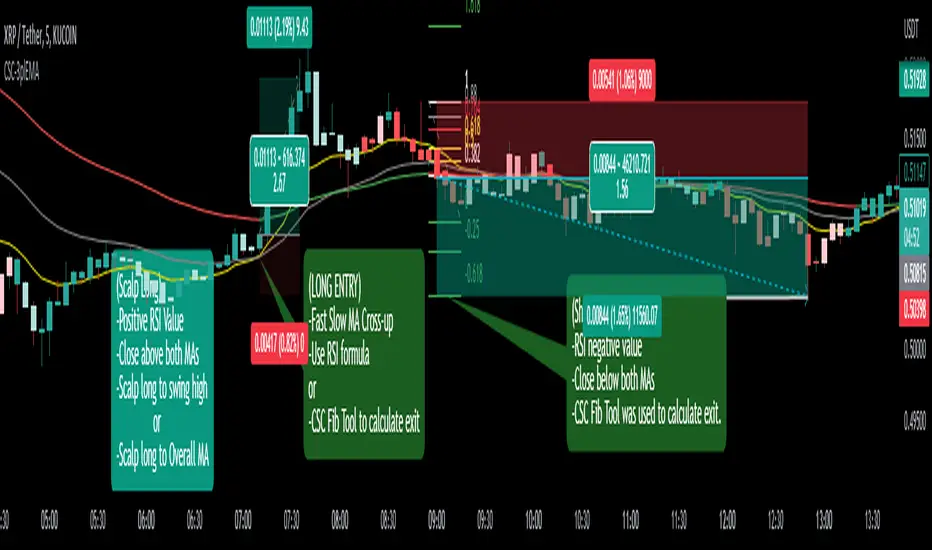
NeuPortal - Base Rate SignalsFive standard entry rules running simultaneously on the price chart: moving average crossover, RSI reversal, MACD cross, Bollinger re-entry and Stochastic cross. Each marks its own small triangle under or over the candle, tagged with the rule that fired it. When several agree on the same bar, a consensus label is drawn.
That part is ordinary. Thousands of scripts do it.
THE NUMBER EVERY SIGNAL SCRIPT LEAVES OUT
Each rule is scored live against the base rate on your chart. The table prints three things per rule:
hit - how often that rule was followed by a move in its own direction
base - how often ANY bar was followed by that same move over the same window
edge - the difference
That difference is the only thing an entry rule can honestly claim.
A rule that hits 54% sounds like an edge until you ask what a bar picked at random scores. In a market that drifted upward over the sample, "price is higher 20 bars later" might be true 53% of the time whatever you do. A rule at 54% against a 53% baseline has found almost nothing. Every signal indicator in existence reports the 54 and omits the 53.
The edge will often be small and sometimes negative. That is the expected result, not a fault in the script. On ETHUSDT 4h at the time of writing, a WMA 21/65 crossover long scores 44.7% against a base rate of 51.1% - an edge of minus 6.4 across 123 signals and 10,026 scored bars. Buying a random bar would have been better than buying that signal.
THE CONSENSUS ROW IS AN EXPERIMENT, NOT A FEATURE
"Three indicators confirm the entry" rests on an assumption nobody checks: that three indicators are three pieces of evidence.
They are not. Measured over 19,580 four-hour bars of full Binance history, the rank correlation between these families runs around 0.80. Stochastic against Williams %R reaches 0.92; RSI against CCI 0.90. For n readings correlated at r, the effective number of independent readings is about n / (1 + (n - 1) * r). Five rules at 0.80 come to roughly 1.4.
So set how many rules must agree, and watch what happens. If agreement were evidence, the edge would rise as the threshold rises. Usually only the signal count falls. Trading less often for the same expectation is not an improvement, and this is the first indicator I know of that lets you see that rather than assume it.
TIMING
Three modes. Confirmed waits for the bar to close and never changes afterwards. Anticipate fires one bar earlier by projecting each rule's spread across zero, so some of those crosses never happen. Live fires on the unfinished bar and repaints.
Switch between them and watch the edge column. Earlier is only better if the edge improves, and usually it does not. Note that in Live mode the historical percentages were not earned under those conditions - history contains no unfinished bars, so every past signal was scored as confirmed. Live mode flatters itself, and the table marks it.
HOW THE SCORING WORKS
A signal counts as correct if price closed higher (long) or lower (short) a fixed number of bars later. Every count uses only bars that had already completed when the label was drawn, so nothing repaints and no percentage knows anything the chart did not. Early in a chart the sample is tiny and the table says "too few" rather than printing a flattering number from six observations.
WHAT THIS IS NOT
Not a strategy and not advice. Hit rate says nothing about the size of wins against losses: a rule right 60% of the time can lose money steadily. This measures direction only, over one fixed horizon, with no costs, no slippage and no position sizing.
It is a tool for finding out whether a familiar rule does anything at all on your instrument. The usual answer is very little, and knowing that is worth more than another arrow.
Gösterge

5 Trend Indicators Combo IndicatorThe 5 Trend Indicators Combo with Retest Logic: A Comprehensive Guide
The "5 Trend Indicators Combo Indicator" is an advanced, multi-faceted technical analysis tool built using Pine Script for TradingView. Its primary purpose is to identify high-probability trend reversals and continuations by aggressively filtering out market noise and minimizing false breakout signals. Instead of relying on a single, isolated metric—which can often be misleading—this script utilizes a robust "confluence" methodology. It systematically evaluates five distinct, highly respected trend-following indicators, aggregating their individual statuses into a unified scoring system. Furthermore, it elevates standard signal generation by incorporating an intelligent pullback (retest) mechanism, explicitly designed to optimize entry prices so that traders do not buy at the absolute top or sell at the bottom of a sudden, volatile price spike. Additionally, it features a built-in graphical dashboard that allows traders to instantly monitor the bullish or bearish status of all five indicators in real-time.
Working Mechanism: How does it detect trading signals?
The core engine of this script evaluates five technical pillars, each contributing a maximum of one point to a total "Bull Score" or "Bear Score":
1. Exponential Moving Average (EMA): Defaulted to a 50-period length, the EMA establishes the chart's baseline directional bias. A bullish point is awarded if the current closing price is strictly above the EMA, and a bearish point is given if it is below.
2. Average Directional Index (ADX) & DMI: This component measures the absolute strength and direction of a trend. To score a point, the ADX value must exceed a specific threshold (defaulted to 20), acting as a strict filter to ensure the market is actually trending rather than chopping in a sideways range. Once this threshold is met, the Directional Indicators dictate the bias: +DI must be greater than -DI for a bullish point, and vice versa for a bearish point.
3. Moving Average Convergence Divergence (MACD): Operating with standard 12, 26, and 9 periods, the MACD assesses momentum shifts. The script requires strict criteria here: for a bullish score, the MACD line must be above the Signal line *and* above the zero baseline. Bearish points require the MACD line to be completely below both.
4. Supertrend:Utilizing a multiplier of 3.0 and an ATR period of 10, the Supertrend acts as a volatility-adjusted trailing stop. It awards a point depending on whether the current trend is mathematically calculated as bullish (direction < 0) or bearish (direction > 0).
5. Ichimoku Cloud (Kumo): The script analyzes the relationship between the closing price and the Kumo (Cloud), which is defined by Senkou Span A and Span B projected 26 periods into the future. A bullish point is granted only if the price has successfully broken out above the top boundary of the cloud, signifying dominant long-term momentum. A bearish point requires a breakdown below the bottom boundary.
Once the overall score is tallied (ranging from 0 to 5), the script compares it against a user-defined "Minimum Confluence Score". When the score crosses this threshold, an initial trend signal is generated. However, the script's standout technical feature is its "Retest / Pullback" logic. Instead of firing the final execution alert immediately upon the breakout, the script enters a "pending" state. It calculates a dynamic retracement target using an Average True Range (ATR) multiplier. For a buy signal, the price must briefly retrace down to `Close - (ATR * Multiplier)`. The script waits for a maximum number of candles (default is 3) for this pullback to occur. If the price successfully touches this retest level, a highly optimized, safe entry is signaled. If the time expires without a retest, the script automatically fires a delayed entry to ensure the trader does not miss a runaway trend.
How to Use: Optimal Settings and Suitable Markets
To deploy this indicator effectively, traders should focus on optimizing the 'Minimum Confluence Score'. A score of 3 is the recommended baseline, offering a healthy balance between trade frequency and signal accuracy. Increasing this to 4 or 5 will result in much stricter, albeit fewer, high-conviction signals. The Retest ATR Multiplier and Max Wait Bars must be adjusted according to the timeframe; faster timeframes might require smaller ATR multipliers to successfully catch brief micro-pullbacks before the timer expires.
Regarding suitable markets, this indicator is exclusively designed for trending environments. It performs exceptionally well in high-liquidity, directional markets such as major Forex pairs (e.g., EUR/USD, GBP/JPY), large-cap cryptocurrencies (Bitcoin, Ethereum), and major stock indices (S&P 500, NASDAQ). Because it relies heavily on trend-following logic and moving averages, it is most appropriate for medium to higher timeframes, particularly the 1-hour, 4-hour, and Daily charts. Using it on extremely low timeframes (like 1-minute or 3-minute charts) may expose it to excessive intraday noise and erratic wicks, though the ADX filter and Retest mechanism will actively attempt to mitigate those risks. Ultimately, this script transforms a standard chart into a highly systematic, rule-based trading system. Gösterge

Confluence Suite: Pivot Points SuperTrend Confluence Suite: PP SuperTrend + VWAP + MACD + RSI + ADX + Volume
A multi-factor confluence dashboard built around Pivot Point SuperTrend, designed for futures trading on any timeframe.
Overview
This indicator combines six widely-used tools into a single confluence system with a live on-chart dashboard:
Pivot Point SuperTrend — the core trend/entry engine, using pivot highs/lows instead of a simple moving midpoint to anchor its ATR bands
VWAP — session-anchored, used to gauge whether price is trading with or against the volume-weighted average
MACD — momentum confirmation and early continuation signals
RSI — momentum/overbought-oversold context
ADX / DMI — trend-strength filter, so signals can be weighted by whether the market is actually trending or chopping
Volume — flags above-average participation and volume spikes
Higher-timeframe (HTF) bias filter — checks trend direction on a higher timeframe (EMA-based or ATR SuperTrend-based) before treating a signal as confirmed
All of this feeds a compact on-chart dashboard table that shows the live bias of every component at a glance, plus a running bullish/bearish confluence score.
How signals work
Raw flip signals — small triangles mark every Pivot Point SuperTrend direction flip
Confirmed signals — larger LONG/SHORT labels fire when a flip is also aligned with the HTF bias filter (and optionally ADX strength), meant to filter out lower-quality flips
Continuation signals — smaller circular markers that fire while an existing trend is still active, triggered by a pullback-and-reclaim of a short EMA, an RSI reset through 50, or a MACD cross (configurable), so the tool isn't limited to a single signal per swing
Dashboard
A table (position and size configurable) shows the current bias of PP SuperTrend, VWAP, MACD, RSI, ADX, Volume, HTF Bias, and Continuation mode, along with an aggregate bull/bear confluence count — useful for judging signal quality at a glance rather than reading each indicator separately.
Inputs
Every component is independently configurable: Pivot Point period, ATR factor/period, VWAP source, MACD lengths, RSI length/levels, ADX/DMI length and strength threshold, volume MA length and spike multiplier, HTF timeframe and bias method, continuation trigger type and cooldown, and dashboard placement/size. Built-in alert conditions are included for raw flips, confirmed signals, and continuation signals.
How to use it
This is a discretionary confluence tool, not a standalone automated strategy. It's best used to:
Gauge whether a Pivot Point SuperTrend flip has broader support from momentum, volume, and higher-timeframe trend before acting on it
Track ongoing trend health via the continuation signals and dashboard, rather than only reacting at the initial flip
Filter out lower-quality setups using the ADX and HTF alignment options
As with any indicator, backtest and forward-test on your specific instrument and timeframe before trading it live, since default settings won't be optimal for every market or volatility regime.
Credits and originality
The core trend engine is an original implementation of the Pivot Point SuperTrend technique, a widely used community approach that anchors SuperTrend-style ATR bands to pivot highs/lows rather than a simple moving midpoint — a method popularized on TradingView by LonesomeTheBlue. This script's contribution is combining that engine with VWAP, MACD, RSI, ADX, volume, an HTF bias filter, a continuation-signal engine, and a unified live dashboard into one integrated confluence tool, rather than requiring multiple separate indicators on the chart.
Disclaimer
This script is provided for educational and informational purposes only and does not constitute financial advice. Trading futures involves substantial risk of loss and is not suitable for all investors. Past performance of any strategy or setup does not guarantee future results. Always do your own research and risk management before trading. Gösterge

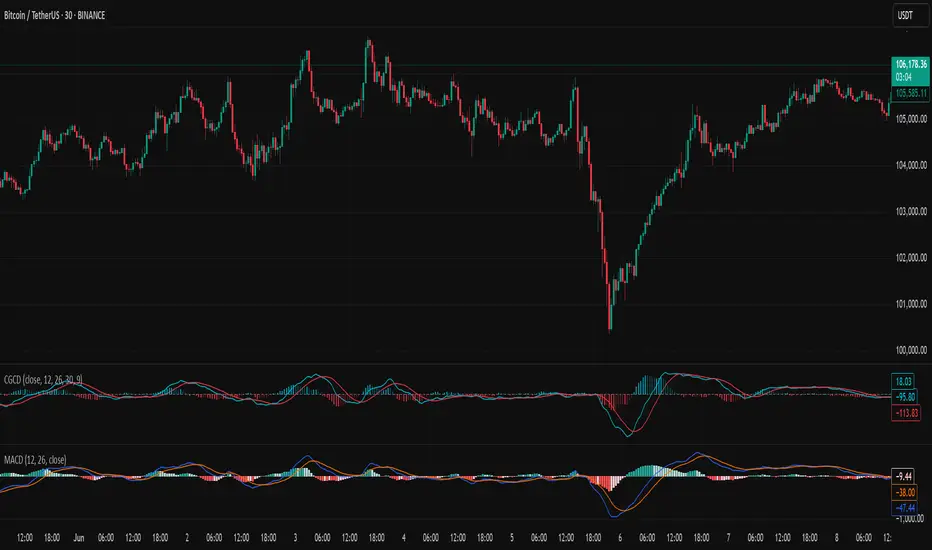
MACD Dynamic Squeeze Pro [ZynAlgo]1. Technical Overview
ZynAlgo MACD Dynamic Squeeze Pro is a momentum-context indicator built from the traditional MACD concept. Instead of trying to pick tops and bottoms against the trend, it focuses on trend-following shakeouts, energy compression, and breakout confirmation after a squeeze phase.
2. Chart Reading & UI Guide
ZynAlgo Ribbon
The area between the MACD line and Signal line is filled with Green/Purple ribbon colors.
The ribbon helps traders quickly see which side currently has momentum control.
Use the ribbon as context for your own trading approach, not as a standalone entry trigger.
4-State Histogram
Neon Green highlights bullish acceleration.
Neon Purple highlights bearish acceleration.
Faded colors warn that momentum is losing strength or price may be stagnating.
Diamond Marker on Main Chart
The breakout context marker is plotted directly on the main price chart.
This reduces the need to constantly switch attention between the oscillator pane and price candles.
Treat the marker as a context alert that should be confirmed with your own entry method, risk plan, and market structure.
3. Zyn Explosion Logic
The Green/Purple diamond markers appear only when the indicator detects several conditions together:
Trend Filter: The MACD and Signal lines must both be above the Zero line for bullish trend context, or both below the Zero line for bearish trend context.
Squeeze Phase: The histogram compresses, showing that the market is consolidating or shaking out traders.
Explosion Phase: After the squeeze, MACD crosses the Signal line with enough timing alignment to suggest momentum expansion.
This is a context/analysis tool, not a signal generator. The marker identifies a possible momentum continuation area, but it does not execute trades or guarantee direction.
4. Settings Explanation
Momentum Average Length
Controls the period used to calculate the average volatility of the histogram.
This average becomes the baseline for detecting whether current momentum is compressed.
Squeeze Compression Ratio
Controls how tightly the histogram must compress before the market is considered to be in a squeeze phase.
For example, 0.5 means the current histogram column must compress to less than 50% of the average.
Lower values reduce marker frequency and make the squeeze requirement stricter.
Squeeze Valid Lookback
Defines how many bars after the squeeze phase the MACD cross can still qualify.
This helps reject late or off-beat crossover events.
5. Recommended Presets
Gold Breakout - XAUUSD 5m/15m
Squeeze Average Length: 20
Squeeze Compression Ratio: 0.4
Valid Lookback: 3
Useful when gold creates short-term shakeouts before starting a stronger trend move.
Crypto Trend Following - BTC/ETH 15m/1H
Squeeze Average Length: 30
Squeeze Compression Ratio: 0.5
Valid Lookback: 5
Useful when crypto spends longer periods in sideways consolidation before momentum expansion.
6. Best Practices & Limitations
Use this tool as momentum and squeeze context for your own framework.
Confirm any trade idea with price structure, session context, volatility, and risk planning.
A diamond marker is not an automatic buy or sell instruction.
This tool does not predict price movement.
You alone are responsible for your trading decisions.
No tool eliminates risk or guarantees results.
Gösterge

Gösterge

MACD Pullback Validation with Divergence Filters [algo_aakash]MACD Pullback Validation with Divergence Filters is a momentum confirmation indicator designed to identify continuation opportunities after temporary pullbacks rather than generating signals from every MACD crossover.
Instead of relying on a single event, the script evaluates multiple stages of market behavior. It begins by detecting pullbacks within an existing momentum cycle, waits for momentum recovery, confirms that price and the MACD histogram are no longer weakening, and optionally verifies that the setup occurs near significant price locations using pivot-derived support/resistance levels or Bollinger Band extremes.
The objective is to reduce low-quality MACD signals by requiring several independent conditions to align before a bullish or bearish signal is displayed.
Problem Statement
Traditional MACD crossover signals frequently occur during ranging markets or immediately after short-lived momentum fluctuations. Likewise, divergence signals alone often appear too early and do not necessarily indicate that momentum has already shifted back in the anticipated direction.
This indicator addresses that limitation by requiring multiple confirmation stages rather than treating each condition as an independent trading signal.
Instead of responding to isolated events, it evaluates whether a pullback has occurred, whether momentum is rebuilding, whether a recent divergence supports the move, and whether price is located in an area where reversals may be more meaningful.
Methodology
The analytical framework consists of several sequential validation layers.
First, MACD crossover events occurring above or below the zero line are monitored to identify temporary pullbacks within an existing momentum cycle. These crossover events establish the recent pullback state.
Next, the script monitors the MACD histogram. Bullish momentum requires the histogram to remain above zero while increasing relative to the previous bar. Bearish momentum requires the histogram to remain below zero while decreasing.
The indicator then waits for the MACD line itself to cross the zero line, treating this as evidence that momentum has shifted back in the direction of the prevailing move.
Histogram divergence is calculated using confirmed pivot highs and pivot lows. Regular bullish divergence requires price to form a lower low while the histogram forms a higher low. Regular bearish divergence requires price to form a higher high while the histogram forms a lower high. Hidden divergence calculations are also available for users who wish to visualize continuation-type divergence.
Finally, optional contextual filters may be enabled.
The Support/Resistance filter checks whether the current price is interacting with recently confirmed pivot-based levels.
The Bollinger Band filter requires bullish setups to occur after closing below the lower band and bearish setups after closing above the upper band, helping identify momentum reversals from statistically extended price conditions.
Signals are generated only after every enabled validation layer has been satisfied.
Signal Workflow
Bullish workflow
1. Detect a recent bearish MACD crossover occurring above the zero line to identify a pullback.
2. Confirm a regular bullish MACD histogram divergence using pivot comparisons.
3. Require the MACD histogram to begin strengthening.
4. Wait for the MACD line to cross back above the zero line.
5. Optionally require interaction with recent pivot-based support.
6. Optionally require price to close below the lower Bollinger Band.
7. Display a bullish signal.
Bearish workflow
1. Detect a recent bullish MACD crossover occurring below the zero line.
2. Confirm a regular bearish MACD histogram divergence.
3. Require bearish histogram acceleration.
4. Wait for the MACD line to cross below the zero line.
5. Optionally require interaction with recent pivot-based resistance.
6. Optionally require price to close above the upper Bollinger Band.
7. Display a bearish signal.
Why This Indicator Is Different
Many MACD indicators generate signals immediately after crossovers, while divergence indicators typically evaluate price and momentum independently.
This script integrates these concepts into a sequential validation framework where each condition serves a different analytical purpose.
The pullback logic identifies temporary counter-trend momentum.
The histogram evaluates whether momentum is rebuilding.
The zero-line crossover confirms broader momentum alignment.
Divergence provides evidence that momentum and price are no longer moving in agreement.
Optional pivot interaction and Bollinger Band filters add market-location confirmation before a signal is produced.
Rather than displaying every crossover or every divergence, the indicator waits until multiple independent conditions align before producing a trading signal.
Inputs
The script includes configurable parameters for:
* MACD fast, slow, and signal periods
* Pullback lookback window
* Divergence pivot lengths
* Divergence range settings
* Optional hidden divergence display
* Optional Support/Resistance validation
* Pivot sensitivity
* Optional Bollinger Band confirmation
* Bollinger Band length and standard deviation
Alerts
Built-in alert conditions are available for:
* Bullish Signal
* Bearish Signal
* Regular Bullish Divergence
* Hidden Bullish Divergence
* Regular Bearish Divergence
* Hidden Bearish Divergence
Practical Usage
The indicator is intended for traders who prefer waiting for momentum confirmation after temporary pullbacks instead of reacting to every MACD crossover.
Optional Support/Resistance and Bollinger Band filters can be enabled to make signal selection more restrictive when additional price-location confirmation is desired.
Limitations
MACD histogram divergence relies on confirmed pivot highs and lows, so divergence signals are only confirmed after the required pivot bars have formed.
Support and resistance levels are derived from pivot calculations and represent algorithmically identified swing points rather than manually drawn market structure.
Like any momentum-based indicator, performance may vary across different market conditions and should be evaluated alongside a broader trading plan and appropriate risk management.
Notes
This indicator is intended as an analytical decision-support tool. It combines momentum analysis, pullback recognition, divergence detection, and optional contextual filters into a structured confirmation process rather than relying on any individual condition as a standalone trading signal.
Gösterge

Multi-TimeFrame Multi-Indicator Dashboard🚀 Multi-Timeframe Multi-Indicator Market Structure Dashboard
🟢 Overview
The **Multi-Timeframe Multi-Indicator Dashboard** is an all-in-one market scanner designed to give traders an immediate, high-level view of an asset's trend across multiple layers of time. Instead of constantly flipping between charts or cluttering your workspace with dozens of indicators, this script compiles key moving averages, momentum oscillators, and volatility indicators into a single, highly readable table directly on your primary workspace.
This tool is optimized for **Equities, Forex, Crypto, Indices, and Commodities traders** who rely on multi-timeframe confluence to confirm high-probability trade setups and eliminate analysis paralysis.
---
🛠️ Key Features
**Multi-Timeframe Confluence Matrix:** Instantly track market structure across 6 default timeframes: **5M, 15M, 1H, Daily, Weekly, and Monthly**.
**8 Integrated Technical Metrics:**
**Trend Identification:** SMA 9, SMA 20, SMA 50, SMA 100, and SMA 200.
**Momentum & Volatility:** Relative Strength Index (RSI 50-line crossover), MACD Histogram (bullish/bearish momentum shifts), and SuperTrend.
**Fully Customizable Layout:** Toggle specific timeframes or indicators on/off via the user inputs menu to perfectly match your trading style. You can also change the table position (e.g., top-right, bottom-left) and text size.
**Smart Alert Engine:** Configure the script to send real-time alerts the exact moment an indicator shifts states (Bullish $\leftrightarrow$ Bearish) on your primary timeframes.
---
🎛️ Settings & Customization
1. **Dashboard Display:** Control the visibility, positioning anchor (top-right, bottom-right, top-left, bottom-left, middle-right, middle-left), and text scaling of the canvas table.
2. **Timeframes to Display:** Toggle individual columns to focus strictly on scalping or macro swing horizons.
3. **Indicators to Display:** Strip out unnecessary lines to match your personal strategy components.
4. **SuperTrend Settings:** Manually adjust the ATR Length and Multiplier inputs for tighter or wider trend bands.
---
📝 Disclaimer
This indicator is built purely for analytical visualization and informational purposes. It does not constitute financial advice. Always practice strict risk management and combine dashboard confirmation with your own broader trading plan. Gösterge

Macd matrix eliteMACD Matrix Elite is a momentum dashboard built around the MACD, with additional context from dynamic overbought/oversold zones, RSI, Stochastic, divergences, confluence points, and live signal scoring.
The main idea is to keep the MACD readable while adding enough context to avoid looking at a simple crossover in isolation. A MACD cross can be useful, but it is often more meaningful when it happens near an extreme zone, with improving histogram momentum, or with confirmation from another oscillator.
The script uses the standard MACD structure:
- Fast EMA
- Slow EMA
- MACD line
- Signal line
- Histogram
Around that core, the indicator adds dynamic OB/OS zones based on normalized ATR. This means the extreme areas can adapt to current market volatility instead of relying only on fixed horizontal levels.
Additional filters are used as context:
- RSI overbought/oversold readings
- Stochastic overbought/oversold readings
- MACD histogram direction
- MACD zero-line crosses
- Regular and hidden divergences
- Bullish and bearish confluence points
- Strength score and reversal pressure panels
The background is designed to help quickly identify the current environment. Green-toned areas usually represent bullish pressure, red-toned areas bearish pressure, and neutral zones show when the market is less extended.
How to read the main signals:
A bullish MACD cross happens when the MACD line crosses above the signal line. This can show that momentum is improving. It becomes more interesting when the histogram is rising, price is recovering from an oversold area, or RSI/Stochastic are also showing exhaustion to the downside.
A bearish MACD cross happens when the MACD line crosses below the signal line. This can show that momentum is weakening. It becomes more interesting when the histogram is falling, price is coming from an overbought area, or RSI/Stochastic are also showing exhaustion to the upside.
The zero line is an important reference. When MACD crosses above zero, bullish momentum is usually gaining broader confirmation. When MACD crosses below zero, bearish momentum is usually gaining broader confirmation.
The confluence points appear when several conditions align. They are not meant to be blind entry signals. They are visual markers showing that multiple parts of the momentum model are pointing in the same direction.
Beginner example 1:
The MACD line crosses above the signal line while the histogram starts rising from below zero. RSI and Stochastic are also coming from oversold levels. This does not guarantee a reversal, but it gives a trader a cleaner bullish setup to investigate on price action.
Beginner example 2:
The MACD line crosses below the signal line after a strong upside move. The histogram begins to fall and the script shows an overbought environment. This can warn that bullish momentum is cooling. A beginner can then check whether price is rejecting resistance or breaking a local support.
Beginner example 3:
Price makes a higher high, but the MACD makes a lower high. If a bearish divergence is confirmed, it can show that the new price high is not supported by stronger momentum. This can help traders become more cautious with long positions.
Beginner example 4:
Price makes a lower low, but the MACD makes a higher low. If a bullish divergence is confirmed, it can show that downside pressure is weakening. It is usually better to wait for confirmation from price structure instead of entering only because the divergence appeared.
About the score:
The score is a visual summary of several conditions inside the script. It compares bullish and bearish momentum factors such as crosses, histogram direction, OB/OS zones, confluence, and divergences. A higher score means more conditions are aligned, not that the trade is guaranteed to work.
About the signal history:
The signal history panel is designed as a visual tracking tool. It helps review how previous marked conditions evolved using the script’s internal SL/TP model. It should not be treated as a full backtest or as a guarantee of future results.
Useful settings:
- Use Dynamic OB/OS if you want the zones to adapt to volatility.
- Lower the minimum signal score if you want more signals.
- Raise the minimum signal score if you want fewer but more selective signals.
- Disable panels if you prefer a cleaner chart.
- Keep divergence labels enabled if you use momentum divergence in your analysis.
Best use:
MACD Matrix Elite works best as a momentum context tool. It can help identify shifts in pressure, exhaustion zones, confluence areas, and possible momentum divergences. For better decision-making, combine it with trend structure, support and resistance, volume, and risk management.
Limitations:
This indicator does not predict future price movement. Strong trends can keep MACD, RSI, or Stochastic extended for a long time. Divergences can fail in high momentum markets. The score and panels are there to organize information, not to replace a complete trading plan. Gösterge

Multi-Oscillator Divergence ConfluenceMulti-Oscillator Divergence Confluence (MODC)
MODC is a three-layer divergence analysis indicator built to make oscillator divergence easier to read without turning the chart into a wall of labels.
The script evaluates RSI, MACD, Stochastic, CCI, MFI, and OBV at the same confirmed price pivots. This shared-pivot approach keeps oscillator votes aligned to the same market structure point instead of mixing unrelated oscillator pivots.
The goal is not to create a standalone buy/sell system. MODC is designed as a visual confirmation and context tool for traders who already use market structure, trend context, and risk management.
What makes MODC different
MODC is built as a three-layer system:
1. Always-on market context
The pane stays useful on every bar, even when no divergence signal is active.
It includes:
- A Confluence Pressure Wave from 0 to 100.
- A regime ribbon identifying Trending, Ranging, Volatile, or Quiet conditions using ADX and ATR percentile.
- An oscillator stack histogram showing whether more enabled oscillators are leaning bullish or bearish.
- Subtle pressure background zones when divergence pressure builds.
This layer helps show the “story” before a confirmed signal appears.
2. Informational Setup layer
In Exploratory mode, subtle setup dots appear when divergence pressure builds near a recent swing extreme.
A Setup is not a confirmed divergence signal. It is only a watch-list event.
Setup dots require:
- Pressure wave crossover.
- At least two oscillators leaning in the same direction.
- Price near a recent swing high or swing low using ATR-based proximity.
Setup alerts are disabled by default because Setups are pre-confirmation events and may never become confirmed pivot divergences.
3. Confirmed Valid and Elite signals
Confirmed signals are based on price pivots. A pivot only confirms after the selected Pivot Right Bars have closed.
Valid signals require:
- A confirmed price pivot.
- Minimum oscillator confluence.
- A base score threshold.
- Hidden divergences aligned with EMA context.
Elite signals require Valid conditions plus a stricter quality gate:
- EMA context.
- ADX trend-strength rules.
- Regime-adaptive score threshold.
- Optional volume gate.
- Optional historical forward-return proxy gate.
Signal labels are compact:
- RB = Regular Bullish
- HB = Hidden Bullish
- RS = Regular Bearish
- HS = Hidden Bearish
The number beside the label is the signal score. Visual intensity scales with score:
- 50-65 = muted
- 66-79 = clear
- 80+ = premium / Elite
How the scoring works
Scoring is intentionally conservative and always based on confluence out of six oscillators. Disabling oscillators does not inflate the score.
The score considers:
- Oscillator confluence count.
- Correct reversal or continuation context.
- Whether enabled oscillators are in exhaustion zones.
- Volume participation.
- Pivot spacing quality.
- Market regime alignment.
- A penalty when fewer than four oscillators are enabled.
Regular divergence and hidden divergence are treated differently:
- Regular Bullish = potential reversal from weakness.
- Regular Bearish = potential reversal from strength.
- Hidden Bullish = potential trend continuation above the EMA.
- Hidden Bearish = potential trend continuation below the EMA.
Display modes
Signal Density:
- Conservative: Elite only.
- Balanced: Valid + Elite. This is the default.
- Exploratory: Setup + Valid + Elite.
Visual Intensity:
- Minimal: pressure wave and confirmed badges only.
- Standard: pressure wave, regime ribbon, stack histogram, confirmed lines and badges.
- Cinematic: Standard mode plus Elite aura, candle tint, stronger atmosphere, and compact HUD stats.
Suggested usage
Start with:
- Signal Density: Balanced
- Visual Intensity: Standard
Use Layer 1 to understand market context. Treat Setup dots as early watch-list information only. Use Valid and Elite signals as confirmation points, not automatic entries.
For alerts, use the confirmed Valid or Elite alert conditions and set alerts to Once Per Bar Close.
Repaint and delay disclosure
Confirmed Valid and Elite outputs are evaluated on closed bars.
Because this script uses confirmed pivots, a divergence signal is only known after Pivot Right Bars have closed. The marker is drawn back on the pivot bar for visual alignment only. The signal was not actionable on the original pivot bar.
The Setup layer is different: Setups are informational pressure events, not confirmed divergence signals. They may never become confirmed signals.
Forward-return proxy disclosure
MODC includes optional forward-return proxy statistics for visible chart history. These are in-sample summaries only.
They are not a backtest. They do not include commissions, slippage, position sizing, stops, targets, or risk management. They should not be interpreted as expected future performance.
Limitations
Divergence can fail, especially during strong trends or news-driven moves. Oscillators are related momentum tools, so confluence does not guarantee independence. This indicator should be used with broader market structure, trend analysis, and a defined risk plan.
This script is for analysis and education only. It is not financial advice and is not a standalone trading system. Gösterge

Gösterge

Adaptive Swing Matrix | MouryaThis indicator provides a Multi-Timeframe (MTF) table matrix designed to display the real-time states of several standard momentum and trend indicators across 11 user-defined timeframes simultaneously.
The primary purpose of this script is to consolidate chart real estate. By organizing MTF data into a single table, it allows users to monitor higher-timeframe trends and oscillator states without needing to continuously switch chart intervals or clutter their screen with multiple lower panes.
Indicator Logic & Components:
This matrix tracks the following standard indicators across the user's chosen timeframes:
Trend (EMA Crossover): Evaluates a fast EMA crossing a medium or slow EMA, filtered by a macro 200-period baseline EMA.
RSI (Relative Strength Index): Displays the current RSI value, color-coded based on user-defined breakout/breakdown thresholds.
MFI (Money Flow Index): Displays volume-weighted momentum.
ADX (Average Directional Index): Evaluates trend strength to filter out sideways consolidation periods.
MACD (Moving Average Convergence Divergence): Evaluates the relationship between the MACD line and the Signal line relative to the zero-line. The matrix uses the following acronyms to display the exact MACD state:
AZPCO: Above Zero, Positive Crossover (MACD is > 0 and MACD > Signal)
AZNCO: Above Zero, Negative Crossover (MACD is > 0 and MACD < Signal)
BZPCO: Below Zero, Positive Crossover (MACD is < 0 and MACD > Signal)
BZNCO: Below Zero, Negative Crossover (MACD is < 0 and MACD < Signal)
VWAP (Volume Weighted Average Price): Displays the current VWAP value and highlights if the closing price is currently holding above or below the baseline.
NASDAQ:INTC Matrix Features:
Customizable Timeframes: Users are not restricted to default intervals. You can input custom minute, hour, day, week, or month intervals for all 11 rows via the settings menu.
Overall Consensus Score: The bottom row of the table evaluates a 7-timeframe core grouping. If a strict majority of these selected timeframes share the same trend direction, it outputs a unified directional signal.
Visual Chart Overlays: Users can optionally enable the EMA lines and VWAP bands on their main chart. These visual elements have been strictly segregated in the indicator's Style tab for easy toggling.
All backend settings—including lengths, source data, and trigger thresholds for the RSI, MFI, and ADX—are fully unlocked in the inputs menu for personal customisation. Gösterge

QAI Vegas Intelligent Channel ProIntroduction & User Manual QAI Vegas Intelligent Channel Pro
Autumn AI · Vegas Intelligent Channel Pro
Type: Pure Technical Analysis Reference Indicator (NOT a Strategy)
1. Introduction
QAI Vegas Intelligent Channel Pro is a professional-grade, multi-timeframe, multi-layered technical analysis reference indicator developed by the Autumn AI team. Built around the classic Vegas Tunnel (144/169 EMA) as its core framework, it integrates short-term (21/55), medium-term (288/338), and long-term (576/676) EMA channels, an advanced VWAP system with deviation bands, Bollinger Bands breakout logic, and comprehensive divergence detection across four major oscillators: RSI, MACD, KDJ, and Stochastic (both regular and hidden divergence).
Important Disclaimer (Please Read Carefully):
This indicator is designed exclusively as a visual reference tool and decision-support indicator. It is NOT a trading strategy and does NOT generate any automated buy/sell signals. All bubble labels, info panel readings, divergence alerts, and overall recommendations are provided for informational and analytical purposes only. Traders must combine this tool with their own independent market analysis, strict risk management, and personal trading plan. Past performance is not indicative of future results. Trading carries substantial risk of loss.
2. Key Features
Multi-layered EMA channel system (Short / Mid / Long + Vegas Tunnel) with optional MTF for Vegas
Advanced VWAP system (Daily/Session reset + multi-SD bands + minimum distance filter)
Quad-oscillator divergence confluence (RSI + MACD + KDJ + Stochastic)
Bollinger Bands Squeeze & Expansion breakout assistance
Real-time Info Panel (original detailed 2-column 24-row layout)
5-minute auto-expiring bubble labels for breakouts, divergences, and strong signals
Full visibility controls (one-click show/hide for all channels)
Native TradingView dynamic alert system (trend change, strong signals, various divergences, etc.)
3、Recommended Default Settings
Source: close (recommended)
Visibility Controls: All on by default; when screen space is limited, keep only Vegas Tunnel + Filter Line + Info Panel
VWAP: Enable and keep useVWAPFilter = true
Bollinger Breakout: Enabled by default as auxiliary confirmation
Buy/Sell Arrows: Disabled by default (showArrows = false)
Core Reference Workflow (Practical Guide)
Start with Vegas Tunnel: Price above upper band + bullish tunnel alignment → bullish bias reference; below lower band + bearish alignment → bearish bias reference
Filter Line Confirmation: Price must be above/below EMA12 Filter for valid trend consideration
Channel Confluence: Short channel breakout + Vegas alignment + mid/long-term direction agreement = significantly stronger reference
Divergence Confluence: Multiple oscillators showing bullish/bearish divergence simultaneously = key reversal/continuation reference point
VWAP & Bollinger Assistance: Price far from VWAP + Bollinger expansion breakout = enhanced reference strength
Info Panel Quick Overview: Instant view of channel prices, distance %, indicator status, and overall recommendation
Bubble Labels: Real-time visual alerts that auto-delete after 5 minutes for clean charting
Info Panel Explanation
The panel uses the original detailed layout (2 columns, 24 rows) and displays:
Real-time prices and directional suggestions for all channels
Vegas distance percentage, VWAP/ATR, current price
Individual status for RSI, MACD, KDJ, Stochastic, Bollinger Bands, and Volume
Overall Recommendation and Trend at the bottom
4. Risk Disclaimer
Once again, this is strictly a reference indicator and NOT a trading strategy.
Autumn AI and the indicator developer assume no responsibility for any trading losses incurred from using this tool. Always practice proper position sizing, strict stop-loss discipline, and trade only within your personal risk tolerance. Gösterge

ATC MACD EvolvedWhat It Is
ATC MACD Evolved is a precision-engineered rebuild of the classic Moving Average Convergence Divergence indicator. It keeps the familiar MACD structure traders already know — fast EMA, slow EMA, signal line, histogram — and replaces every weak link in that structure with a cleaner, more reliable equivalent. The result is a MACD that reads momentum more clearly, lies less often, and tells you not just what is happening but how significant it actually is.
This is not a MACD with extra features stacked on top. It is a MACD built the right way from the foundation up.
________________________________________
Who It's Built For
ATC MACD Evolved is built for the active retail trader who already knows what MACD is, has probably used it before, and has run into its most common frustrations — late crossovers, noisy histogram readings, and signal lines that lag at the worst possible moment. If you have ever watched a MACD crossover fire and then immediately reverse, this indicator was built in response to exactly that experience.
________________________________________
Core Concept
MACD measures the distance between two exponential moving averages of price — a faster one (default 12 periods) and a slower one (default 26 periods). When the fast EMA pulls ahead of the slow EMA, momentum is building. When it falls behind, momentum is fading. The gap between the two is the MACD line. The signal line smooths that gap to make crossovers more readable. The histogram is the gap between the MACD line and the signal line — it expands when momentum is accelerating and compresses when it is slowing.
That is the retail MACD. It works. But it has three structural problems. The signal line uses EMA smoothing, which lags and causes late crossovers. The histogram has no scale reference, so you cannot tell whether a reading is large or small for the instrument you are trading. And the divergence logic, when it exists at all in retail tools, is not filtered — it fires constantly and most of those signals are noise.
ATC MACD Evolved solves all three.
________________________________________
The Upgrades
HMA Signal Line
The signal line is replaced with a Hull Moving Average of the same default length. HMA is specifically designed to reduce lag while maintaining smoothness. In practice this means crossovers occur closer to the actual momentum shift rather than well after it has already occurred. The MACD line itself remains a standard EMA-based calculation — the HMA is applied only to the signal line, which is the part of the system most responsible for late signals.
Standard-Deviation-Normalized Histogram
Every histogram print is measured against the instrument's own historical standard deviation over the last 200 bars. This produces a normalized strength score — call it the histogram Z-score — that tells you objectively whether the current histogram reading is strong, moderate, or weak relative to what this instrument normally produces at this timeframe. A histogram bar that looks big might actually be ordinary. A histogram bar that looks small might be historically significant. The normalization removes that ambiguity.
The histogram is then rendered in one of eight visual states based on direction, strength, and whether momentum is accelerating or fading. Strong bullish prints glow at full opacity. Weak prints render faded. Fading momentum mid-trend is visually distinct from genuine weakness. You can read the state of momentum at a glance without needing to interpret numbers.
Conservative Pivot-Confirmed Divergence Engine
Divergence is off by default. When enabled, it does not fire on every wiggle. It requires confirmed price pivots — actual swing highs and lows — before comparing histogram behavior at those pivots. The pivot confirmation is hard: the engine waits for the required number of bars on both sides of the pivot to confirm before flagging anything. It also enforces minimum and maximum bar separation between pivots, rejecting micro-divergences that form on adjacent bars and stale divergences where the pivots are too far apart to be meaningful. There is also an optional same-side-of-zero filter, which requires both histogram pivots to be on the same side of the zero line — bear divergence requires both readings above zero, bull divergence requires both below. This filter alone eliminates a large category of false divergence signals that retail tools produce constantly.
________________________________________
Chart Visuals
MACD Line — Electric Blue The core momentum line. Tracks the spread between the fast and slow EMA.
Signal Line — Gold The HMA-smoothed signal. Crossovers between the MACD line and signal line are primary signals.
Histogram Columns The gap between the MACD line and signal line, rendered in color-coded columns with a visual scale multiplier applied for readability (default 1.75x). This multiplier is display-only and does not affect any calculations, alerts, or HUD values. The columns use eight visual states driven by direction, normalized strength, and slope:
• Bright green, full opacity — bullish, accelerating, strong
• Green, slightly faded — bullish, accelerating, moderate strength
• Green, heavily faded — bullish but statistically weak (watch for stall)
• Green, partial fade — bullish but decelerating (momentum losing steam)
• Bright red, full opacity — bearish, accelerating, strong
• Red, slightly faded — bearish, accelerating, moderate
• Red, heavily faded — bearish but weak (bear pressure fading)
• Red, partial fade — bearish but decelerating (recovery building)
MACD / Signal Cloud A filled region between the MACD line and signal line that changes color and opacity based on the combined state of both lines relative to each other and to the zero line. Darker and more saturated when both are on the same side and in agreement. Lighter and more transparent during transitional phases.
Momentum Background A subtle background tint across the full panel — green when MACD is above signal, red when below. The tint is stronger when the MACD line is also above zero (bull control) and lighter when it is below (recovery or transition). This gives you an immediate panel-level read on regime without needing to look at individual lines.
Zero-Line Glow The zero line is rendered with a colored glow that reflects the current histogram direction — green when histogram is positive, red when negative. This provides a subtle but consistent reference point for zero-line crossover events.
Crossover Dots At every signal-line crossover, a dot and surrounding glow appear on the MACD line. The glow renders first so the sharp dot remains visually dominant. Bull crossovers are green, bear crossovers are red.
Divergence Labels (optional) When divergence is enabled and a confirmed pivot-to-pivot divergence is detected, a BULL DIV or BEAR DIV label appears on the histogram at the pivot bar. Labels are placed on the visually scaled histogram so they align with the displayed columns.
________________________________________
The HUD
The HUD is a live data panel rendered in the corner of the indicator panel. It updates on every bar close and gives you a structured summary of the indicator's current state without needing to read individual lines and columns manually.
MACD — The raw MACD line value at four decimal places.
Signal — The HMA signal line value at four decimal places.
Hist Strength — The normalized Z-score of the current histogram print. Positive values indicate bullish histogram, negative bearish. The magnitude tells you how significant the print is relative to this instrument's normal range. A value above +1.5 or below -1.5 is statistically strong.
Strength — A plain-language classification of the Z-score reading: Strong, Moderate, or Weak. Strong means the current histogram print is beyond 1.5 standard deviations from zero. Moderate is between 0.5 and 1.5. Weak is below 0.5 and is the zone where momentum signals should be treated with caution.
State — A four-state momentum classification based on the position of the MACD line relative to signal and relative to zero:
• Bull Control — MACD above signal AND above zero. Full bullish regime.
• Bull Recovery — MACD above signal but below zero. Recovering from bearish territory.
• Bear Pressure — MACD below signal but above zero. Weakening from bullish territory.
• Bear Control — MACD below signal AND below zero. Full bearish regime.
Divergence — When the divergence engine is enabled, this field shows the current status: Watching (monitoring for pivots), Bull Div @ Pivot (confirmed bullish divergence at last pivot), or Bear Div @ Pivot (confirmed bearish divergence at last pivot). When the engine is off, this field shows Off.
Hist Visual — The current histogram visual scale multiplier. Displayed as a reminder that the histogram is scaled for readability only. All calculations use the true unscaled histogram values.
________________________________________
Alerts
ATC MACD Evolved includes eight configurable alert conditions:
MACD Bull Cross — Fires when the MACD line crosses above the HMA signal line.
MACD Bear Cross — Fires when the MACD line crosses below the HMA signal line.
MACD Zero Cross Up — Fires when the MACD line crosses above the zero line.
MACD Zero Cross Down — Fires when the MACD line crosses below the zero line.
Strong Bull Histogram — Fires on the first bar where the normalized histogram strength enters the strong zone on the positive side. This is a momentum acceleration alert, not a crossover.
Strong Bear Histogram — Fires on the first bar where normalized histogram strength enters the strong zone on the negative side.
Bear Divergence — Fires when the divergence engine confirms a bearish pivot-to-pivot divergence. Requires divergence to be enabled in settings.
Bull Divergence — Fires when the divergence engine confirms a bullish pivot-to-pivot divergence. Requires divergence to be enabled in settings.
________________________________________
How to Trade With ATC MACD Evolved
ATC MACD Evolved is a momentum and trend-following tool. It measures momentum quality, not price targets. Use it to confirm conditions that support entry, to gauge how much conviction exists behind a move, and to identify early signs of momentum exhaustion before a reversal becomes obvious.
Step 1 — Read the State first
Before looking at any crossover or histogram reading, check the HUD State field. Bull Control and Bear Control are the regimes where signals from this indicator carry the most weight. Bull Recovery and Bear Pressure are transitional — signals are valid but require more supporting evidence from price action or other tools.
Step 2 — Read the Histogram Strength
Check the Strength field in the HUD. A Strong reading means the histogram print is statistically significant for this instrument. A Weak reading means momentum is not confirmed — crossovers in weak histogram territory are lower conviction and should be weighted accordingly. Do not trade crossovers in Weak zones the same way you trade them in Strong zones.
Step 3 — Confirm the crossover
When the MACD line crosses the HMA signal line, a crossover dot and glow appear on the chart. The most reliable crossovers occur when the histogram is transitioning from a faded state (decelerating) to an accelerating state on the opposite side — you will see the histogram columns shift from a partial-opacity color to a full-opacity color in the new direction. Crossovers that occur with immediately Strong normalized readings are the cleanest setups.
Step 4 — Check the zero-line position
A bullish crossover above the zero line (Bull Control state) is generally stronger than one below zero (Bull Recovery). Both are valid, but the zero-line position tells you whether you are trading with the prevailing macro momentum or against it. Trade Bull Control crossovers with more size or fewer confirmations required. Trade Bull Recovery crossovers as potential turning-point setups that still need price structure support.
Step 5 — Use zero-line crossovers as trend confirmation
When the MACD line itself crosses the zero line, it marks a shift in the medium-term trend relationship between the fast and slow EMAs. Zero cross up, combined with a MACD-above-signal condition, is a two-layer confirmation of a building trend. Zero cross alerts are most useful as trend-start confirmation rather than entry triggers on their own.
Step 6 — If divergence is enabled, treat it as a caution flag
A divergence label on ATC MACD Evolved is not a buy or sell signal. It is a structural warning. Bearish divergence — price making a higher high while the histogram makes a lower high — means upside momentum is not confirming price action. This creates a fragile structure. Bullish divergence is the mirror: price making a lower low while histogram makes a higher low, indicating selling pressure is not accelerating with price. In both cases, wait for a crossover or a failed new extreme in price to act on the divergence flag.
Step 7 — Watch the histogram fade for exits
When you are in a trade and the histogram shifts from a Strong or Moderate state to a Weak state — visible as the column opacity dropping and the Strength field reading Weak — that is a warning that momentum is stalling. It is not an exit trigger by itself, but it is a cue to tighten your stop or reduce exposure. When the histogram then begins fading (decelerating) in the current direction, watch for a crossover as confirmation of a regime shift.
________________________________________
Recommended Instruments and Timeframes
ATC MACD Evolved is validated and performs well on liquid instruments with consistent volume profiles. Futures markets including ES, NQ, MES, MNQ, CL, and GC are the primary intended instruments. It is equally well-suited to major equity ETFs such as SPY and QQQ, and to major forex pairs including EURUSD, GBPUSD, and USDJPY. The normalization engine adapts to the volatility characteristics of each instrument, so the same threshold settings can be used across markets without manual adjustment.
Recommended timeframes are 5-minute through 4-hour for active trading and 1-hour through Daily for trend context and confirmation. The 200-bar normalization lookback is calibrated for these timeframes. On very short timeframes below 5 minutes, consider increasing the normalization lookback to maintain statistical stability. On weekly or monthly charts, the tool still functions correctly but is better used as a macro context layer than an entry trigger.
Gösterge

Swing + Value Setup [Marcos]Swing + Value Setup — Descripción para TradingView
Título sugerido
Swing + Value Setup — Multi-Filter Entry Signal
Descripción (inglés — recomendado para mayor alcance)
🎯 What is this indicator?
Swing + Value Setup is a multi-condition entry filter designed for swing traders looking for high-quality setups in stocks with strong technical and structural foundations. Instead of relying on a single signal, this indicator requires 6 simultaneous conditions to be met before printing an entry label — dramatically reducing false signals and noise.
It also features a real-time status panel that shows exactly which conditions are passing or failing on any given bar, so you always know how close a setup is to triggering.
⚙️ How it works
The indicator combines trend, momentum, volume, and structure analysis into a single unified signal:
✅ 6 Required Conditions (all must be true simultaneously):
Price above EMA 200 — confirms the stock is in a long-term uptrend
Supertrend bullish — active trend filter, eliminates choppy/sideways markets
RSI between 40–55 — entry during healthy pullback, not extreme oversold
MACD signal — bullish crossover OR histogram rising below zero (momentum recovering)
OBV above its EMA — confirms institutional accumulation behind the move
Pullback to EMA 21 or EMA 50 (±1.5%) — optimal entry zone, not chasing price
⭐ High Conviction Bonus:
When a bullish RSI divergence is also detected (price making lower lows while RSI makes higher lows), the label upgrades to a High Conviction signal — historically the strongest setups.
📊 Visual elements
EMA 21 / 50 / 200 plotted directly on price
Supertrend line changes color with trend direction
Green background shading when a valid setup is active
Brighter shading for high conviction entries
Labels printed at signal candles (standard ✅ or high conviction 🎯)
Status table (top-right corner) showing live ✅/❌ for each condition
🔔 Built-in Alerts (3 total)
AlertTriggerSetup Swing/ValueAll 6 conditions met for the first timeSetup ALTA CONVICCIÓN ⭐Full setup + RSI divergence confirmedDivergencia RSI BullishBullish divergence in uptrend (early warning)
Set alerts from the indicator menu → Add Alert → select the condition.
🕐 Recommended Timeframes
TimeframePurposeWeeklyOverall bias and macro structureDailyPrimary signal timeframe (recommended)4H / 1HEntry timing and fine-tuning
Best results on Daily charts for swing positions of 5–30 days.
📐 Trade Management (suggested)
Stop Loss: Below the signal candle low or EMA 50
Target 1: Prior resistance / VPVR high-volume node
Target 2: Fibonacci 1.272 or 1.618 extension
Minimum R:R: 1:2.5
⚠️ Disclaimer
This indicator is a technical analysis tool only. It does not constitute financial advice. Always manage your risk, use stop losses, and do your own research before entering any trade. Past performance of any indicator does not guarantee future results.
Descripción (español — versión alternativa)
🎯 ¿Qué es este indicador?
Swing + Value Setup es un filtro de entrada multi-condición diseñado para swing traders que buscan setups de alta calidad en acciones con estructura técnica sólida. En lugar de depender de una sola señal, el indicador exige que 6 condiciones se cumplan simultáneamente antes de generar una señal — reduciendo drásticamente las falsas entradas y el ruido del mercado.
Incluye un panel de estado en tiempo real que muestra exactamente qué condiciones están activas o fallando en cualquier vela, para que siempre sepas qué tan cerca está un setup de activarse.
⚙️ Cómo funciona
✅ 6 Condiciones obligatorias (todas deben cumplirse a la vez):
Precio sobre EMA 200 — confirma tendencia alcista de largo plazo
Supertrend alcista — filtra mercados laterales y tendencias bajistas
RSI entre 40 y 55 — entrada en pullback sano, sin sobreventa extrema
Señal MACD — cruce alcista O histograma subiendo bajo cero
OBV sobre su media — confirma acumulación institucional detrás del movimiento
Pullback a EMA 21 o EMA 50 (±1.5%) — zona de entrada óptima sin perseguir precio
⭐ Bonus Alta Convicción:
Cuando además se detecta una divergencia bullish en RSI (precio haciendo mínimos más bajos mientras el RSI hace mínimos más altos), la señal se convierte en Alta Convicción — históricamente los setups más fuertes.
🔔 Alertas incluidas
Setup Swing/Value — cuando se cumplen las 6 condiciones
Setup Alta Convicción ⭐ — setup completo + divergencia RSI
Divergencia RSI Bullish — aviso temprano de posible giro
⚠️ Aviso legal
Este indicador es únicamente una herramienta de análisis técnico. No constituye asesoramiento financiero. Gestiona siempre tu riesgo y realiza tu propio análisis antes de operar.
swing trading value ema supertrend rsi macd obv multi-condition stocks entry signal divergence trend following pullback screener alerts Gösterge

Alien The Bayesian Follower [by Oberlunar] Alien The Bayesian Follower 👁⭐
— Bayesian Gating Filter by Oberlunar
Alien The Bayesian Follower by Oberlunar is a permission layer for execution engines. At its core sits a conjugate Bayesian update that continuously revises the expected edge of each trading cell as live evidence accumulates, and automatically disables cells whose edge has decayed. Empirically, for most of the time, when a long/short gate is active, the price goes in the opposite direction or straight in the trend. Use it at 30 m, with lower TF at 15 m and trade on pullbacks.
The state space is built by crossing three fixed methodologies: a 5-class daily Regime Classifier built on Kaufman Efficiency Ratio, lag-1 autocorrelation of returns, and ATR ratio; a Dragon momentum composite aggregating EMA, RSI, MACD, and TRIX into 5 buckets; and a Pulsar flow composite aggregating OBV, CVD, and price-vs-flow divergences into 5 buckets. The full 5×5 Dragon × Pulsar grid is evaluated only inside the MIXED regime, where four specific bucket combinations carry a statistically significant edge after Bonferroni correction across all 25 cells.
The four surviving cells correspond to two long setups and two short setups. The strongest long edge sits at the intersection of strong bullish momentum and still-neutral flow — the pre-alignment phase where price has turned but order flow hasn't fully confirmed. Full alignment between momentum and flow tends to mark exhaustion. The same asymmetry holds in reverse for the short cells.
Each surviving cell carries a Normal prior representing its expected edge and the uncertainty around it. The Bayesian engine is the heart of the indicator: as the script runs, every walk-forward observation matching a cell updates that cell's prior through a conjugate Normal-Normal step, producing a posterior that shrinks prior and live evidence together via precision weighting. When live samples are few, the posterior stays close to the prior, and the cell relies on its original estimate. When live samples accumulate, the posterior tracks reality and the original prior fades.
Each cell is then assigned a status based on its posterior credible interval. **BORN** means not enough live data yet. **OK** means the credible interval excludes zero with the expected sign and the magnitude remains close to the prior. **DRIFT** means the sign is still correct, but the edge has weakened substantially. **DEAD** means the credible interval includes zero, or the sign has inverted — the cell has lost its edge and is automatically blocked from firing. This is the core defensive feature: strategies decay, and when one of the four cells decays, the Bayesian engine stops trusting it without any manual intervention.
Alerts in strict mode restrict firing to primary cells only (±2).
Permissive mode allows secondary cells (±1) as well.
The dashboard shows the live state of all four cells side by side: prior, posterior with credible interval, sample count, and status. Everything else — the cyberpunk palette, the segmented trend wedges in stay-out zones, the optional alien mascot rotating to follow the local trend — is visual feedback layered on top of the same Bayesian rule.
Enjoy,
By Oberlunar 👁⭐ Gösterge

Momentum Composite Oscillator (MCO)Momentum Composite Oscillator (MCO)
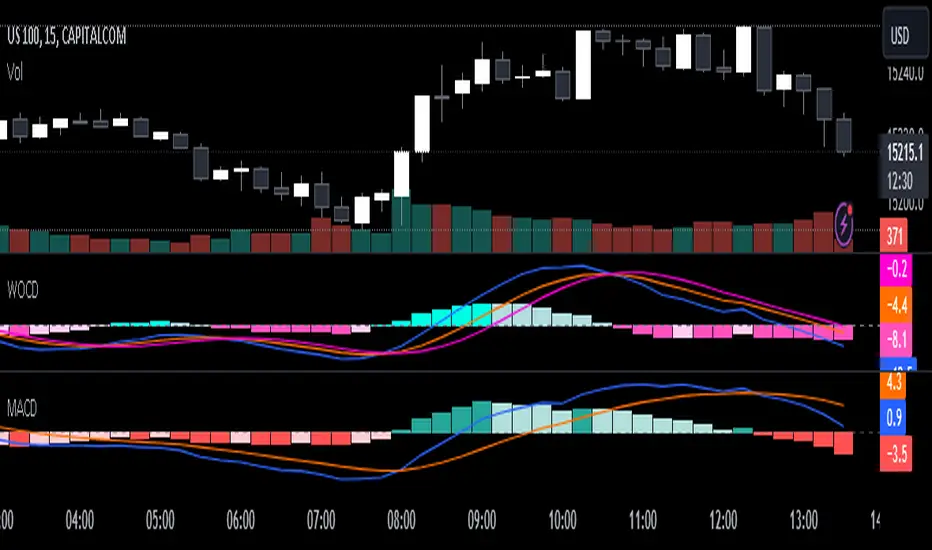
The Momentum Composite Oscillator (MCO) is a multi-factor momentum indicator that combines several widely used momentum metrics into a single normalized oscillator.
The script integrates RSI, MACD momentum, and Rate of Change (ROC) into a weighted composite that is scaled to a 0–100 range. This approach allows different momentum signals to be viewed together in a unified framework.
Core Features
• Composite Momentum Line – Represents the combined momentum reading from multiple indicators
• Signal Line – A smoothed reference line used to highlight shifts in momentum
• Momentum Histogram – Displays the spread between the composite and signal lines
• Momentum Zones – Configurable upper, mid, and lower levels help visualize different momentum regimes
• Cross Markers: Bull cross: Blue Dots, Bear Cross: Orange Dots – Highlight early momentum shifts when the composite crosses the signal line
• Confirmation Markers – Optional follow-through markers that trigger when momentum confirms above or below upper or lower thresholds which may signal major momentum reversals. Bull Confirmation: Green triangles, Bear Confirmations: Red Triangles
• Adaptive Signal Option – Adjusts signal smoothing based on recent volatility
How It Works
The indicator combines three momentum components:
RSI – Measures the relative strength of price movements
MACD momentum – Captures changes in trend acceleration
Rate of Change (ROC) – Measures the speed of price movement
Each component is normalized using a rolling range so they operate on the same scale. Adjustable weights allow users to emphasize different momentum inputs depending on their analytical preference.
The resulting composite can optionally be smoothed to reduce short-term noise while maintaining responsiveness.
Basic Interpretation
When the composite moves above the midline, momentum conditions are generally strengthening.
When the composite moves below the midline, momentum conditions are generally weakening.
Crossovers between the composite and signal line can highlight changes in momentum direction.
The histogram reflects the distance between momentum and its signal, helping visualize acceleration or deceleration.
Customization
The indicator includes several adjustable settings:
Component weights for RSI, MACD, and ROC
Momentum zone levels
Composite smoothing
Adaptive or fixed signal modes
Signal confirmation settings
Visual display options for signals, histogram, and background regimes
Notes
This indicator is designed as a momentum analysis and visualization tool and can be applied to any market or timeframe.
Disclaimer:
This script is intended for informational and analytical purposes only and does not constitute financial advice.
Note: In the chart above I have the MCO configured to custom 2 week Bitcoin settings.
Normalization look back: 50
Composite smoothing length: 12
Weights;
RSI: 1
MACD: 1.5
ROC: 0.3
Signal look back: 5
Confirmation Max: 14
Gösterge

Divergence Constellation [JOAT]Divergence Constellation
Introduction
The Divergence Constellation is an advanced open-source multi-oscillator divergence detection system that combines RSI, MACD, TSI, and Stochastic analysis with sophisticated pivot detection and confluence scoring. This indicator identifies both regular and hidden divergences across multiple oscillators simultaneously, creating a constellation of divergence signals that reveal potential reversals and trend continuations with high probability.
Unlike single-oscillator divergence tools, the Divergence Constellation provides multi-dimensional divergence analysis through composite oscillator calculation, four-oscillator confluence scoring, regular and hidden divergence detection, and chart projection. The indicator is designed for traders who understand that divergences confirmed across multiple oscillators provide significantly higher probability setups than single-oscillator divergences.
Why This Indicator Exists
This indicator addresses the need for systematic multi-oscillator divergence analysis. By combining four distinct oscillators with confluence scoring, it reveals:
Regular Bullish Divergence: Price makes lower low, oscillators make higher low (reversal up signal)
Regular Bearish Divergence: Price makes higher high, oscillators make lower high (reversal down signal)
Hidden Bullish Divergence: Price makes higher low, oscillators make lower low (trend continuation up)
Hidden Bearish Divergence: Price makes lower high, oscillators make higher high (trend continuation down)
Confluence Scoring: Counts how many oscillators confirm the divergence (1-4 score)
Composite Oscillator: Unified oscillator combining all four components
Chart Projection: Divergence lines drawn on both oscillator pane and main chart
Core Components Explained
1. Four-Oscillator System
The indicator calculates four distinct oscillators, each providing unique momentum perspective:
RSI (Relative Strength Index):
Measures momentum by comparing average gains to average losses
Zero-centered (subtracts 50) for composite integration
Sensitive to overbought/oversold conditions
Default period: 14
MACD (Moving Average Convergence Divergence):
Measures relationship between two exponential moving averages
Histogram shows momentum acceleration/deceleration
Responsive to trend changes
Default periods: 12, 26, 9
TSI (True Strength Index):
Double-smoothed momentum indicator
Filters noise while preserving trend direction
Excellent for divergence detection
Default periods: 25, 13
Stochastic:
Compares close to recent high-low range
Zero-centered (subtracts 50) for composite integration
Identifies overbought/oversold extremes
Default periods: 14, 3
2. Composite Oscillator Calculation
All four oscillators are combined into a unified composite:
Composite = (RSI + MACD + TSI + Stochastic) / 4
This composite oscillator provides a balanced view of momentum across all four methodologies. Divergences are detected on the composite, then confirmed by checking individual oscillators.
3. Pivot Detection System
The indicator uses sophisticated pivot detection to identify divergence points:
Pivot Left/Right: Number of bars on each side for pivot confirmation (default: 5)
Price Pivots: Identifies swing highs and lows in price
Oscillator Pivots: Identifies swing highs and lows in each oscillator
Lookback Range: Min (5) to Max (60) bars for comparing pivots
Pivots must be confirmed (bars on both sides) before divergence analysis begins.
4. Regular Divergence Detection
Regular divergences signal potential reversals:
Regular Bullish Divergence:
Price makes lower low (current pivot low < previous pivot low)
Composite oscillator makes higher low (current pivot low > previous pivot low)
Indicates weakening downward momentum - potential reversal up
Best at oversold levels (composite < -20)
Regular Bearish Divergence:
Price makes higher high (current pivot high > previous pivot high)
Composite oscillator makes lower high (current pivot high < previous pivot high)
Indicates weakening upward momentum - potential reversal down
Best at overbought levels (composite > 20)
5. Hidden Divergence Detection
Hidden divergences signal trend continuation:
Hidden Bullish Divergence:
Price makes higher low (current pivot low > previous pivot low)
Composite oscillator makes lower low (current pivot low < previous pivot low)
Indicates strong underlying bullish momentum - trend continuation up
Confirms uptrend strength
Hidden Bearish Divergence:
Price makes lower high (current pivot high < previous pivot high)
Composite oscillator makes higher high (current pivot high > previous pivot high)
Indicates strong underlying bearish momentum - trend continuation down
Confirms downtrend strength
6. Confluence Scoring System
When a divergence is detected on the composite, the indicator checks all four individual oscillators:
Score 1/4: Only one oscillator confirms - weak divergence
Score 2/4: Two oscillators confirm - moderate divergence (minimum for signals)
Score 3/4: Three oscillators confirm - strong divergence
Score 4/4: All four oscillators confirm - extreme divergence (highest probability)
The minimum confluence score (default 2) filters out weak divergences that lack multi-oscillator confirmation.
7. Signal Generation Logic
Signals are generated only at extreme oscillator levels with anti-overlap logic:
Bullish Signals:
Regular bullish divergence detected
Composite oscillator < -20 (oversold)
Confluence score >= minimum (default 2)
At least 20 bars since last bullish signal (anti-overlap)
Bearish Signals:
Regular bearish divergence detected
Composite oscillator > 20 (overbought)
Confluence score >= minimum (default 2)
At least 20 bars since last bearish signal (anti-overlap)
Extreme Signals:
Confluence score = 4/4 (all oscillators confirm)
Composite at extreme levels (< -30 or > 30)
Displayed as diamond shapes for emphasis
8. Visual Divergence Lines
Divergence lines are drawn connecting pivot points:
Regular Divergences: Solid lines (green = bullish, red = bearish)
Hidden Divergences: Dashed lines (cyan = bullish, orange = bearish)
Oscillator Pane: Lines drawn on composite oscillator
Chart Projection: Lines also drawn on main price chart (optional)
Lines provide visual confirmation of the divergence pattern and help identify the exact pivot points involved.
Visual Elements
Four Oscillator Lines: Thick colored lines showing RSI (cyan), MACD (magenta), TSI (yellow), and Stochastic (green)
Composite Line: White line showing unified oscillator
Zero Line: Gray horizontal line at zero
Overbought/Oversold Zones: Shaded areas at +30/-30 levels
Divergence Lines: Solid/dashed lines connecting pivot points
Signal Triangles: Small triangles at signal generation points
Extreme Diamonds: Larger diamonds for 4/4 confluence signals
Information Dashboard: Displays composite position, confluence score, RSI/MACD/TSI/Stochastic status, composite value, divergence types, signal strength, extreme events, and overall verdict
How to Use This Indicator
Step 1: Monitor Composite Position
Check if composite oscillator is at extreme levels (> 30 overbought, < -30 oversold). Divergences at extremes have highest probability.
Step 2: Check Confluence Score
Look for confluence scores of 3/4 or 4/4. Higher scores indicate stronger divergence confirmation across multiple oscillators.
Step 3: Identify Divergence Type
Regular divergences signal reversals, hidden divergences signal trend continuation. Trade accordingly.
Step 4: Wait for Signal Confirmation
Don't trade divergence lines alone. Wait for signal triangles that confirm divergence meets all criteria (extreme level, confluence, anti-overlap).
Step 5: Look for Extreme Events
Diamond shapes indicate 4/4 confluence at extreme levels - highest probability setups.
Step 6: Confirm with Price Action
Use divergence signals as alerts, then confirm with price action, support/resistance, or other indicators before entering.
Step 7: Check Individual Oscillators
Dashboard shows status of each oscillator. All four overbought/oversold provides additional confirmation.
Best Practices
Trade only divergences with confluence score >= 2 (default minimum)
Focus on regular divergences at extreme levels (< -30 or > 30) for reversals
Use hidden divergences to confirm trend continuation, not as standalone entries
Wait for signal triangles - don't front-run divergence lines
4/4 confluence signals (diamonds) offer highest probability setups
Combine with support/resistance levels for additional confirmation
Avoid divergences in middle range (-20 to +20) - wait for extremes
Use higher timeframe divergences for stronger significance
Input Parameters
Pivot Detection:
Pivot Left: Bars to left of pivot (default: 5)
Pivot Right: Bars to right of pivot (default: 5)
Max Lookback: Maximum bars to compare pivots (default: 60)
Min Lookback: Minimum bars to compare pivots (default: 5)
Oscillator Configuration:
RSI Length: Period for RSI (default: 14)
MACD Fast: Fast EMA period (default: 12)
MACD Slow: Slow EMA period (default: 26)
MACD Signal: Signal line period (default: 9)
TSI Long: Long smoothing period (default: 25)
TSI Short: Short smoothing period (default: 13)
Stochastic K: K period (default: 14)
Stochastic D: D smoothing (default: 3)
Divergence Rules:
Show Regular Divergence: Toggle regular divergence detection (default: enabled)
Show Hidden Divergence: Toggle hidden divergence detection (default: enabled)
Min Confluence Score: Minimum oscillators that must confirm (default: 2)
Project on Chart: Draw divergence lines on main chart (default: enabled)
Visual Configuration:
Bullish/Bearish Divergence Colors: Colors for regular divergences
Hidden Bullish/Bearish Colors: Colors for hidden divergences
Originality Statement
This indicator is original in its multi-oscillator confluence approach. While individual oscillators and divergence concepts are established, this indicator is justified because:
It combines four distinct oscillators into a unified composite system
The confluence scoring system measures divergence strength across multiple oscillators
Automatic detection of both regular and hidden divergences with pivot analysis
Signal generation includes extreme level filtering and anti-overlap logic
Chart projection allows divergence visualization on both oscillator and price chart
The comprehensive dashboard presents all oscillator states and divergence metrics simultaneously
Integration of multiple oscillator perspectives creates higher probability divergence signals
Disclaimer
This indicator is provided for educational and informational purposes only. It is not financial advice. Trading involves substantial risk of loss. Divergence analysis does not guarantee profitable trades or reversals. Past divergences do not guarantee future results. Always use proper risk management and never risk more than you can afford to lose.
-Made with passion by officialjackofalltrades Gösterge

Gösterge

Oscillator Confluence Tracker [JOAT]Oscillator Confluence Tracker
Introduction
The Oscillator Confluence Tracker is an advanced open-source multi-oscillator divergence detection indicator that combines RSI divergence analysis, MACD momentum tracking, Stochastic extreme identification, volume divergence detection, and pattern recognition into a unified smart money divergence system. This indicator helps traders identify when price and momentum are moving in opposite directions - a powerful signal that the current trend is losing strength and a reversal may be imminent.
Unlike basic oscillator indicators that simply show overbought/oversold levels, this system detects divergences across multiple oscillators simultaneously and quantifies confluence. Regular divergences signal potential reversals, hidden divergences signal trend continuation, and multi-oscillator confluence provides the highest probability setups. The indicator is designed for traders who understand that divergences reveal institutional positioning changes before they're visible in price action.
Why This Indicator Exists
This indicator addresses a critical challenge in divergence trading: single oscillator divergences produce many false signals. By combining multiple oscillators and requiring confluence, this indicator reveals:
RSI Divergence Detection: Identifies when price makes new highs/lows but RSI doesn't - signals momentum exhaustion
MACD Momentum Analysis: Tracks MACD line and histogram for momentum shifts and crossovers
Stochastic Extreme Zones: Identifies overbought (>80) and oversold (<20) conditions for context
Hidden Divergence Patterns: Detects hidden divergences that signal trend continuation rather than reversal
Volume Divergence: Identifies when price makes new highs/lows on decreasing volume - warns of weak moves
Multi-Oscillator Confluence: Quantifies how many oscillators show divergence simultaneously
Momentum Divergence: Detects when price momentum and oscillator momentum conflict
Each component provides a different lens on momentum. RSI shows relative strength, MACD shows trend momentum, Stochastic shows extremes, volume shows participation, and confluence shows conviction. Together, they create a comprehensive view of smart money divergence.
Core Components Explained
1. Regular Bearish Divergence (Price HH, RSI LH)
Regular bearish divergence occurs when price makes a higher high but RSI makes a lower high - signals uptrend exhaustion:
// Detect pivot highs in both price and RSI
pricePivotHigh = ta.pivothigh(high, 5, 5)
rsiPivotHigh = ta.pivothigh(rsi, 5, 5)
// Compare current pivot to previous pivot
if pricePivotHigh > lastPriceHigh and rsiPivotHigh < lastRsiHigh:
// Bearish divergence detected
drawDivergenceLines()
createDivergenceLabel("BEAR DIV")
The indicator identifies bearish divergence by:
Tracking swing highs in both price and RSI using pivot detection
Comparing current swing high to previous swing high
Confirming price made higher high while RSI made lower high
Drawing solid line on price chart and dashed line on RSI
Creating "BEAR DIV" label at the divergence point
Bearish divergence is most powerful when:
RSI is in overbought zone (>70) - "BEAR DIV EXTREME" label
Multiple oscillators show divergence simultaneously
Volume is decreasing on the higher high
Occurs at resistance or Fibonacci level
2. Regular Bullish Divergence (Price LL, RSI HL)
Regular bullish divergence occurs when price makes a lower low but RSI makes a higher low - signals downtrend exhaustion:
// Detect pivot lows in both price and RSI
pricePivotLow = ta.pivotlow(low, 5, 5)
rsiPivotLow = ta.pivotlow(rsi, 5, 5)
// Compare current pivot to previous pivot
if pricePivotLow < lastPriceLow and rsiPivotLow > lastRsiLow:
// Bullish divergence detected
drawDivergenceLines()
createDivergenceLabel("BULL DIV")
The indicator identifies bullish divergence by:
Tracking swing lows in both price and RSI
Comparing current swing low to previous swing low
Confirming price made lower low while RSI made higher low
Drawing solid line on price chart and dashed line on RSI
Creating "BULL DIV" label at the divergence point
Bullish divergence is most powerful when:
RSI is in oversold zone (<30) - "BULL DIV EXTREME" label
Multiple oscillators show divergence simultaneously
Volume is decreasing on the lower low
Occurs at support or Fibonacci level
3. Hidden Bullish Divergence (Price HL, MACD LL)
Hidden bullish divergence occurs when price makes a higher low but MACD makes a lower low - signals uptrend continuation:
// Price makes higher low (bullish structure)
if pricePivotLow > lastPriceLow and macdPivotLow < lastMacdLow:
// Hidden bullish divergence - trend continuation signal
drawHiddenDivergence("H-BULL")
Hidden divergences are different from regular divergences:
Signal trend continuation, not reversal
Occur during pullbacks in established trends
Show that momentum is building despite price correction
Drawn with dotted lines to distinguish from regular divergence
Labeled "H-BULL" or "H-BEAR" for clarity
Hidden divergences are powerful for:
Entering pullbacks in strong trends
Adding to winning positions
Confirming trend strength
Identifying optimal re-entry points
4. Volume Divergence Detection
Volume divergence occurs when price makes new highs/lows but volume decreases - warns of weak moves:
// Track volume at pivot highs
volPivotHigh = ta.pivothigh(volume, 5, 5)
// Price makes higher high, volume makes lower high
if pricePivotHigh > lastPriceHigh and volPivotHigh < lastVolHigh:
label.new(bar_index, high, "VOL DIV", color=COLOR_VOL_DIV)
Volume divergence reveals:
Decreasing participation in the move
Lack of institutional conviction
Potential exhaustion or trap
Warning that trend may not continue
Volume divergence combined with RSI/MACD divergence creates extremely high-probability reversal setups.
5. Momentum Divergence Analysis
Momentum divergence occurs when price momentum and oscillator momentum move in opposite directions:
rsiMomentum = ta.change(rsi, 5)
macdMomentum = ta.change(macdLine, 5)
priceMomentum = ta.change(close, 5)
// Price momentum positive but RSI momentum negative
momentumDivergence = (priceMomentum > 0 and rsiMomentum < 0) or
(priceMomentum < 0 and rsiMomentum > 0)
Momentum divergence shows:
Acceleration/deceleration conflicts
Early warning of trend changes
Momentum exhaustion before price exhaustion
Institutional positioning shifts
The dashboard displays momentum divergence status (Active/Aligned) with color coding.
6. Multi-Oscillator Confluence Scoring
The indicator quantifies confluence by counting how many oscillators show divergence simultaneously:
confluenceScore = 0
if rsi_divergence:
confluenceScore += 1
if macd_divergence:
confluenceScore += 1
if stochastic_extreme:
confluenceScore += 1
if volume_divergence:
confluenceScore += 1
if momentum_divergence:
confluenceScore += 1
// Classify confluence
confluenceLevel = confluenceScore >= 4 ? "EXTREME BULL/BEAR" :
confluenceScore >= 3 ? "STRONG BULL/BEAR" :
confluenceScore >= 2 ? "MODERATE" : "NONE"
Confluence scoring reveals:
Setup quality (higher score = higher probability)
How many independent signals confirm the divergence
Whether to take the trade (3+ recommended)
Position sizing guidance (higher score = larger size)
The dashboard displays confluence score and classification with color intensity.
7. Enhanced Candlestick Coloring
The indicator colors candles based on trend strength and momentum:
// Determine trend
trendStrength = ta.ema(close, 20)
isBullTrend = close > trendStrength
isBearTrend = close < trendStrength
// Momentum strength
momentumStrong = abs(rsiMomentum) > 5 or abs(macdMomentum) > abs(macdHist) * 0.5
// Color candles
if isBullTrend:
candleColor = momentumStrong ? COLOR_BULL_STRONG : COLOR_BULL_WEAK
else if isBearTrend:
candleColor = momentumStrong ? COLOR_BEAR_STRONG : COLOR_BEAR_WEAK
Candlestick coloring shows:
Bright green: Strong bullish momentum
Light green: Weak bullish momentum
Bright red: Strong bearish momentum
Light red: Weak bearish momentum
This provides instant visual feedback on trend and momentum strength.
Visual Elements
Divergence Lines: Solid lines on price, dashed lines on oscillator connecting pivot points
Divergence Labels: "BULL DIV", "BEAR DIV", "H-BULL", "H-BEAR" at divergence points
Extreme Labels: "BULL DIV EXTREME" or "BEAR DIV EXTREME" in overbought/oversold zones
Volume Labels: "VOL DIV" markers when volume diverges
Divergence Zones: Semi-transparent boxes highlighting divergence areas
Enhanced Candles: Color-coded by trend and momentum strength
Volume Spike Boxes: Gold boxes around high-volume candles
Extreme Zone Backgrounds: Red tint when RSI >70 and Stochastic >80, green tint when RSI <30 and Stochastic <20
Dashboard: Real-time oscillator states and confluence metrics
The dashboard displays 9 key metrics:
1. RSI State (value and Overbought/Oversold/Neutral)
2. MACD Flow (Bullish/Bearish and Strong/Weak)
3. Stochastic (value and Extreme/Normal)
4. Momentum Div (Active/Aligned)
5. Volume Profile (ratio and Spike/Elevated/Low)
6. Trend Strength (Bullish/Bearish and Strong/Weak)
7. Confluence (Extreme/Strong/Moderate/None)
8. Signal Quality (Elite Setup/Strong Setup/Moderate/Weak)
Input Parameters
Oscillator Settings:
RSI Period: Length for RSI calculation (default: 14)
MACD Fast: Fast EMA for MACD (default: 12)
MACD Slow: Slow EMA for MACD (default: 26)
MACD Signal: Signal line period (default: 9)
Stochastic Period: Length for Stochastic calculation (default: 14)
Divergence Detection:
Pivot Detection: Lookback for swing detection (default: 5)
Regular Divergence: Enable/disable regular divergence detection
Hidden Divergence: Enable/disable hidden divergence detection
Multi-Oscillator Confluence: Require multiple oscillators
Extreme Zones Only: Only detect divergences in overbought/oversold
Volume Analysis:
Volume Analysis Period: Length for volume average (default: 20)
Volume Divergence: Enable/disable volume divergence detection
Volume Spike Threshold: Multiplier for spike detection (default: 1.5x)
How to Use This Indicator
Step 1: Monitor RSI State
Check dashboard for RSI level. Divergences in extreme zones (>70 or <30) are most powerful. Wait for extremes for best setups.
Step 2: Watch for Divergence Labels
When "BULL DIV" or "BEAR DIV" labels appear, divergence is detected. "EXTREME" suffix means it's in overbought/oversold - highest probability.
Step 3: Check Confluence Score
Dashboard shows confluence level. "EXTREME" or "STRONG" = multiple oscillators confirming. Only trade 3+ confluence setups.
Step 4: Confirm with Volume
Look for "VOL DIV" labels. Volume divergence + oscillator divergence = very high probability. Volume confirms the divergence.
Step 5: Assess Signal Quality [/b>
Dashboard shows "ELITE SETUP" when momentum divergence + extreme RSI/Stochastic + high confluence. "STRONG SETUP" for good setups. Only trade Elite and Strong.
Step 6: Use Hidden Divergence for Continuation
"H-BULL" or "H-BEAR" labels signal trend continuation. Enter pullbacks in strong trends when hidden divergence appears.
Step 7: Monitor Trend Strength Best Practices
Divergences in extreme zones (RSI >70 or <30) are most reliable
Multi-oscillator confluence (3+) significantly increases win rate
Volume divergence adds powerful confirmation
Hidden divergences are for trend continuation, not reversal
Regular divergences are for reversal, not continuation
Momentum divergence provides early warning before price divergence
Extreme zone backgrounds (red/green tint) show best divergence areas
Enhanced candle colors show when momentum is weakening
Confluence score guides position sizing (higher = larger)
Signal quality in dashboard filters low-probability setups
Indicator Limitations
Divergences can persist for extended periods before reversing
Not all divergences result in reversals - some fail
Strong trends can produce multiple divergences before reversing
Hidden divergences require established trend context
Volume divergence less reliable on low-volume instruments
Pivot detection requires sufficient volatility
Multiple divergences in short period may signal consolidation
The indicator shows momentum conflicts, not guaranteed reversals
Extreme zones can remain extreme longer than expected
Technical Implementation
Built with Pine Script v6 using:
RSI divergence detection with pivot comparison
MACD momentum analysis with histogram tracking
Stochastic extreme zone identification
Volume divergence detection with pivot tracking
Momentum divergence calculations (rate-of-change)
Multi-oscillator confluence scoring system
Enhanced candlestick coloring based on trend and momentum
Volume spike detection with box visualization
Extreme zone background gradients
Real-time dashboard with 9 divergence metrics
The code is fully open-source and can be modified to suit individual trading styles and preferences.
Originality Statement
This indicator is original in its comprehensive divergence integration approach. While individual components (RSI, MACD, Stochastic, volume) are established concepts, this indicator is justified because:
It synthesizes multiple oscillator divergence detection into unified confluence scoring
The multi-oscillator confluence system quantifies setup quality across independent signals
Hidden divergence detection distinguishes continuation from reversal patterns
Volume divergence integration adds participation confirmation layer
Momentum divergence analysis provides early warning system
Enhanced candlestick coloring shows trend and momentum strength visually
Signal quality classification (Elite/Strong/Moderate/Weak) filters setups
Extreme zone backgrounds highlight optimal divergence areas
Real-time dashboard presents 9 metrics simultaneously for holistic divergence analysis
Each component contributes unique information: RSI shows relative strength, MACD shows momentum, Stochastic shows extremes, volume shows participation, momentum shows acceleration, confluence shows conviction, and quality shows probability. The indicator's value lies in presenting these complementary perspectives simultaneously with unified classification and actionable trade signals.
Disclaimer
This indicator is provided for educational and informational purposes only. It is not financial advice or a recommendation to buy or sell any financial instrument. Trading involves substantial risk of loss and is not suitable for all investors.
Divergence analysis is a tool for identifying potential reversals and continuations, not a crystal ball for predicting future price movement. Divergences do not guarantee reversals. Confluence does not guarantee success. Past divergence patterns do not guarantee future divergence patterns. Market conditions change, and strategies that worked historically may not work in the future.
The divergences displayed are analytical constructs based on current market data, not predictions of future price movement. High confluence scores do not guarantee profitable trades. Users must conduct their own analysis and risk assessment before making trading decisions.
Always use proper risk management, including stop losses and position sizing appropriate for your account size and risk tolerance. Never risk more than you can afford to lose. Consider consulting with a qualified financial advisor before making investment decisions.
The author is not responsible for any losses incurred from using this indicator. Users assume full responsibility for all trading decisions made using this tool.
-Made with passion by officialjackofalltrades Gösterge

Integrated Execution System [JOAT]Integrated Execution Strategy System
Introduction
The Integrated Execution Strategy System is a comprehensive open-source trading strategy that combines regime detection, directional bias analysis, momentum filtering, and structural confluence into a unified adaptive trading framework. This strategy is designed for traders who understand that successful trading requires adapting to market conditions and waiting for high-probability setups with multiple layers of confirmation.
Unlike simple strategies that rely on single indicators, this system integrates six distinct analytical layers: Market Regime Classification to avoid unfavorable conditions, Directional Bias Aggregation across multiple timeframes, Momentum Pressure analysis to gauge institutional participation, Structural Analysis for key levels, Volatility Engine for adaptive sizing, and Signal Qualification to ensure only the highest probability setups are taken. The strategy is built on the principle that edges in trading come from the confluence of multiple factors, not from any single signal.
[image [https://www.tradingview.com/x/NTfmwzgw/
Why This Strategy Exists
This strategy addresses the critical challenge most traders face: adapting to changing market conditions. Most strategies work well in specific market regimes but fail when conditions change. This system solves that problem by:
Regime-Adaptive Logic: Automatically detects trending, ranging, and volatile market conditions and adjusts trading behavior accordingly
Multi-Layer Filtering: Requires confluence across trend, momentum, structure, and volume before entering trades
Institutional-Grade Risk Management: Dynamic position sizing, adaptive stops, and multi-target scaling based on market volatility
Multi-Timeframe Alignment: Confirms signals across higher timeframes to trade with the dominant market flow
Pressure and Flow Analysis: Measures buying/selling pressure to detect institutional participation
Structural Confluence: Identifies key swing levels and liquidity zones for optimal entry positioning
Each component addresses a specific aspect of trading: Regime detection tells us WHEN to trade, bias analysis tells us WHICH direction, momentum confirms the STRENGTH, structure provides the LEVEL, volatility determines the SIZE, and qualification ensures the QUALITY of the setup.
Core Components Explained
1. Market Regime Detection
The strategy classifies markets into four distinct regimes using ADX and ATR analysis:
// Regime classification
if vol_ratio >= i_vol_exp and adx < i_adx_trend
regime := 3 // Volatile
else if adx >= i_adx_trend
regime := 1 // Trending
else if vol_ratio <= i_vol_con
regime := 2 // Ranging
Regime types:
Trending (ADX > 25): Strong directional markets with momentum
Ranging (Low volatility, ADX < 25): Sideways markets suitable for range-bound strategies
Volatile (High volatility, ADX < 25): Chaotic markets where trading is reduced or avoided
Neutral: Transition periods between defined regimes
The strategy automatically reduces position sizing and tightens stops in volatile regimes while increasing size and allowing wider stops in trending regimes.
2. Directional Bias Aggregation
Bias is calculated using multiple indicators weighted by their reliability:
// Composite bias calculation
float bias_score = 0.0
if ma_bullish
bias_score += 30
if price_above_structure
bias_score += 20
if close > ma_trend
bias_score += 20
if plus_di > minus_di
bias_score += 30
Bias components:
Moving Average Relationships: Fast/slow MA alignment for trend direction
Price Position: Where price sits relative to key moving averages
ADX Directional Indicators: +DI vs -DI for momentum confirmation
Multi-Timeframe Alignment: Higher timeframe bias for trend confirmation
A bias score above the threshold (default 30) indicates directional conviction worth trading.
3. Momentum Pressure Analysis
Momentum is evaluated through multiple oscillators to ensure entry timing:
// Momentum scoring
int momentum_bull_score = 0
if rsi_bullish
momentum_bull_score += 1
if rsi_momentum_up
momentum_bull_score += 1
if macd_bullish
momentum_bull_score += 1
Momentum filters:
RSI Analysis: Momentum direction and overbought/oversold conditions
MACD Histogram: Trend acceleration and deceleration
Stochastic Oscillator: Entry timing and momentum strength
Volume Confirmation: Above-average volume for signal validity
Only when momentum aligns with directional bias do we consider entries.
4. Structural Market Analysis
Structure identifies key levels where institutions place orders:
// Structure analysis
bool above_swing_low = close > nz(last_swing_low, low)
bool below_swing_high = close < nz(last_swing_high, high)
bool sweep_high = not na(last_swing_high) and high > last_swing_high and close < last_swing_high
bool sweep_low = not na(last_swing_low) and low < last_swing_low and close > last_swing_low
Structural elements:
Swing Points: Key highs and lows that define market structure
Liquidity Sweeps: Price moves beyond swing levels that quickly reverse
Break of Structure: Confirmation of trend changes
Support/Resistance Zones: Areas of high probability reaction
Entries are favored when price aligns with structural levels and sweeps indicate institutional activity.
5. Volatility-Adaptive Risk Management
Risk management dynamically adjusts based on market conditions:
// Adaptive stop multiplier based on regime
float adaptive_stop_mult = i_atr_stop_mult
if i_adapt_stops
if volatile_regime
adaptive_stop_mult := i_atr_stop_mult * i_vol_stop_mult
else if ranging_regime
adaptive_stop_mult := i_atr_stop_mult * 0.85
else if trending_regime
adaptive_stop_mult := i_atr_stop_mult * 1.1
Risk features:
Adaptive Position Sizing: Larger sizes in high-conviction trends, smaller in volatile conditions
Dynamic Stop Losses: Wider in trending markets, tighter in ranging/volatile conditions
Multi-Target Scaling: Partial profits at predefined levels to reduce risk
Trailing Stops: Lock in profits when moves reach predefined thresholds
Volatility-Adjusted Targets: Larger profit targets in high-volatility environments
6. Signal Qualification System
The strategy uses a 14-point qualification system to ensure only high-quality setups:
// Total scores (max 14)
int bull_total = (
(bullish_bias ? 3 : 0) + momentum_bull_score + struct_bull_score + (trending_regime ? 2 : 0) +
(pressure_bull ? 1 : 0) + (sweep_low ? 1 : 0) + (squeeze_release ? 1 : 0) + (mtf_bias_long ? 1 : 0)
)
Qualification criteria:
Bias Strength (3 points): Strong directional conviction
Momentum (3 points): Multiple momentum indicators aligned
Structure (2 points): Price respecting key levels
Regime (2 points): Favorable market conditions
Pressure (1 point): Buying/selling pressure confirmation
Sweeps (1 point): Liquidity sweep patterns
Squeeze Release (1 point): Volatility breakout patterns
MTF Alignment (1 point): Higher timeframe confirmation
Only setups scoring 5+ (adjustable) are considered for trading.
Visual Elements
Directional Cloud: Dynamic cloud showing trend direction and strength
Signal Markers: Clear entry signals with quality grades (A-D)
Risk Levels: Visual stop loss and target levels
Structure Points: Marked swing highs and lows
Background Colors: Regime-based background shading
Dashboard: Real-time metrics including regime, bias, momentum, and signal quality
The dashboard displays:
1. Current market regime and strength
2. Directional bias score and alignment
3. Momentum state and pressure readings
4. Structural analysis and proximity to levels
5. Signal qualification score and grade
6. Active position sizing and risk metrics
7. Multi-timeframe alignment status
Input Parameters
Regime Detection:
ADX Period: Trend strength calculation period (default: 14)
Trend Threshold: Minimum ADX for trend regime (default: 25)
ATR Period: Volatility calculation period (default: 14)
Volatility Expansion/Contraction: Multipliers for regime detection (default: 1.4/0.6)
Bias Calculation:
Fast/Slow/Anchor MAs: Trend calculation periods (default: 21/55/200)
Bias Threshold: Minimum score for directional bias (default: 30)
Multi-Timeframe Settings: Higher timeframes for confirmation (default: 60m/240m/1D)
Risk Management:
Risk Per Trade %: Percentage of equity to risk (default: 1.0%)
ATR Stop Multiplier: Stop distance in ATR units (default: 2.0)
R:R Targets: Profit target multiples (default: 1.5x/2.5x)
Adaptive Sizing: Enable regime-based position sizing (default: true)
Signal Filters:
Minimum Qualification Score: Required confluence score (default: 5)
Signal Cooldown: Bars between signals (default: 1)
Volume Filter: Require above-average volume (default: true)
Bar Confirmation: Wait for bar close (default: true)
How to Use This Strategy
Step 1: Understand Market Regime
Check the dashboard for current market regime. Avoid trading in volatile regimes (red background) unless you have specific volatility-based strategies. Trending regimes (green) are optimal for directional trading, while ranging regimes (purple) suit mean-reversion approaches.
Step 2: Assess Directional Bias
Look for strong bias scores (60+) with multi-timeframe alignment. The bias should be clear across multiple timeframes before considering entries. Weak or conflicting bias suggests waiting for clarity.
Step 3: Confirm Momentum
Ensure momentum indicators support the directional bias. Look for RSI momentum in the direction of the trade, MACD histogram expanding, and stochastic crossovers aligned with the bias.
Step 4: Identify Structural Levels
Entries near structural levels (swing highs/lows) have higher probability. Look for liquidity sweeps that indicate institutional participation before entering in the opposite direction.
Step 5: Check Signal Qualification
Only take trades with qualification scores of 5 or higher. Premium signals (grade A, 75+ quality) offer the highest probability and can be sized more aggressively.
Step 6: Manage Risk Dynamically
Let the strategy's adaptive risk management adjust position sizes and stops based on market conditions. Don't override the system's risk calculations without strong reason.
Best Practices
Trade liquid instruments (major forex pairs, indices, large-cap stocks, major crypto) for reliable signals
Start with the default parameters and only adjust after understanding their impact
Pay attention to regime changes - they often signal strategy adjustments
Use the qualification score as your primary filter - higher scores mean higher probability
Be patient for A-grade setups rather than forcing mediocre trades
Monitor the multi-timeframe alignment - trades against higher timeframes have lower success rates
Let winners run to the second target when momentum is strong
Reduce size during volatile regimes or take a break entirely
Keep a trade journal to note which regime/bias combinations work best for each instrument
Consider economic news events that might trigger regime changes
Strategy Limitations
Like all strategies, performance varies across different market instruments and timeframes
Regime detection may lag during rapid market transitions
Multi-timeframe analysis requires sufficient historical data on all timeframes
The strategy is designed for swing trading and may not be optimal for scalping
Highly correlated instruments may produce similar signals across different pairs
Extreme market events (black swans) can overwhelm any risk management system
Backtested performance does not guarantee future results
The strategy requires discipline to follow all signals, including losing ones
Commissions and slippage can significantly impact performance on smaller timeframes
Success requires understanding the system's logic rather than blind execution
Technical Implementation
Built with Pine Script v6 featuring:
Modular architecture with separate calculation modules for each component
Advanced regime detection using ADX and ATR combinations
Multi-timeframe security requests with proper lookahead management
Dynamic risk management with adaptive position sizing
Comprehensive signal qualification scoring system
Real-time dashboard with 12 key metrics
Visual elements including directional cloud and risk levels
Export functions for integration with other indicators
Alert conditions for all major signal types
The code is fully open-source and can be modified to suit individual trading styles and preferences. All calculations use confirmed bars to prevent repainting.
Originality Statement
This strategy is original in its comprehensive integration of multiple analytical layers into a unified adaptive system. While individual components (ADX, moving averages, RSI, MACD, etc.) are established tools, this strategy is justified because:
It synthesizes six distinct analytical approaches into a cohesive decision framework
The regime-adaptive logic automatically adjusts strategy behavior based on market conditions
The qualification scoring system provides objective criteria for signal selection
Multi-timeframe bias aggregation ensures alignment with the dominant market trend
Structural analysis integration provides context for market microstructure
Volatility-adaptive risk management dynamically adjusts to market conditions
The comprehensive dashboard presents all critical metrics for informed decision-making
Each component contributes unique information: regime tells us when to trade, bias tells us direction, momentum provides timing, structure gives levels, volatility determines sizing, and qualification ensures quality
The strategy's value lies not in any single component but in how these elements work together to create a robust, adaptive trading system that can navigate different market environments while maintaining disciplined risk management.
Disclaimer
This strategy is provided for educational and informational purposes only. It is not financial advice or a recommendation to buy or sell any financial instrument. Trading involves substantial risk of loss and is not suitable for all investors.
Past performance does not guarantee future results. The backtested results shown are based on historical data and do not account for real-world factors such as slippage, liquidity issues, or psychological pressures that can affect trading performance.
The strategy's signals are mathematical calculations based on historical patterns and technical indicators. They do not predict future price movements with certainty. Market conditions can change rapidly, rendering previously successful patterns ineffective.
Always use proper risk management, including stop losses and position sizing appropriate for your account size and risk tolerance. Never risk more than you can afford to lose. Consider consulting with a qualified financial advisor before making investment decisions.
The author is not responsible for any losses incurred from using this strategy. Users assume full responsibility for all trading decisions made using this system.
-Made with passion by officialjackofalltrades
Strateji

Gösterge

Adaptive Squeeze Momentum Pro [WillyAlgoTrader]Adaptive Squeeze Momentum Pro is a non-overlay oscillator that combines volatility compression detection (squeeze) with an ATR-normalized momentum histogram and built-in divergence scanning — providing three layers of analysis in a single pane: when the market is coiling (squeeze), which direction the energy is building (momentum), and when momentum is diverging from price (divergence warnings).
The classic squeeze momentum concept — Bollinger Bands contracting inside Keltner Channels — has been available on TradingView for years. What this indicator adds is an entirely different momentum calculation that is ATR-normalized (making it comparable across instruments and timeframes), a 4-state color-coded histogram that distinguishes between momentum acceleration and deceleration in both directions, automated divergence detection with optional HTF trend filtering, and a preset system tuned for different trading styles. The result is a modernized squeeze oscillator designed for practical trading rather than textbook demonstration.
🔍 WHAT MAKES IT ORIGINAL
1. ATR-normalized momentum oscillator. Most squeeze indicators use a raw linear regression value or simple price-minus-midline for their histogram. This makes the oscillator's scale dependent on the instrument's price level — a reading of 5.0 on BTCUSD means something completely different than 5.0 on EURUSD. This indicator solves that by dividing the raw momentum by the current ATR value, producing a dimensionless oscillator that typically ranges between −3 and +3 regardless of instrument or timeframe. The raw momentum itself is calculated as the distance between price and the average of the highest-high/lowest-low midpoint and an EMA — capturing both range-based and trend-based positioning. An optional EMA smoothing layer (configurable, default 3) reduces noise without excessive lag.
2. EMA-based volatility bands instead of standard Bollinger Bands. The squeeze detection uses an EMA (not SMA) as its basis, paired with standard deviation for the band width. EMA reacts faster to recent price changes than SMA, making the squeeze detection more responsive to volatility shifts — particularly useful on crypto and volatile instruments where compression phases can be short-lived. The ATR channel (replacing the traditional Keltner Channel) uses the same EMA basis. The squeeze fires when the volatility band width is less than the ATR channel width (ratio < 1.0).
3. Tiered squeeze intensity. Instead of a binary on/off squeeze state, the indicator classifies the compression into four tiers based on the ratio between the volatility band width and the ATR channel width:
— EXTREME (ratio < 0.5): very tight compression, highest energy buildup
— HIGH (ratio < 0.7): significant compression
— MID (ratio < 0.9): moderate compression
— LOW (ratio < 1.0): mild compression
— NONE (ratio ≥ 1.0): no squeeze
This lets you distinguish between a mild contraction (which may resolve quietly) and an extreme compression (which is more likely to produce a strong directional move).
4. 4-state histogram coloring. The momentum histogram uses four distinct colors to convey both direction and acceleration:
— Bull Strong (bright green): momentum above zero AND rising — bulls are accelerating
— Bull Weak (teal): momentum above zero BUT falling — bulls are decelerating, potential topping
— Bear Strong (bright red): momentum below zero AND falling — bears are accelerating
— Bear Weak (dark red): momentum below zero BUT rising — bears are decelerating, potential bottoming
The transition from Strong to Weak (or vice versa) often precedes a zero-line cross, giving an early visual warning of momentum shifts.
5. Automated divergence detection with two modes. The indicator scans for classic divergences between price pivots and momentum pivots:
— Bullish divergence : price makes a lower low while momentum makes a higher low
— Bearish divergence : price makes a higher high while momentum makes a lower high
Two detection modes are available:
— Early mode (default): divergence is labeled on bar close at the pivot with zero right-side confirmation bars — fastest detection, may occasionally produce false signals
— Confirmed mode : requires N confirmation bars on the right side of the pivot (same as the lookback length) — more reliable, but delayed
Divergence lines are drawn on the oscillator connecting the two momentum pivots, and optional overlay labels are placed directly on the price chart (using force_overlay) so you can spot divergences without switching panes.
6. HTF trend filter for divergences. An optional higher-timeframe filter compares a 21-period EMA to a 50-period EMA on the selected HTF (default 60min). When enabled, bullish divergences are only shown when the HTF trend is bullish (fast EMA > slow EMA), and bearish divergences only when HTF is bearish. The HTF data uses the standard non-repainting pattern ( + lookahead_on). This filter reduces counter-trend signals that divergences often produce.
⚙️ HOW IT WORKS
Squeeze detection:
On each bar, the script calculates two band widths:
— Volatility band width = StdDev(source, length) × multiplier × 2, centered on an EMA
— ATR channel width = ATR(length) × multiplier × 2
The squeeze ratio = volatility width / ATR width. When this ratio falls below 1.0, volatility bands are inside the ATR channel — the market is in a squeeze. The tier is determined by how far below 1.0 the ratio is.
Momentum calculation:
— Midpoint 1: (highest high over N bars + lowest low over N bars) / 2
— Midpoint 2: EMA(source, N)
— Combined midpoint: average of Midpoint 1 and Midpoint 2
— Raw momentum: source − combined midpoint
— Normalized momentum: raw momentum / ATR(N)
— Final momentum: EMA(normalized momentum, smoothing) if smoothing > 1, else raw normalized
This approach blends range-based positioning (where is price within the recent range) with trend-based positioning (where is price relative to the EMA), then normalizes by ATR so the oscillator is instrument-agnostic.
Divergence detection:
The script uses ta.pivotlow() and ta.pivothigh() on both the momentum oscillator and price (low/high). For each new momentum pivot, it compares against the previous stored pivot. A bullish divergence is detected when the current price pivot low is lower than the previous one, but the current momentum pivot low is higher. Bearish divergence is the mirror. In Early mode (rightBars = 0), the pivot is identified at bar close without waiting for right-side confirmation. In Confirmed mode (rightBars = lookback), pivots are only confirmed after N bars pass.
HTF filter:
HTF EMAs are fetched with request.security() using the + lookahead_on non-repainting pattern. When the 21 EMA is above the 50 EMA on the higher timeframe, the HTF trend is bullish; below = bearish.
Squeeze release alert:
The "squeeze fired" alert triggers on the first confirmed bar after the squeeze condition ends (sqzOn transitions from true to false). The alert message includes the momentum direction at release (bullish if momentum > 0, bearish if ≤ 0).
📖 HOW TO USE
Reading the histogram:
— Bright green bars (Bull Strong) = momentum above zero and accelerating — strongest bullish phase
— Teal bars (Bull Weak) = momentum above zero but decelerating — bulls losing steam
— Bright red bars (Bear Strong) = momentum below zero and accelerating — strongest bearish phase
— Dark red bars (Bear Weak) = momentum below zero but decelerating — bears losing steam
— Transition from Strong → Weak = early warning of momentum exhaustion
— Zero-line cross after Weak phase = momentum direction change
Reading the squeeze:
— Orange-tinted background = active squeeze (volatility compression)
— The longer and tighter the squeeze, the more energy is stored
— Watch for the first bar after the background clears (squeeze release) — the momentum direction at that moment often indicates the breakout direction
Reading divergences:
— Green "Div" label below the oscillator / below price = bullish divergence (potential bottom)
— Red "Div" label above the oscillator / above price = bearish divergence (potential top)
— Lines on the oscillator connect the two pivots that form the divergence
— Divergences inside a squeeze are particularly powerful — they suggest the breakout direction before the squeeze releases
Suggested workflow:
— Wait for a squeeze to form (background tint appears)
— Watch for divergences during the squeeze — they hint at breakout direction
— On squeeze release, check momentum direction and histogram color
— Bright green at release = bullish breakout bias; bright red = bearish
— If HTF filter is enabled, only take signals aligned with the higher-timeframe trend
Presets:
— Conservative : length ≥ 25, BB mult ≥ 2.2, ATR mult ≤ 1.2, smoothing ≥ 7 — fewer signals, smoother histogram, suited for 4H–Daily
— Default : uses your manual settings — balanced for 15min crypto
— Aggressive : length ≤ 14, BB mult ≤ 1.6, ATR mult ≥ 1.6, smoothing ≤ 2 — more signals, faster reaction
— Scalping : length ≤ 10, BB mult ≤ 1.4, ATR mult ≥ 1.8, no smoothing — optimized for 1–5min
⚙️ KEY SETTINGS REFERENCE
— Squeeze Length (default 21): shared lookback for EMA, StdDev, and ATR — higher = slower squeeze detection, longer compression phases
— Volatility Band Mult (default 1.8): multiplier for the EMA ± StdDev bands — higher = wider bands, squeeze triggers more easily
— ATR Channel Mult (default 1.6): multiplier for the ATR channel — lower = narrower channel, squeeze triggers less
— Momentum Length (default 20): lookback for highest-high, lowest-low, and momentum EMA
— Momentum Smoothing (default 3): EMA smoothing on the normalized momentum — 1 = raw, higher = smoother
— Divergence Lookback (default 3): pivot detection lookback for divergence scanning
— Early Divergence (default On): label on bar close with no right-side confirmation — faster but less filtered
— Use HTF Trend Filter (default Off): filter divergences by higher-timeframe EMA trend
— Higher Timeframe (default 60): HTF for trend filter — should be 3–5× chart timeframe
🔔 Alerts
Three alert conditions (all bar-close confirmed):
— Squeeze Fire : squeeze releases — includes momentum direction (bullish/bearish)
— Bullish Divergence : price lower low + momentum higher low — includes HTF trend status
— Bearish Divergence : price higher high + momentum lower high — includes HTF trend status
All support standard text and JSON webhook format.
⚠️ IMPORTANT NOTES
— This indicator is a non-overlay oscillator — it appears in a separate pane below the chart. Optional divergence labels can be mirrored on the price chart via the "Show Divergences on Chart" toggle.
— All signals require bar-close confirmation . The HTF filter uses the standard non-repainting security call pattern ( + lookahead_on).
— Early divergence mode (default) labels divergences without waiting for right-side pivot confirmation — this provides faster signals but may occasionally flag a divergence that is later invalidated. Switch to Confirmed mode for higher reliability at the cost of delay.
— A squeeze release indicates that volatility is expanding — it does not guarantee a directional move. False breakouts can and do occur, especially on lower timeframes.
— Divergences signal momentum weakening, not guaranteed reversals. They are most effective as confluence with other analysis, not as standalone signals.
— The ATR normalization makes the oscillator scale-independent, but the absolute readings (e.g. +2.0 vs +1.5) should be compared within the same instrument/timeframe context, not across different ones.
— Works across all asset classes. Volume is not used in any calculation. Gösterge

Advanced Divergence Hunter [JOAT]Advanced Divergence Hunter
Introduction
The Advanced Divergence Hunter is an open-source multi-oscillator indicator that simultaneously tracks divergences across six different momentum indicators: RSI, MACD, Stochastic RSI, CCI, MFI, and Williams %R. This mashup creates a comprehensive divergence detection system designed to identify momentum exhaustion and potential reversals by analyzing when multiple oscillators simultaneously show divergence from price action.
The indicator addresses a critical limitation of single-oscillator divergence detection: false signals. By requiring confluence across multiple oscillators using different calculation methods, this tool significantly reduces false divergence signals and highlights only the most reliable momentum exhaustion patterns that occur when price and momentum fundamentally disconnect across multiple measurement frameworks.
Chart showing multiple divergence signals across oscillators with dashboard on 1H timeframe
Why This Mashup Exists
This indicator combines six oscillators that detect divergences using fundamentally different methodologies:
RSI: Momentum oscillator based on average gains vs losses
MACD: Trend-following momentum using EMA convergence/divergence
Stochastic RSI: Stochastic calculation applied to RSI for enhanced sensitivity
CCI (Commodity Channel Index): Measures deviation from statistical mean
MFI (Money Flow Index): Volume-weighted RSI showing buying/selling pressure
Williams %R: Momentum indicator measuring overbought/oversold using highest high/lowest low
Each oscillator responds to different market dynamics: RSI tracks momentum speed, MACD shows trend strength changes, Stochastic RSI catches early shifts, CCI identifies statistical extremes, MFI incorporates volume, and Williams %R uses price extremes. When multiple oscillators show divergence simultaneously, it indicates genuine momentum exhaustion rather than noise from a single calculation method.
The mashup is justified because these oscillators use distinct mathematical approaches (rate of change, moving average convergence, stochastic, statistical deviation, volume-weighted, price extremes) that respond to different aspects of price movement. Confluence across multiple methods provides significantly higher reliability than any single divergence signal.
Example showing all six oscillators with divergence markers and alignment indicators
Core Components Explained
1. RSI Divergence Detection
Standard RSI calculation with pivot-based divergence logic:
rsi = ta.rsi(close, 14)
// Identify swing points
pivotHigh = ta.pivothigh(rsi, 5, 5)
pivotLow = ta.pivotlow(rsi, 5, 5)
// Regular Bullish Divergence
// Price: Lower Low, RSI: Higher Low
bullDiv = priceLow < prevPriceLow AND rsiLow > prevRSILow
// Regular Bearish Divergence
// Price: Higher High, RSI: Lower High
bearDiv = priceHigh > prevPriceHigh AND rsiHigh < prevRSIHigh
2. MACD Histogram Divergence
MACD histogram divergences often lead price divergences:
= ta.macd(close, 12, 26, 9)
// Histogram divergence detection
// Bullish: Price LL, Histogram HL
// Bearish: Price HH, Histogram LH
The indicator plots MACD histogram with enhanced visualization and tracks divergences separately from RSI.
3. Stochastic RSI Divergence
More sensitive than regular RSI, catches early momentum shifts:
stochRSI = ta.stoch(rsi, rsi, rsi, 14)
// K and D line divergences
// Often diverges before regular RSI
Stochastic RSI K and D lines are plotted, and divergences on both lines are tracked independently.
4. CCI Divergence Detection
CCI measures price deviation from statistical mean:
cci = ta.cci(close, 20)
// CCI divergences indicate statistical exhaustion
// Bullish: Price LL, CCI HL
// Bearish: Price HH, CCI LH
CCI divergences are particularly reliable at extreme levels (> +100 or < -100).
5. MFI Divergence (Volume-Weighted)
MFI incorporates volume, making divergences more significant:
// Calculate typical price
typicalPrice = (high + low + close) / 3
// Money flow with volume
rawMoneyFlow = typicalPrice * volume
// MFI calculation
mfi = 100 - (100 / (1 + positiveFlow / negativeFlow))
// Volume divergences often lead price
// Bullish: Price LL, MFI HL (buying pressure increasing)
// Bearish: Price HH, MFI LH (selling pressure increasing)
MFI divergences are weighted more heavily in the confluence system because they incorporate volume.
6. Williams %R Divergence
Williams %R uses highest high and lowest low:
williamsR = -100 * (ta.highest(high, 14) - close) / (ta.highest(high, 14) - ta.lowest(low, 14))
// Divergences at extreme levels (-80 to -100 or -20 to 0)
// Bullish: Price LL, Williams %R HL
// Bearish: Price HH, Williams %R LH
Williams %R divergences are most reliable when oscillator is in extreme zones.
Divergence Confluence System
The indicator tracks divergences across all six oscillators and calculates confluence:
Divergence Confluence Score:
- Single oscillator divergence: 1 point
- Two oscillators: 2 points
- Three oscillators: 4 points
- Four oscillators: 7 points
- Five oscillators: 11 points
- All six oscillators: 15 points (MEGA divergence)
Divergence classification:
Weak Divergence: 1-2 oscillators (score 1-2)
Moderate Divergence: 3 oscillators (score 4)
Strong Divergence: 4 oscillators (score 7)
Very Strong Divergence: 5 oscillators (score 11)
MEGA Divergence: All 6 oscillators (score 15)
The dashboard displays which oscillators are showing divergence and the total confluence score.
Oscillator Alignment Analysis
Beyond divergences, the indicator tracks oscillator alignment:
Alignment Score:
- RSI in healthy range (40-60 bull, 60-40 bear): +1
- MACD histogram direction: +1
- Stochastic RSI position: +1
- CCI direction: +1
- MFI level: +1
- Williams %R position: +1
Total Alignment: 0-6 points
Alignment interpretation:
5-6 aligned: Strong momentum consensus
3-4 aligned: Moderate momentum
0-2 aligned: Weak or conflicting momentum
Enhanced Dashboard System
The indicator features an 11-row dashboard showing:
Row 1: Overall momentum direction (BULL/BEAR/NEUTRAL)
Row 2: Divergence confluence score with color coding
Row 3: RSI value and divergence status
Row 4: MACD histogram status
Row 5: Stochastic RSI K value
Row 6: CCI value and status
Row 7: MFI value and divergence status
Row 8: Williams %R value
Row 9: Momentum strength (0-100)
Row 10: Oscillator alignment (X/6 aligned)
Row 11: Active divergences count
Dashboard showing divergence confluence with individual oscillator breakdown
Visual Elements
Oscillator Lines: All six oscillators plotted with distinct colors
Divergence Labels: "DIV" markers at divergence points, sized by confluence
Confluence Markers: Large diamond shapes for MEGA divergences (6/6)
Background Zones: Color-coded backgrounds for extreme conditions
Overbought/Oversold Lines: Reference levels for each oscillator
Zero/Midpoint Lines: Centerline references
Histogram Bars: MACD histogram with gradient coloring
Dashboard: Comprehensive table with all oscillator readings
How Components Work Together
The mashup creates layered divergence analysis:
Layer 1 - Individual Detection: Each oscillator independently detects divergences
Layer 2 - Confluence Calculation: System counts how many oscillators show divergence
Layer 3 - Weighting: Volume-based divergences (MFI) weighted more heavily
Layer 4 - Alignment Check: Verifies overall oscillator consensus
Layer 5 - Extreme Zones: Identifies when divergences occur at statistical extremes
Layer 6 - Signal Generation: Produces graded signals based on confluence strength
Example scenario: Price makes higher high, but RSI, MACD, Stochastic RSI, and MFI all make lower highs (4/6 divergence). CCI and Williams %R are in extreme overbought zones. Confluence score is 7 (Strong Divergence), and dashboard shows 4 active divergences. This signals high-probability bearish reversal setup.
Input Parameters
Oscillator Settings:
RSI Length: Period for RSI (default: 14)
MACD Settings: Fast 12, Slow 26, Signal 9
Stochastic RSI Length: Period for Stoch RSI (default: 14)
CCI Length: Period for CCI (default: 20)
MFI Length: Period for MFI (default: 14)
Williams %R Length: Period for Williams %R (default: 14)
Divergence Settings:
Pivot Lookback: Bars for pivot detection (default: 5)
Min Confluence: Minimum oscillators for signal (default: 3)
Show All Divergences: Display single-oscillator divergences (default: disabled)
Show Only Strong: Display only 4+ confluence (default: enabled)
Display Options:
Show Dashboard: Toggle dashboard (default: enabled)
Show Oscillators: Toggle oscillator plots (default: enabled)
Show Background Zones: Toggle extreme zone coloring (default: enabled)
Dashboard Position: Top-right, bottom-right, etc.
How to Use This Indicator
Step 1: Monitor Divergence Confluence
Watch the dashboard divergence score. Wait for 3+ oscillators showing divergence (score 4+) before considering reversal trades.
Step 2: Check Oscillator Extremes
Divergences are most reliable when oscillators are in extreme zones (RSI > 70 or < 30, MFI > 80 or < 20, etc.).
Step 3: Verify Alignment
Check oscillator alignment score. Low alignment (0-2) with high divergence confluence suggests strong reversal potential.
Step 4: Identify MEGA Divergences
When all 6 oscillators show divergence (MEGA), it signals extremely high probability reversal setup. These are rare but very reliable.
Step 5: Confirm with Price Action
Wait for price action confirmation (reversal candlestick patterns, trendline breaks) before entering trades based on divergences.
Step 6: Use for Exit Signals
If holding trend-following position and strong divergence appears, consider taking profits or tightening stops.
Best Practices
Use on 15-minute to 4-hour timeframes for optimal divergence reliability
Wait for 3+ oscillator confluence before acting on divergence signals
MEGA divergences (6/6) are rare but extremely reliable - don't ignore them
MFI divergences are particularly significant because they incorporate volume
Divergences in strong trends often lead to pullbacks, not full reversals
Combine with support/resistance levels for precise entry timing
Hidden divergences signal trend continuation, regular divergences signal reversal
Multiple consecutive divergences increase reversal probability
Use oscillator alignment to gauge overall momentum health
Indicator Limitations
Divergences can persist for extended periods before reversal occurs
Strong trends can continue despite multiple oscillator divergences
Pivot-based detection means divergences are confirmed with lag
False divergences can occur in choppy, ranging markets
MEGA divergences are rare - waiting only for these may miss opportunities
Oscillator calculations vary in sensitivity - some may diverge prematurely
Requires understanding of each oscillator's characteristics
No divergence system eliminates false signals entirely
Performance varies across different markets and volatility regimes
Technical Implementation
Built with Pine Script v6 using:
Six independent oscillator calculations
Pivot-based divergence detection for each oscillator
Confluence scoring algorithm with weighted components
Oscillator alignment tracking system
Enhanced 11-row dashboard with real-time updates
Dynamic background zones for extreme conditions
Anti-overlap logic for divergence labels
Gradient coloring for MACD histogram
The code is fully open-source and can be modified to adjust oscillator parameters, confluence thresholds, and visual preferences.
Originality Statement
This indicator is original in its multi-oscillator divergence confluence approach. While individual oscillators (RSI, MACD, Stochastic RSI, CCI, MFI, Williams %R) are established tools, this mashup is justified because:
It tracks divergences across six oscillators using fundamentally different calculations
The confluence scoring system quantifies divergence strength across multiple methods
Integration of volume-weighted divergence (MFI) with price-based oscillators
Oscillator alignment analysis provides momentum consensus measurement
Enhanced dashboard presents complex multi-oscillator data clearly
MEGA divergence detection identifies extremely rare, high-probability setups
Each oscillator contributes unique divergence information: RSI shows momentum speed divergence, MACD shows trend strength divergence, Stochastic RSI catches early divergences, CCI shows statistical divergence, MFI shows volume-weighted divergence, and Williams %R shows price extreme divergence. The mashup's value lies in identifying when multiple independent calculation methods simultaneously show momentum exhaustion, significantly reducing false signals.
Disclaimer
This indicator is provided for educational and informational purposes only. It is not financial advice or a recommendation to buy or sell any financial instrument. Trading involves substantial risk of loss and is not suitable for all investors.
Divergence indicators are analytical tools that identify potential momentum exhaustion, not guarantees of reversals. Divergences can persist for extended periods, and strong trends can continue despite multiple divergence signals. Past divergence performance does not guarantee future results.
The confluence score is a mathematical calculation based on current oscillator readings, not a prediction of future price movement. High confluence scores do not ensure profitable trades. Market conditions change, and divergence patterns that worked historically may not work in the future.
Always use proper risk management, including stop losses and position sizing appropriate for your account size and risk tolerance. Never risk more than you can afford to lose. Consider consulting with a qualified financial advisor before making investment decisions.
The author is not responsible for any losses incurred from using this indicator. Users assume full responsibility for all trading decisions made using this tool.
-Made with passion by officialjackofalltrades Gösterge