MACD Split ColorsStandard MACD modified to show the histogram in different colors for positive/negative.
Ignore all the extra stuff in the chart, I didn't realize at this point I couldn't change it later!
Macd-v

RN MACD SignalsThis is my simple way to quickly see MACD signals without having the MACD taking up space. The one at the bottom is for display to show how this works. A crossover occurs when the arrow flips over. The position of the arrow tells you if it is currently above or below the zero line. You can change the script to overlay and have it show up above or below price also. Let me know what you think.

AK MACD BB INDICATOR V 1.00Here's my version of the MACD _BB . This is a great indicator to capture short term trends.
yellow candles = long
aqua candles = short
This indicator can be much better. I will work on it and publish an improved version (hopefully) soon. In the mean time , go ahead and play around with the code, and please share your findings :)
Cheers
Algo

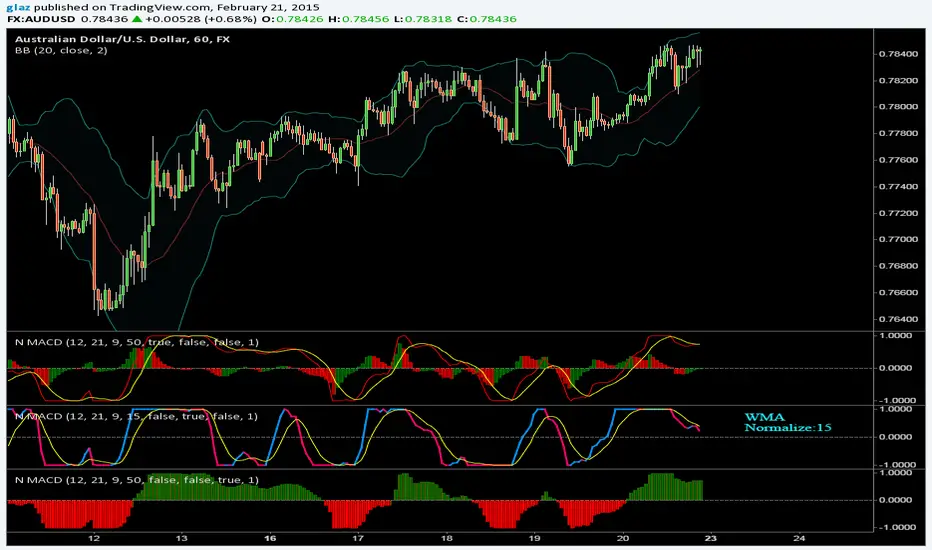
Normalized MACDNormalized MACD
There are varius options like choosing the moving average to use, sometimes i prefer the wma it is much smoother
Added also macd line to swap color and Fill that plots columns
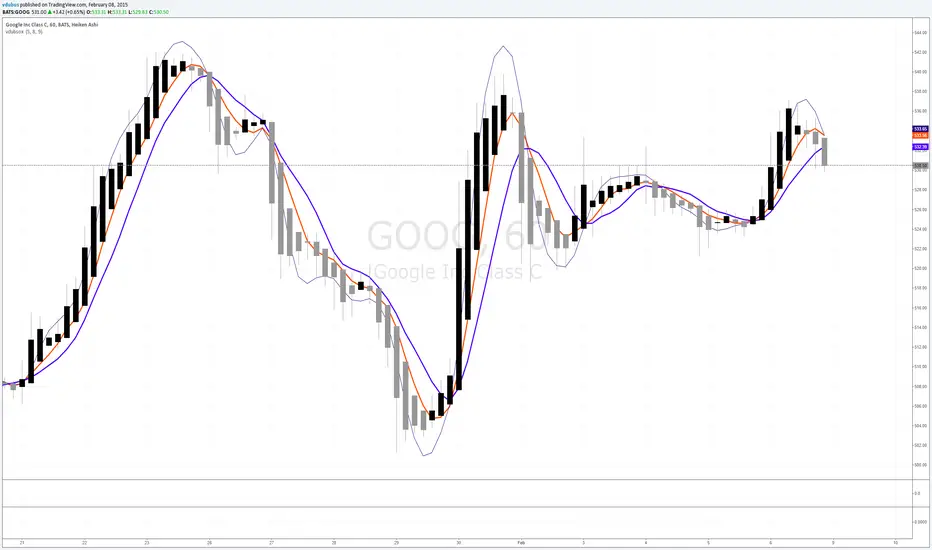
vdubsoxI've been asking for this concept for a while, a simple MA that rides the top side of the trend instead of the bottom, and by accident came across the 'Hull ma' on a TV blog post. I've added another two simple Moving averages to act as strength indicator with close proximity to the price.
The strategy is simple MA cross over but with the early indication using Hull ma gives you a heads up on trend / price reversal.
I'm using this in conjunction with BB set at 34. on a 1/3/5 min charts & Heiken Ashi to smooth out the noise with awesome success trading Binary options.

S3-ZMACDHere's a modified MACD which uses ZL calculation for the emas, phi adjustment to the fast signal and an optimized period set. It useful because it will give predictive signals for many setups.

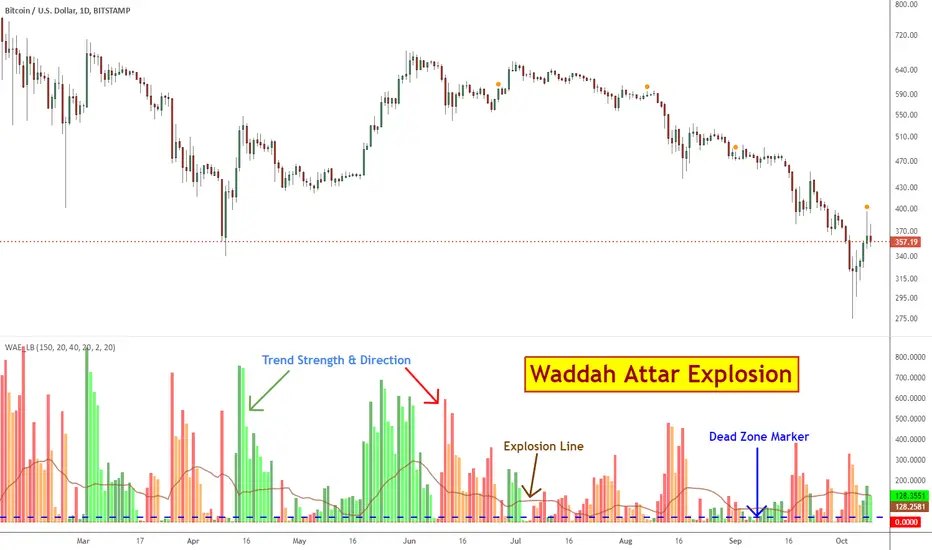
Waddah Attar Explosion [LazyBear]This is a port of a famous MT4 indicator, as requested by user @maximus71. This indicator uses MACD/BB to track trend direction and strength. Author suggests using this indicator on 30mins.
Explanation from the indicator developer:
"Various components of the indicator are:
Dead Zone Line: Works as a filter for weak signals. Do not trade when the red or green histogram is below it.
Histograms:
- Red histogram shows the current down trend.
- Green histogram shows the current up trend.
- Sienna line shows the explosion in price up or down.
Signal for ENTER_BUY: All the following conditions must be met.
- Green histo is raising.
- Green histo above Explosion line.
- Explosion line raising.
- Both green histo and Explosion line above DeadZone line.
Signal for EXIT_BUY: Exit when green histo crosses below Explosion line.
Signal for ENTER_SELL: All the following conditions must be met.
- Red histo is raising.
- Red histo above Explosion line.
- Explosion line raising.
- Both red histo and Explosion line above DeadZone line.
Signal for EXIT_SELL: Exit when red histo crosses below Explosion line. "
All of the parameters are configurable via options page. You may have to tune it for your instrument.
More info:
Author note: www.forex-tsd.com
Video (French): www.youtube.com
List of my other indicators:
- GDoc: docs.google.com
- Chart:
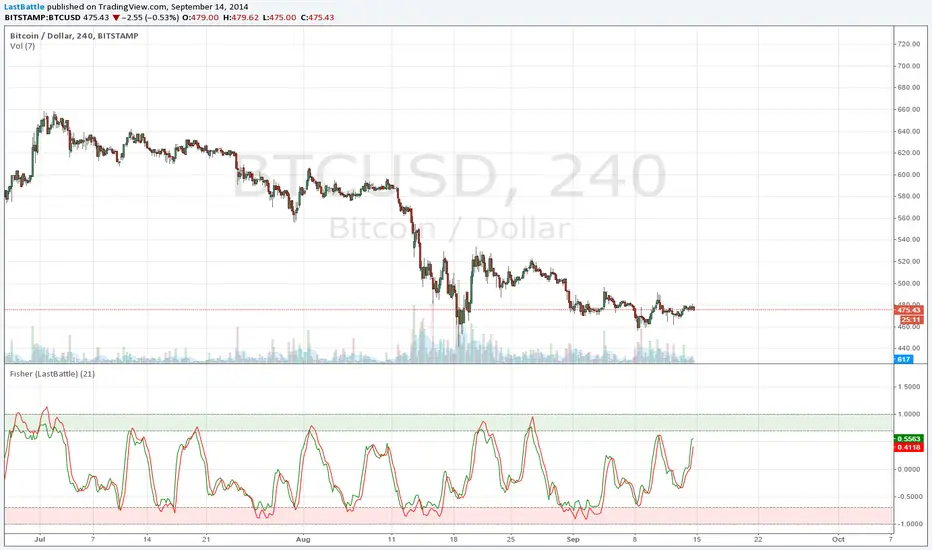
Fisher Transform StrategyDirect port of the original Fisher Transform to TradingView: media.johnwiley.com.au
www.mesasoftware.com
This might be better suited to be combined with other indicator to be effective, such as the Fisher Transform of RSI.
I hope you have found this useful :) Happy trading.
Thanks to @MikeLloyd for referring me to this, and here's my port for you.
MACD Leader [LazyBear]Smoothing methods have lag, and since MACD makes use of moving averages, it usually lags behind price. You cannot eliminate lag completely, but one way of working around this is by adding a component of the price/MA difference back to MA. This technique is called Zero-lag (well, almost). "MACD Leader" makes use of this to form a leading signal to MACD.
First proposed by Giorgos E. Siligardos, "Leader" leads normal MACD, especially when significant trend changes are about to take place. This has the following features:
- It is similar to MACD in smoothness.
- It can be plotted along with MACD in the same window using the same scaling.
- It has the ability to lead MACD at critical situations
For detailed discussion on the various divergence patterns, refer to the PDF I have linked in the "More Info" below.
I have provided an option to plot MACD and MACD signal on the same pane. You can enable/disable them via options page.
For Pinescript coders: Try enabling histo on this to compare with normal MACD histo :)
More info:
drive.google.com
List of my other indicators:
- Chart:
- GDoc: docs.google.com

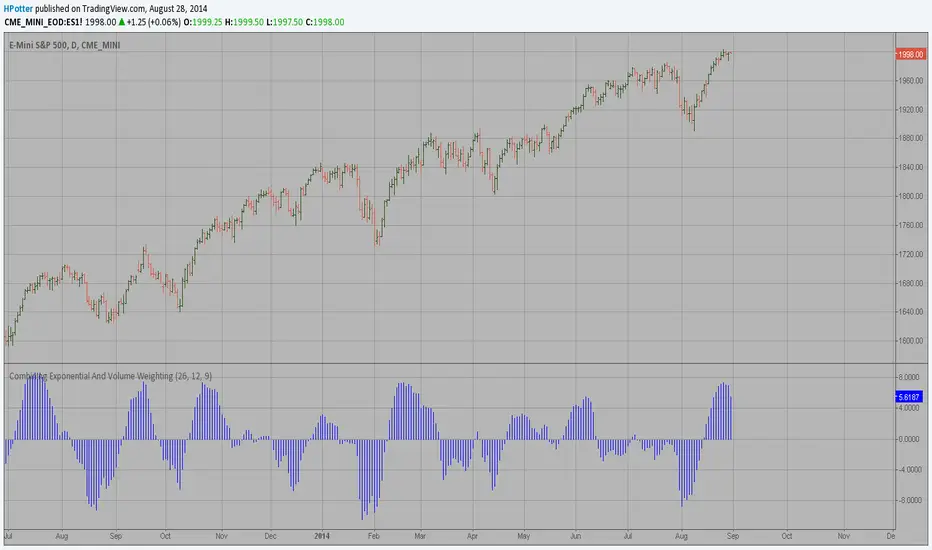
The Volume-Weighted MACD HistogramThe related article is copyrighted material from Stocks & Commodities 2009 Oct
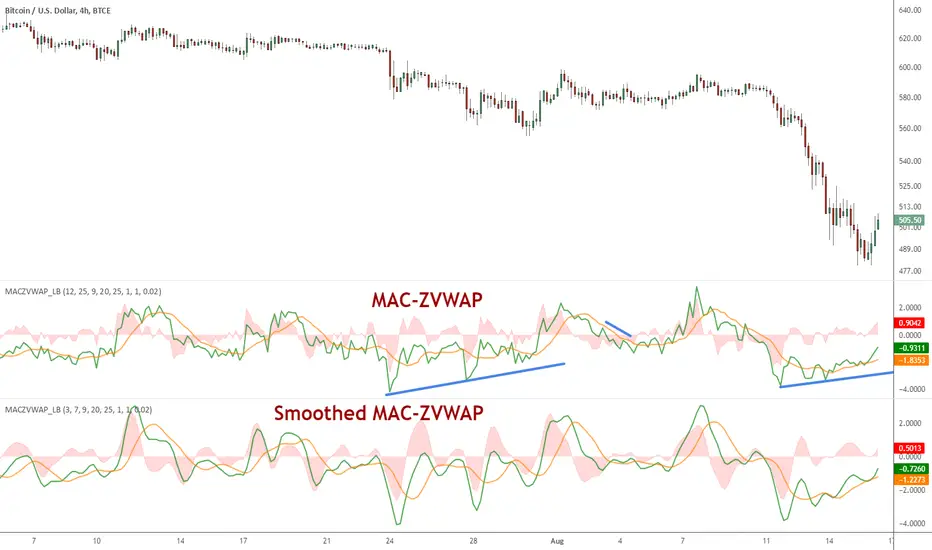
MAC-Z VWAP Indicator [LazyBear]This a modified MAC-Z using Z-VWAP. Since this uses VWAP, the signals are derived indirectly from both volume and price action.
I have also included a way to smooth MACZ-VWAP, you can enable it via options page.
Note that this will not work on any FX pair, as volume is not available.
Referenced indicators:
Z-distance from VWAP:
MAC-Z Indicator:
Z-Score:
Complete list of my indicators:
GDoc: docs.google.com
Chart:

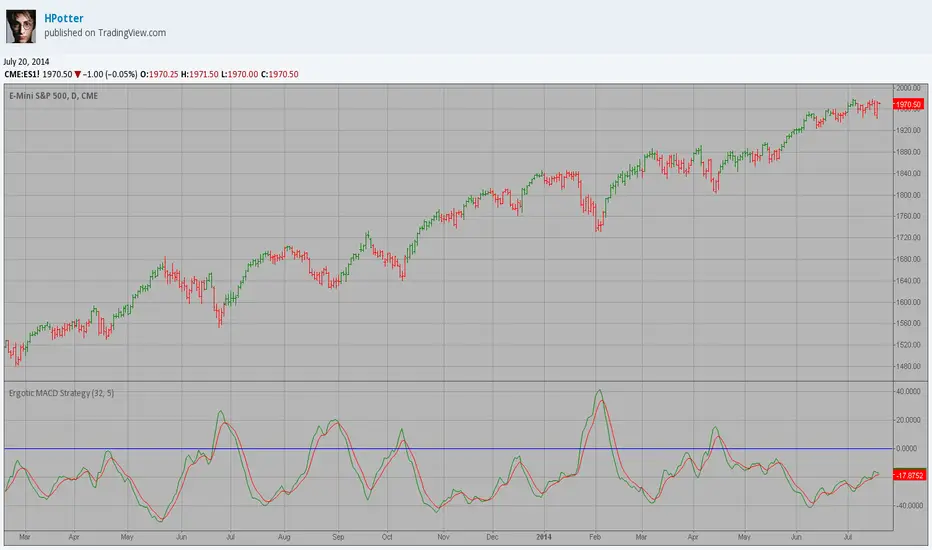
Ergotic MACD Strategy This is one of the techniques described by William Blau in his book
"Momentum, Direction and Divergence" (1995). If you like to learn more,
we advise you to read this book. His book focuses on three key aspects
of trading: momentum, direction and divergence. Blau, who was an electrical
engineer before becoming a trader, thoroughly examines the relationship
between price and momentum in step-by-step examples. From this grounding,
he then looks at the deficiencies in other oscillators and introduces some
innovative techniques, including a fresh twist on Stochastics. On directional
issues, he analyzes the intricacies of ADX and offers a unique approach to help
define trending and non-trending periods.
Blau`s indicator is like usual MACD, but it plots opposite of meaningof
stndard MACD indicator.
Ergotic MACD This is one of the techniques described by William Blau in his book
"Momentum, Direction and Divergence" (1995). If you like to learn more,
we advise you to read this book. His book focuses on three key aspects
of trading: momentum, direction and divergence. Blau, who was an electrical
engineer before becoming a trader, thoroughly examines the relationship
between price and momentum in step-by-step examples. From this grounding,
he then looks at the deficiencies in other oscillators and introduces some
innovative techniques, including a fresh twist on Stochastics. On directional
issues, he analyzes the intricacies of ADX and offers a unique approach to help
define trending and non-trending periods.
Blau`s indicator is like usual MACD, but it plots opposite of meaningof
stndard MACD indicator.

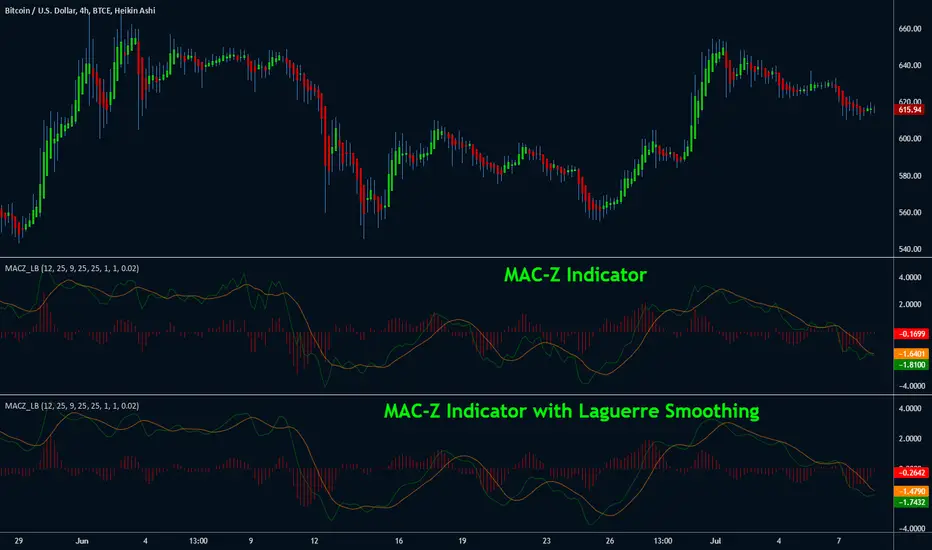
MAC-Z Indicator [LazyBear]This indicator is a composite of MACD and Z-Score (requested by @ChartAt). The general idea is that counter-trend component of the Z-score is used to adjust/improve the trend component of the MACD. The advantage is that it is a more accurate and “assumption-free” and can more accurately describe how a market or stock actually works in a given time frame.
I have also added support to smooth out the MAC-Z using Laguerre filter (Thanks @TheLark for the excellent LMA). Note that smoothing removes the "noise" component additive of Z-Score, so you may miss some good signals. By default Laguerre smoothing is OFF, I suggest playing with the Gamma to see if you can find a proper trade-off value.
Theme credits --> @liw0
More info:
cssanalytics.wordpress.com
TheLark: Laguerre PPOA while ago I posted a more flexible MACD, known as PPO (See that post for details).
Yesterday I had a request by @ChartArt for a Laguerre MACD. Since I favor PPO to MACD, here it is!
Completely untested, and not at all price fit. Play with the numbers and leave a comment if you come up with an interesting combination or idea ;)

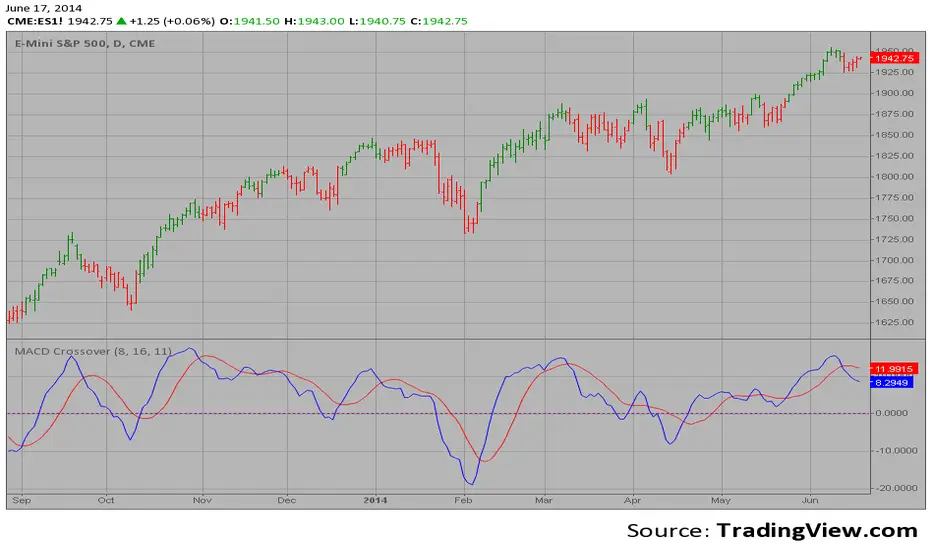
MACD Crossover MACD – Moving Average Convergence Divergence. The MACD is calculated
by subtracting a 26-day moving average of a security's price from a
12-day moving average of its price. The result is an indicator that
oscillates above and below zero. When the MACD is above zero, it means
the 12-day moving average is higher than the 26-day moving average.
This is bullish as it shows that current expectations (i.e., the 12-day
moving average) are more bullish than previous expectations (i.e., the
26-day average). This implies a bullish, or upward, shift in the supply/demand
lines. When the MACD falls below zero, it means that the 12-day moving average
is less than the 26-day moving average, implying a bearish shift in the
supply/demand lines.
A 9-day moving average of the MACD (not of the security's price) is usually
plotted on top of the MACD indicator. This line is referred to as the "signal"
line. The signal line anticipates the convergence of the two moving averages
(i.e., the movement of the MACD toward the zero line).
Let's consider the rational behind this technique. The MACD is the difference
between two moving averages of price. When the shorter-term moving average rises
above the longer-term moving average (i.e., the MACD rises above zero), it means
that investor expectations are becoming more bullish (i.e., there has been an
upward shift in the supply/demand lines). By plotting a 9-day moving average of
the MACD, we can see the changing of expectations (i.e., the shifting of the
supply/demand lines) as they occur.
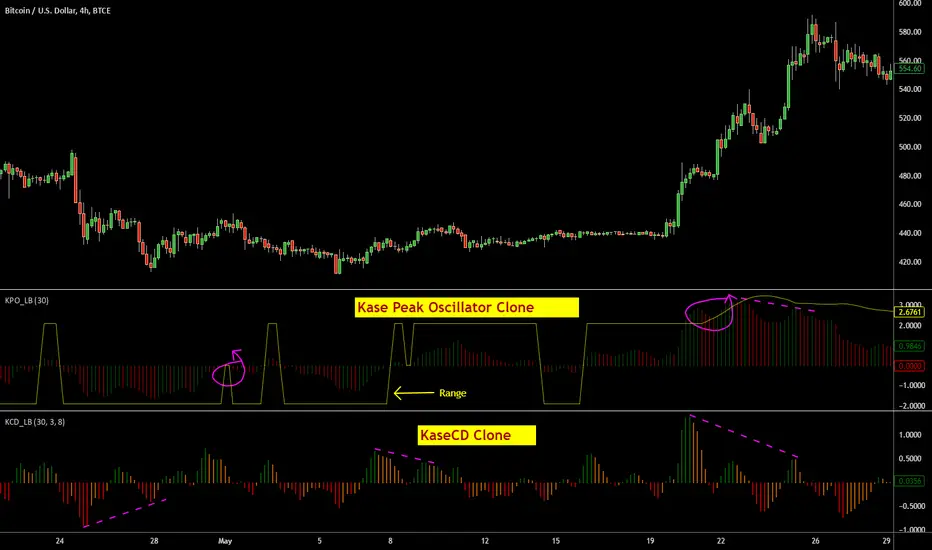
Indicators: KaseCD & Kase Peak OscillatorI have included ports of 2 indicators from MT4 (not from the original commercial source). I couldn't cross check if these matched their commercial equivalents (you need to assume they don't!). If you own any of these in other platforms, appreciate if you could publish some comparison results here.
Kase Peak Oscillator is the difference between two trend measurements, one for rising markets and the other for falling markets. KCD is the PeakOsc minus its own average. So, KPO takes the place of a traditional oscillator and the KCD takes place of the traditional MACD.
Ms.Kase claims KCD is far more accurate than MACD.
More info:
- www.kaseco.com
- beathespread.com
Let me know if you have experience with the original indicators and are willing to help improve these clones. Thanks.
Indicator: Elder Impulse SystemAccording to Elder, "The Impulse System encourages you to enter a trade cautiously but exit fast, by identifying inflection points where a trend speeds up or slows down. This is the professional approach to trading, the total opposite of the amateur's style. Beginners jump into trades without thinking too much and take forever to get out, hoping and waiting for the market to turn their way."
The Impulse System is based on two indicators, a 13-day exponential moving average and the MACD-Histogram. The moving average identifies the trend, while the MACD-Histogram measures momentum. As a result, the Impulse System combines trend following and momentum to identify impulses that can be traded.
By default it uses your chart's time frame, but you can set it to any custom time frame via options page. Optionally, price bars can be color coded too.
More info:
stockcharts.com
Steps to import / use custom indicators from this chart:
PDF: drive.google.com

Indicators: Volume-Weighted MACD Histogram & Sentiment Zone OscVolume-Weighted MACD Histogram
-------------------------------------------------------------------------------------
Volume-Weighted MACD Histogram, first discussed by Buff Dormeier, is a modified version of MACD study. It calculates volume-averaged Close price for finding the histogram.
More info:
www.moneyshow.com
Sentiment Zone Oscillator
-------------------------------------------------------------------------------------
Sentiment Zone Oscillator, developed by Walid Khalil, is a complementing oscillator to VZO and PZO.
To quote Walid:
>> The sentiment zone oscillator (SZO) is a leading contrary oscillator that measures the extreme emotions of a single market or share.
>> It measures and defines both extremes, bullishness (overoptimism) and bearishness (overpessimism), that could lead to a change
>> in sentiment, eventually changing the trend of the time frame under study. The SZO was devised on the belief that after several waves
>> of rising prices, investors begin to get bullish on the stock with increasing confidence since the price has been rising for some time.
>> The SZO measures that bullishness/bearishness and marks overbought/oversold levels.
SZO has its own oversold/overbought bands. Also, when SZO goes above 7, it indicates extreme optimism. When the SZO goes below -7, it indicates extreme pessimism.
More info: www.traders.com
How to import / use custom indicators from this chart?
-------------------------------------------------------------------------------------
PDF: drive.google.com

MacD Custom Indicator-Multiple Time Frame+All Available Options!This MacD Indicator has every feature available. See First Post for Details.
