OPEN-SOURCE SCRIPT
Indicators: KaseCD & Kase Peak Oscillator
I have included ports of 2 indicators from MT4 (not from the original commercial source). I couldn't cross check if these matched their commercial equivalents (you need to assume they don't!). If you own any of these in other platforms, appreciate if you could publish some comparison results here.
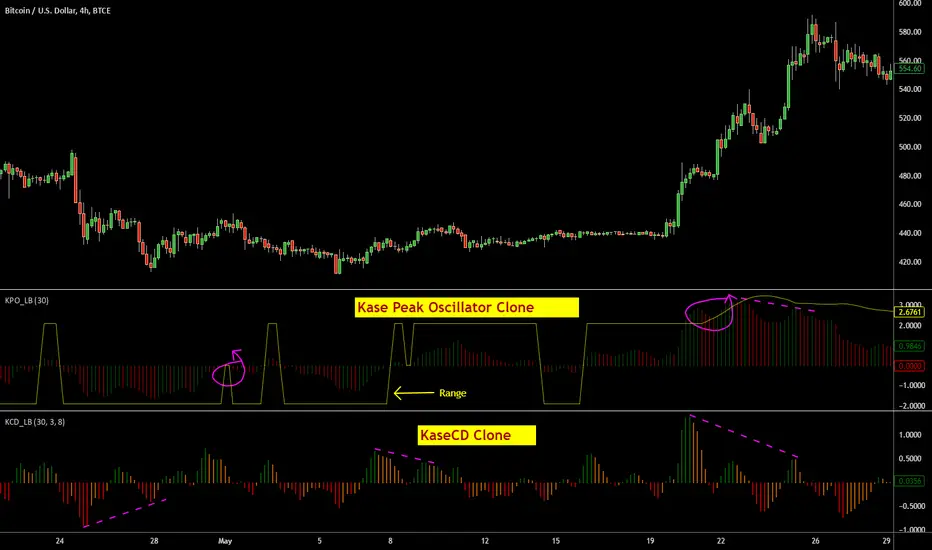
Kase Peak Oscillator [KPO] is the difference between two trend measurements, one for rising markets and the other for falling markets. KCD is the PeakOsc minus its own average. So, KPO takes the place of a traditional oscillator and the KCD takes place of the traditional MACD.
Ms.Kase claims KCD is far more accurate than MACD.
More info:
- kaseco.com/support/articles/The_Two_Faces_of_Momentum.pdf
- beathespread.com/file/download/15086
Let me know if you have experience with the original indicators and are willing to help improve these clones. Thanks.
Açık kaynak kodlu komut dosyası
Gerçek TradingView ruhuna uygun olarak, bu komut dosyasının oluşturucusu bunu açık kaynaklı hale getirmiştir, böylece yatırımcılar betiğin işlevselliğini inceleyip doğrulayabilir. Yazara saygı! Ücretsiz olarak kullanabilirsiniz, ancak kodu yeniden yayınlamanın Site Kurallarımıza tabi olduğunu unutmayın.
List of my free indicators: bit.ly/1LQaPK8
List of my indicators at Appstore: blog.tradingview.com/?p=970
List of my indicators at Appstore: blog.tradingview.com/?p=970
İlgili yayınlar
Feragatname
Bilgiler ve yayınlar, TradingView tarafından sağlanan veya onaylanan finansal, yatırım, işlem veya diğer türden tavsiye veya tavsiyeler anlamına gelmez ve teşkil etmez. Kullanım Şartları'nda daha fazlasını okuyun.