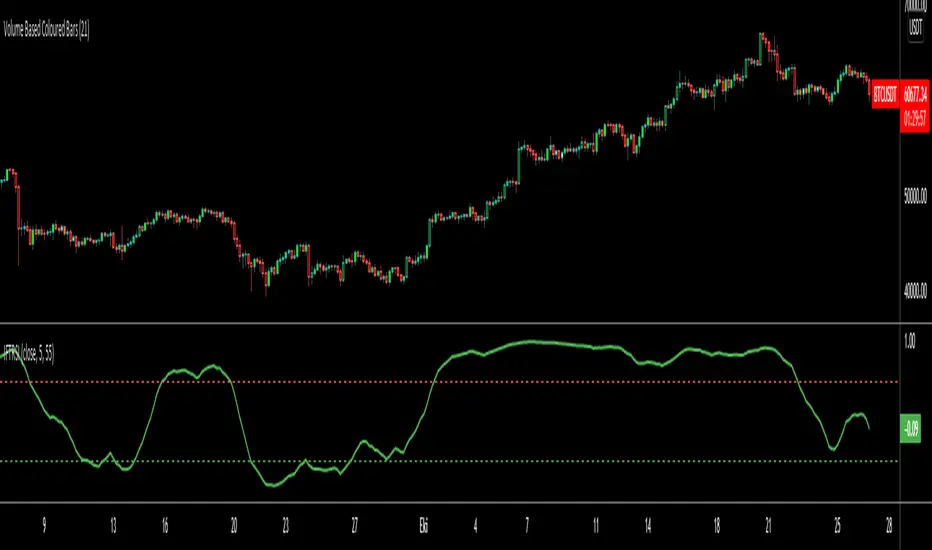
The Perfect RSI (Ehler's Cycle RSI Modified with Discriminator)This is the RSI indicator that I use. It combines two concepts of John Ehler. It integrates the idea of Highpass filtering the Price data, along with the the idea of automatically determining the Dominant price cycle through a Homodyne Discriminator, and using half of a cycle length as the input for the RSI. Not only determines the most effective range for the RSI by setting it based on the cycle, but also makes the RSI PDF(Probability Distribution Function) adjustable as shown in John Ehler's papers. Still needs some tweaking on determining the best calculations for cycles, and whether or not to better filter the price data into the discriminator.
Works just like a normal RSI, but should have less false signals, and also has the option for super smoothing. Play around it and see if theres any new indications or signals that come from it ;)
Let me know if there's any concerns or additions!
Johnehlers

Inverse Fisher Transform on RSIAbout John EHLERS:
From California, USA, John is a veteran trader. With 35 years trading experience he has seen it all. John has an engineering background that led to his technical approach to trading ignoring fundamental analysis (with one important exception).
John strongly believes in cycles. He’d rather exit a trade when the cycle ends or a new one starts. He uses the MESA principle to make predictions about cycles in the market and trades one hundred percent automatically.
In the show John reveals:
• What is more appropriate than trading individual stocks
• The one thing he relies upon in his approach to the market
• The detail surrounding his unique trading style
• What important thing underpins the market and gives every trader an edge
About INVERSE FISHER TRANSFORM:
The purpose of technical indicators is to help with your timing decisions to buy or
sell. Hopefully, the signals are clear and unequivocal. However, more often than
not your decision to pull the trigger is accompanied by crossing your fingers.
Even if you have placed only a few trades you know the drill.
In this article I will show you a way to make your oscillator-type indicators make
clear black-or-white indication of the time to buy or sell. I will do this by using the
Inverse Fisher Transform to alter the Probability Distribution Function (PDF) of
your indicators. In the past12 I have noted that the PDF of price and indicators do
not have a Gaussian, or Normal, probability distribution. A Gaussian PDF is the
familiar bell-shaped curve where the long “tails” mean that wide deviations from
the mean occur with relatively low probability. The Fisher Transform can be
applied to almost any normalized data set to make the resulting PDF nearly
Gaussian, with the result that the turning points are sharply peaked and easy to
identify. The Fisher Transform is defined by the equation
1)
Whereas the Fisher Transform is expansive, the Inverse Fisher Transform is
compressive. The Inverse Fisher Transform is found by solving equation 1 for x
in terms of y. The Inverse Fisher Transform is:
2)
The transfer response of the Inverse Fisher Transform is shown in Figure 1. If
the input falls between –0.5 and +0.5, the output is nearly the same as the input.
For larger absolute values (say, larger than 2), the output is compressed to be no
larger than unity. The result of using the Inverse Fisher Transform is that the
output has a very high probability of being either +1 or –1. This bipolar
probability distribution makes the Inverse Fisher Transform ideal for generating
an indicator that provides clear buy and sell signals.