[GYTS] Ultimate Smoother (3-poles + 2 poles)Ultimate Smoother (3-pole)
🌸 Part of GoemonYae Trading System (GYTS) 🌸
🌸 --------- INTRODUCTION --------- 🌸
💮 Release of 3-Pole Ultimate Smoother
This indicator presents a new 3-pole version of John Ehlers' Ultimate Smoother (2024) . This results in an unconventional filter that exhibits effectively zero lag in practical trading applications, regardless of the set period. By using a 2-pole high-pass filter in its design, it responds to price direction changes on the same bar, while still allowing the user to control smoothness.
💮 What is the Ultimate Smoother?
The original Ultimate Smoother is a revolutionary filter designed by John Ehlers (2024) that smooths price data with virtually zero lag in the pass band. While conventional filters always introduce lag when removing market noise, the Ultimate Smoother maintains phase alignment at low frequencies while still providing excellent noise reduction.
💮 Mathematical Foundation
The Ultimate Smoother achieves its remarkable properties through a clever mathematical approach:
1. Instead of directly designing a low-pass filter (like traditional moving averages), it subtracts a high-pass filter from an all-pass filter (the original input data).
2. At very low frequencies, the high-pass filter contributes almost nothing, so the output closely matches the input in both amplitude and phase.
3. At higher frequencies, the high-pass filter's response increasingly matches the input data, resulting in cancellation through subtraction.
The 3-pole version extends this principle by using a higher-order high-pass filter, requiring additional coefficients and handling more terms in the numerator of the transfer function.
🌸 --------- USAGE GUIDE --------- 🌸
💮 Period Parameter Behaviour
The period parameter in the 3-pole Ultimate Smoother works somewhat counterintuitively:
- Longer periods: Result in less smooth, but more responsive following of the price. The filter output more closely tracks the input data.
- Shorter periods: Produce smoother output but may exhibit overshooting (extrapolating price movement) for larger movements.
This is different from most filters where longer periods typically produce smoother outputs with more lag.
💮 When to Choose 3-Pole vs. 2-Pole
- Choose the 3-pole version when you need zero-lag but want to control the smoothness
- Choose the 2-pole version when you are okay with some lag with the benefit of more smoothness.
🌸 --------- ACKNOWLEDGEMENTS --------- 🌸
This indicator builds upon the pioneering work of John Ehlers, particularly from his article April 2024 edition of TASC's Traders' Tips . The original version is published on TradingView by @PineCodersTASC .
This 3-pole extension was developed by @GoemonYae . Feedback is highly appreciated!
Johnehlers

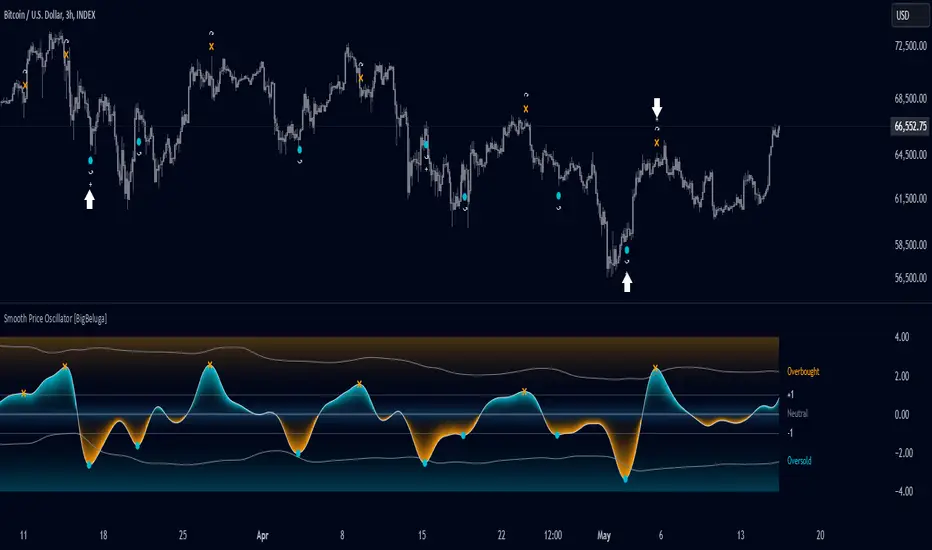
Smooth Price Oscillator [BigBeluga]The Smooth Price Oscillator by BigBeluga leverages John Ehlers' SuperSmoother filter to produce a clear and smooth oscillator for identifying market trends and mean reversion points. By filtering price data over two distinct periods, this indicator effectively removes noise, allowing traders to focus on significant signals without the clutter of market fluctuations.
🔵 KEY FEATURES & USAGE
● SuperSmoother-Based Oscillator:
This oscillator uses Ehlers' SuperSmoother filter, applied to two different periods, to create a smooth output that highlights price momentum and reduces market noise. The dual-period application enables a comparison of long-term and short-term price movements, making it suitable for both trend-following and reversion strategies.
// @function SuperSmoother filter based on Ehlers Filter
// @param price (float) The price series to be smoothed
// @param period (int) The smoothing period
// @returns Smoothed price
method smoother_F(float price, int period) =>
float step = 2.0 * math.pi / period
float a1 = math.exp(-math.sqrt(2) * math.pi / period)
float b1 = 2 * a1 * math.cos(math.sqrt(2) * step / period)
float c2 = b1
float c3 = -a1 * a1
float c1 = 1 - c2 - c3
float smoothed = 0.0
smoothed := bar_index >= 4
? c1 * (price + price ) / 2 + c2 * smoothed + c3 * smoothed
: price
smoothed
● Mean Reversion Signals:
The indicator identifies two types of mean reversion signals:
Simple Mean Reversion Signals: Triggered when the oscillator moves between thresholds of 1 and Overbought or between thresholds -1 and Ovesold, providing additional reversion opportunities. These signals are useful for capturing shorter-term corrections in trending markets.
Strong Mean Reversion Signals: Triggered when the oscillator above the overbought (upper band) or below oversold (lower band) thresholds, indicating a strong reversal point. These signals are marked with a "+" symbol on the chart for clear visibility.
Both types of signals are plotted on the oscillator and the main chart, helping traders to quickly identify potential trade entries or exits.
● Dynamic Bands and Thresholds:
The oscillator includes overbought and oversold bands based on a dynamically calculated standard deviation and EMA. These bands provide visual boundaries for identifying extreme price conditions, helping traders anticipate potential reversals at these levels.
● Real-Time Labels:
Labels are displayed at key thresholds and bands to indicate the oscillator’s status: "Overbought," "Oversold," and "Neutral". Mean reversion signals are also displayed on the main chart, providing an at-a-glance summary of current indicator conditions.
● Customizable Threshold Levels:
Traders can adjust the primary threshold and smoothing length according to their trading style. A higher threshold can reduce signal frequency, while a lower setting will provide more sensitivity to market reversals.
The Smooth Price Oscillator by BigBeluga is a refined, noise-filtered indicator designed to highlight mean reversion points with enhanced clarity. By providing both strong and simple reversion signals, as well as dynamic overbought/oversold bands, this tool allows traders to spot potential reversals and trend continuations with ease. Its dual representation on the oscillator and the main price chart offers flexibility and precision for any trading strategy focused on capturing cyclical market movements.
Percent Trend Change [BigBeluga]The Percent Trend Change indicator is a trend-following tool that provides real-time percentage changes during trends based on entry prices. Using John Ehlers’ Ultimate Smoother filter, it detects trend direction, identifies uptrends and downtrends, and tracks percentage changes during the trend. Additionally, it has a channel that can be toggled on or off, and the width can be customized, adding an extra visual layer to assess trend strength and direction.
NIFTY50:
META:
🔵 IDEA
The Percent Trend Change indicator helps traders visualize the progression of a trend with percentage changes from entry points. It identifies trends and marks percentage changes during the trend, making it easier to assess the strength and sustainability of the ongoing trend.
The use of John Ehlers' Ultimate Smoother filter helps detect trend changes based on consecutive price movements over five bars, making it highly responsive to short- and medium-term trends.
🔵 KEY FEATURES & USAGE
◉ Ultimate Smoother Filter for Trend Detection:
The trend is detected using the Ultimate Smoother filter. If the smoothed line rises five times in a row, the indicator identifies an uptrend. If it falls five times in a row, it identifies a downtrend.
◉ Trend Entry with Price Labels:
The indicator marks trend entry points with up (green) and down (red) triangles. These triangles are labeled with the entry price, allowing traders to track the starting price of the trend.
◉ Percentage Change Labels During Trends:
During a trend, the indicator periodically plots percentage change labels based on the bar period set in the settings.
In an uptrend, positive changes are marked in green, while negative changes are marked in orange. In a downtrend, negative changes are marked in red, while positive changes are marked in orange.
Each plotted percentage label also includes a count of the trend points, allowing traders to track how many times the percentage labels have been plotted during the current trend.
These percentage labels help traders understand how much the price has changed since the trend began and can be used to define potential take-profit targets.
◉ Channel Toggle and Width Customization:
The indicator includes a channel that visually highlights the trend. Traders can toggle this channel on or off, and the width of the channel can be adjusted to match individual preferences. The channel helps visualize the overall trend direction and the range within which price fluctuations occur.
🔵 CUSTOMIZATION
Smoother Length: Adjusts the length of the Ultimate Smoother filter, affecting how responsive the indicator is to price fluctuations.
Bars Percent: Defines how many bars must pass before a new percentage label is plotted. A smaller value plots labels more frequently, while a higher value shows fewer labels.
Channel Width & Show Channel: The width of the channel can be customized, and traders can toggle the channel on or off depending on their preferences.
Color Customization: Traders can customize the colors for the uptrend, downtrend, and percentage labels, providing flexibility in how the indicator is displayed on the chart.
By combining trend-following capabilities with percentage change tracking, the Percent Trend Change indicator offers a powerful tool for identifying trend direction and setting potential take-profit targets. The ability to customize the channel and percentage labels makes it adaptable to various trading strategies.

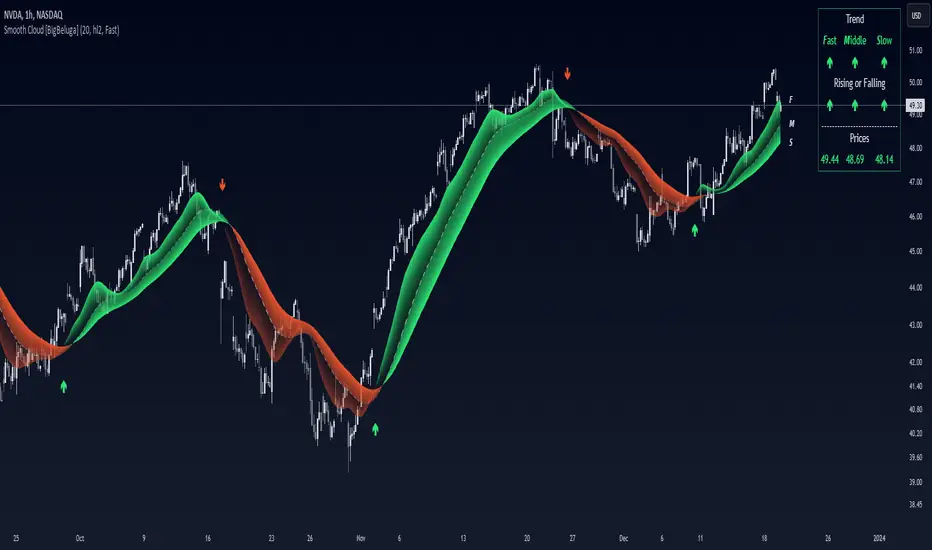
Smooth Cloud [BigBeluga]This trend-following indicator, called Smooth Cloud, is built on top of a SuperSmoother Filter of John Ehlers with small modification.
It consists of three smoothed lines—Fast, Middle, and Slow—that together form a cloud. These lines are based on different periods, helping traders analyze market changes over different timeframes (fast, mid, and slow). The indicator offers a color-coded visual cloud to depict trend direction, along with a detailed dashboard that shows the positioning of the lines, whether they are rising or falling, and their price levels.
🔵 IDEA
The Smooth Cloud indicator is designed to help traders quickly assess the market trend by using three smoothed lines with varying periods. The lines represent fast, mid, and slow market changes, and their relative positioning provides a clear view of trend shifts. The dashboard gives a more granular view by showing if the lines are rising or falling individually, without comparing them to each other, providing insights into potential trend changes before they are fully formed. The color-coded cloud further enhances the visual experience by allowing traders to see trend direction at a glance, making it easier to spot major and minor shifts in the market.
🔵 KEY FEATURES & USAGE
◉ Three Smoothed Lines (Fast, Mid, Slow):
The indicator consists of three smoothed lines, each representing a different periods. The Fast line reacts more quickly to price changes, while the Slow line reacts more slowly, allowing traders to capture both short-term and long-term trend information. The lines are based on different lengths, and their positioning relative to each other helps determine market direction.
◉ Color-Coded Cloud:
The cloud formed between the lines is color-coded to indicate trend direction. When the Fast line is above the Slow line, it signals an upward trend, and the cloud is green. When the Fast line is below the Slow line, the cloud turns red, indicating a downward trend. This color coding makes it easy to spot the overall trend direction visually without having to analyze the lines in detail.
◉ Dashboard for Line Positioning and Trend Direction:
A dashboard in the top right corner of the chart shows the positioning of the Fast, Middle, and Slow lines relative to each other. It displays arrows for each line to indicate whether the line is above or below the other lines. For exae determines its trend direction based on its position to mid line — if it's above, an upward arrow is displayed, and if it's below mid line, a downward arrow is shown.mple, if the Fast line is above the Slow line, the dashboard shows an upward arrow for the Fast line. The Slow lin
Up trend:
Up trend shift:
Down trend shift:
Down Trend:
◉ Rising and Falling Detection:
The dashboard also tracks whether the lines are rising or falling based solely on their own values. If a line rises or falls consistently over three bars, the dashboard shows an upward or downward arrow under the "Rising or Falling" section. This feature provides additional insight into the market's momentum, allowing traders to spot potential trend reversals more quickly.
◉ Price Levels for Fast, Middle, and Slow Lines:
The dashboard includes the price levels for the Fast, Middle, and Slow lines, displayed at the bottom. These levels give traders a quick reference for where the lines are currently positioned relative to the price, adding further context to the trend information displayed.
◉ Fast Signals:
The fast signals are diplayed when fast line crosses slow line. Gree arrows up shows fast line crossed over slow and when arrow down fast line crossed under slow one.
🔵 CUSTOMIZATION
Length Input: You can adjust the length parameter, which affects the smoothing period for the lines. A shorter length makes the lines react more quickly to price changes, while a longer length provides a smoother, more gradual response.
Source Input: The indicator uses the hl2 source (the average of the high and low prices), but you can change this to another source to better suit your trading strategy.
Signals Type: Select between "Fast" and "Slow". Fast signals - is interaction of fast and slow lines. Slow signals is interaction of mid and slow lines
Related script:
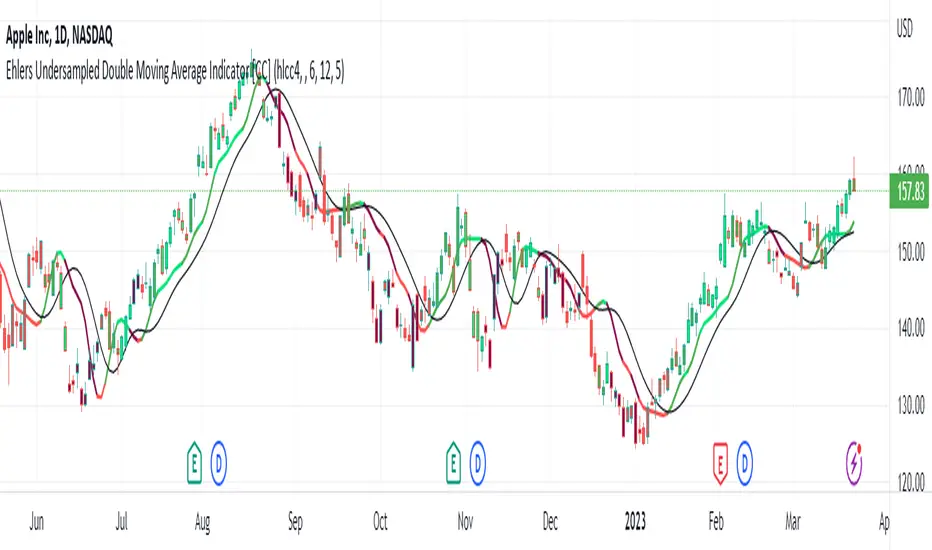
Ehlers Undersampled Double Moving Average Indicator [CC]The Undersampled Double Moving Average was created by John Ehlers (Stocks and Commodities April 2023), and this is a double moving average system which is pretty rare for John Ehlers. For those of you who would like my other take on an Ehlers double moving average, be sure to check out my previous Ehlers double moving average script . He came up with a unique idea for this indicator to create a moving average using a sample of the price data. For example, we use his suggested length of 5 only to use the price data every 5 bars. Feel free to change this, and please let me know if you find a length that works better. He then smooths the indicator using the Hann Windowed Moving Average . I color-coded the lines to show stronger signals in darker colors or standard signals in lighter colors. Buy when the line turns green and sell when it turns red.
Let me know if there is an indicator or script you would like to see me publish!
Ehlers Stochastic Center Of Gravity [CC]The Stochastic Center Of Gravity Indicator was created by John Ehlers (Cybernetic Analysis For Stocks And Futures pgs 79-80), and this is one of the many cycle scripts that I have created but not published yet because, to be honest, I don't use cycle indicators in my everyday trading. Many of you probably do, so I will start publishing my big backlog of cycle-based indicators. These indicators work best with a trend confirmation or some other confirmation indicator to pair with it. The current cycle is the length of the trend, and since most stocks generally change their underlying trend quite often, especially during the day, it makes sense to adjust the length of this indicator to match the stock you are using it on. As you can see, the indicator gives constant buy and sell signals during a trend which is why I recommend using a confirmation indicator.
I have color-coded it to use lighter colors for normal signals and darker colors for strong signals. Buy when the line turns green and sell when it turns red.
Let me know if there are any other scripts you would like to see me publish!

Ehlers Detrending Filter [CC]The Detrending Filter was created by John Ehlers and this is a complementary indicator to one of my previous scripts:
This indicator builds upon his previous work by attempting to detrend the underlying source data that is used to calculate the final result. He was able to create a leading indicator by removing the trend data and by using his previous calculations to turn the source data into a leading indicator.
There are two ways to understand this indicator. First if the indicator is below the midline then it is in a mid to longterm downtrend and if it is above the midline then it is in a mid to longterm uptrend. Also this indicator shows great promise in predicting future trends so because of that aspect, it may give some false signals from time to time.
I have color coded everything to account for both strong signals and normal signals. Strong signals are darker in color and normal signals are lighter in color. Buy when the line turns green and sell when it turns red.
Let me know if there are any other scripts you would like to see me publish!

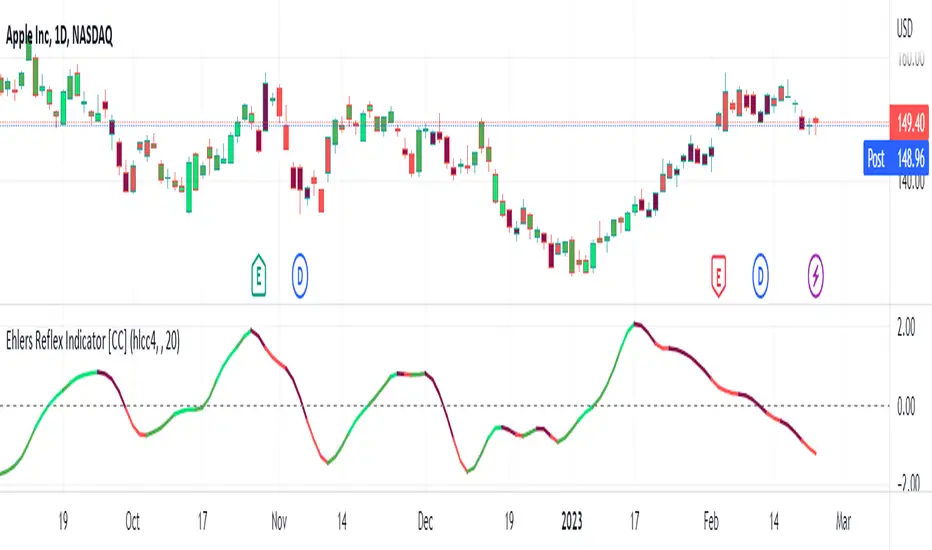
Ehlers Reflex Indicator [CC]The Reflex Indicator was created by John Ehlers (Stocks and Commodities Feb 2020) and this is a zero lag indicator that works similar to an overbought/oversold indicator but with the current stock cycle data. I find that this indicator works well as a leading indicator as well as a divergence indicator. Generally speaking, this indicator indicates a medium to long term downtrend when the indicator is below the line and a medium to long term uptrend when the indicator is above the line. Ehlers has created a few complementary indicators that I will release in the next few days but just keep in mind that this indicator focuses on the underlying cycle component while removing as much noise with no lag. I have color coded the lines to show strong signals with the darker colors and normal signals with the lighter colors. Buy when the line turns green and sell when it turns red.
Let me know if there are any other scripts you would like to see me publish!
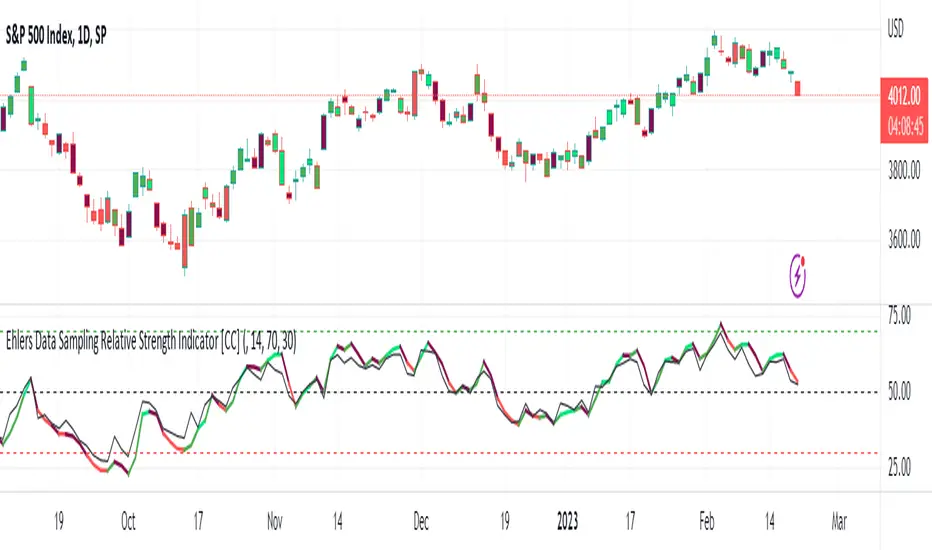
Ehlers Data Sampling Relative Strength Indicator [CC]The Data Sampling Indicator was created by John Ehlers (Stocks and Commodities Mar 2023) and this is a genius method to reduce noise in the market data but also doesn't introduce any lag while doing so. The way this works is because traditionally, people have always relied on the close price as the default input for many indicators such as the RSI or MACD as examples. Since the open is usually virtually identical to the previous close, it has been ignored by most people but Ehlers discovered that if you do a simple average of open and close for the input on any indicator, you can remove much of the noise without any added lag. I have used the RSI as he did in his example and plotted both to show the difference between the traditional RSI and using Ehlers' process as the new Data Sampling RSI. You can clearly see that this new RSI follows the price fluctuations much closer and is much smoother than the traditional RSI. As usual, I have included different colors to show the strength of the buy or sell signals so darker colors mean it is a very strong signal and lighter colors means it is a normal signal. Buy when the line turns green and sell when it turns red.
Feel free to try out this method to replace the input for any indicator and let me know how this works for you! And of course let me know if you would like me to publish any indicator script.
Ehlers Two-Pole Predictor [Loxx]Ehlers Two-Pole Predictor is a new indicator by John Ehlers . The translation of this indicator into PineScript™ is a collaborative effort between @cheatcountry and I.
The following is an excerpt from "PREDICTION" , by John Ehlers
Niels Bohr said “Prediction is very difficult, especially if it’s about the future.”. Actually, prediction is pretty easy in the context of technical analysis . All you have to do is to assume the market will behave in the immediate future just as it has behaved in the immediate past. In this article we will explore several different techniques that put the philosophy into practice.
LINEAR EXTRAPOLATION
Linear extrapolation takes the philosophical approach quite literally. Linear extrapolation simply takes the difference of the last two bars and adds that difference to the value of the last bar to form the prediction for the next bar. The prediction is extended further into the future by taking the last predicted value as real data and repeating the process of adding the most recent difference to it. The process can be repeated over and over to extend the prediction even further.
Linear extrapolation is an FIR filter, meaning it depends only on the data input rather than on a previously computed value. Since the output of an FIR filter depends only on delayed input data, the resulting lag is somewhat like the delay of water coming out the end of a hose after it supplied at the input. Linear extrapolation has a negative group delay at the longer cycle periods of the spectrum, which means water comes out the end of the hose before it is applied at the input. Of course the analogy breaks down, but it is fun to think of it that way. As shown in Figure 1, the actual group delay varies across the spectrum. For frequency components less than .167 (i.e. a period of 6 bars) the group delay is negative, meaning the filter is predictive. However, the filter has a positive group delay for cycle components whose periods are shorter than 6 bars.
Figure 1
Here’s the practical ramification of the group delay: Suppose we are projecting the prediction 5 bars into the future. This is fine as long as the market is continued to trend up in the same direction. But, when we get a reversal, the prediction continues upward for 5 bars after the reversal. That is, the prediction fails just when you need it the most. An interesting phenomenon is that, regardless of how far the extrapolation extends into the future, the prediction will always cross the signal at the same spot along the time axis. The result is that the prediction will have an overshoot. The amplitude of the overshoot is a function of how far the extrapolation has been carried into the future.
But the overshoot gives us an opportunity to make a useful prediction at the cyclic turning point of band limited signals (i.e. oscillators having a zero mean). If we reduce the overshoot by reducing the gain of the prediction, we then also move the crossing of the prediction and the original signal into the future. Since the group delay varies across the spectrum, the effect will be less effective for the shorter cycles in the data. Nonetheless, the technique is effective for both discretionary trading and automated trading in the majority of cases.
EXPLORING THE CODE
Before we predict, we need to create a band limited indicator from which to make the prediction. I have selected a “roofing filter” consisting of a High Pass Filter followed by a Low Pass Filter. The tunable parameter of the High Pass Filter is HPPeriod. Think of it as a “stone wall filter” where cycle period components longer than HPPeriod are completely rejected and cycle period components shorter than HPPeriod are passed without attenuation. If HPPeriod is set to be a large number (e.g. 250) the indicator will tend to look more like a trending indicator. If HPPeriod is set to be a smaller number (e.g. 20) the indicator will look more like a cycling indicator. The Low Pass Filter is a Hann Windowed FIR filter whose tunable parameter is LPPeriod. Think of it as a “stone wall filter” where cycle period components shorter than LPPeriod are completely rejected and cycle period components longer than LPPeriod are passed without attenuation. The purpose of the Low Pass filter is to smooth the signal. Thus, the combination of these two filters forms a “roofing filter”, named Filt, that passes spectrum components between LPPeriod and HPPeriod.
Since working into the future is not allowed in EasyLanguage variables, we need to convert the Filt variable to the data array XX. The data array is first filled with real data out to “Length”. I selected Length = 10 simply to have a convenient starting point for the prediction. The next block of code is the prediction into the future. It is easiest to understand if we consider the case where count = 0. Then, in English, the next value of the data array is equal to the current value of the data array plus the difference between the current value and the previous value. That makes the prediction one bar into the future. The process is repeated for each value of count until predictions up to 10 bars in the future are contained in the data array. Next, the selected prediction is converted from the data array to the variable “Prediction”. Filt is plotted in Red and Prediction is plotted in yellow.
The Predict Extrapolation indicator is shown below for the Emini S&P Futures contract using the default input parameters. Filt is plotted in red and Predict is plotted in yellow. The crossings of the Predict and Filt lines provide reliable buy and sell timing signals. There is some overshoot for the shorter cycle periods, for example in February and March 2021, but the only effect is a late timing signal. Further reducing the gain and/or reducing the BarsFwd inputs would provide better timing signals during this period.
Figure 2. Predict Extrapolation Provides Reliable Timing Signals
I have experimented with other FIR filters for predictions, but found none that had a significant advantage over linear extrapolation.
MESA
MESA is an acronym for Maximum Entropy Spectral Analysis. Conceptually, it removes spectral components until the residual is left with maximum entropy. It does this by forming an all-pole filter whose order is determined by the selected number of coefficients. It maximally addresses the data within the selected window and ignores all other data. Its resolution is determined only by the number of filter coefficients selected. Since the resulting filter is an IIR filter, a prediction can be formed simply by convolving the filter coefficients with the data. MESA is one of the few, if not the only way to practically determine the coefficients of a higher order IIR filter. Discussion of MESA is beyond the scope of this article.
TWO POLE IIR FILTER
While the coefficients of a higher order IIR filter are difficult to compute without MESA, it is a relatively simple matter to compute the coefficients of a two pole IIR filter.
(Skip this paragraph if you don’t care about DSP) We can locate the conjugate pole positions parametrically in the Z plane in polar coordinates. Let the radius be QQ and the principal angle be 360 / P2Period. The first order component is 2*QQ*Cosine(360 / P2Period) and the second order component is just QQ2. Therefore, the transfer response becomes:
H(z) = 1 / (1 - 2*QQ*Cosine(360 / P2Period)*Z-1 + QQ2*Z-2)
By mixing notation we can easily convert the transfer response to code.
Output / Input = 1 / (1 - 2*QQ*Cosine(360 / P2Period)* + QQ2* )
Output - 2*QQ*Cosine(360 / P2Period)*Output + QQ2*Output = Input
Output = Input + 2*QQ*Cosine(360 / P2Period)*Output - QQ2*Output
The Two Pole Predictor starts by computing the same “roofing filter” design as described for the Linear Extrapolation Predictor. The HPPeriod and LPPeriod inputs adjust the roofing filter to obtain the desired appearance of an indicator. Since EasyLanguage variables cannot be extended into the future, the prediction process starts by loading the XX data array with indicator data up to the value of Length. I selected Length = 10 simply to have a convenient place from which to start the prediction. The coefficients are computed parametrically from the conjugate pole positions and are normalized to their sum so the IIR filter will have unity gain at zero frequency.
The prediction is formed by convolving the IIR filter coefficients with the historical data. It is easiest to see for the case where count = 0. This is the initial prediction. In this case the new value of the XX array is formed by successively summing the product of each filter coefficient with its respective historical data sample. This process is significantly different from linear extrapolation because second order curvature is introduced into the prediction rather than being strictly linear. Further, the prediction is adaptive to market conditions because the degree of curvature depends on recent historical data. The prediction in the data array is converted to a variable by selecting the BarsFwd value. The prediction is then plotted in yellow, and is compared to the indicator plotted in red.
The Predict 2 Pole indicator is shown above being applied to the Emini S&P Futures contract for most of 2021. The default parameters for the roofing filter and predictor were used. By comparison to the Linear Extrapolation prediction of Figure 2, the Predict 2 Pole indicator has a more consistent prediction. For example, there is little or no overshoot in February or March while still giving good predictions in April and May.
Input parameters can be varied to adjust the appearance of the prediction. You will find that the indicator is relatively insensitive to the BarsFwd input. The P2Period parameter primarily controls the gain of the prediction and the QQ parameter primarily controls the amount of prediction lead during trending sections of the indicator.
TAKEAWAYS
1. A more or less universal band limited “roofing filter” indicator was used to demonstrate the predictors. The HPPeriod input parameter is used to control whether the indicator looks more like a trend indicator or more like a cycle indicator. The LPPeriod input parameter is used to control the smoothness of the indicator.
2. A linear extrapolation predictor is formed by adding the difference of the two most recent data bars to the value of the last data bar. The result is considered to be a real data point and the process is repeated to extend the prediction into the future. This is an FIR filter having a one bar negative group delay at zero frequency, but the group delay is not constant across the spectrum. This variable group delay causes the linear extrapolation prediction to be inconsistent across a range of market conditions.
3. The degree of prediction by linear extrapolation can be controlled by varying the gain of the prediction to reduce the overshoot to be about the same amplitude as the peak swing of the indicator.
4. I was unable to experimentally derive a higher order FIR filter predictor that had advantages over the simple linear extrapolation predictor.
5. A Two Pole IIR predictor can be created by parametrically locating the conjugate pole positions.
6. The Two Pole predictor is a second order filter, which allows curvature into the prediction, thus mitigating overshoot. Further, the curvature is adaptive because the prediction depends on previously computed prediction values.
7. The Two Pole predictor is more consistent over a range of market conditions.
ADDITIONS
Loxx's Expanded source types:
Library for expanded source types:
Explanation for expanded source types:
Three different signal types: 1) Prediction/Filter crosses; 2) Prediction middle crosses; and, 3) Filter middle crosses.
Bar coloring to color trend.
Signals, both Long and Short.
Alerts, both Long and Short.

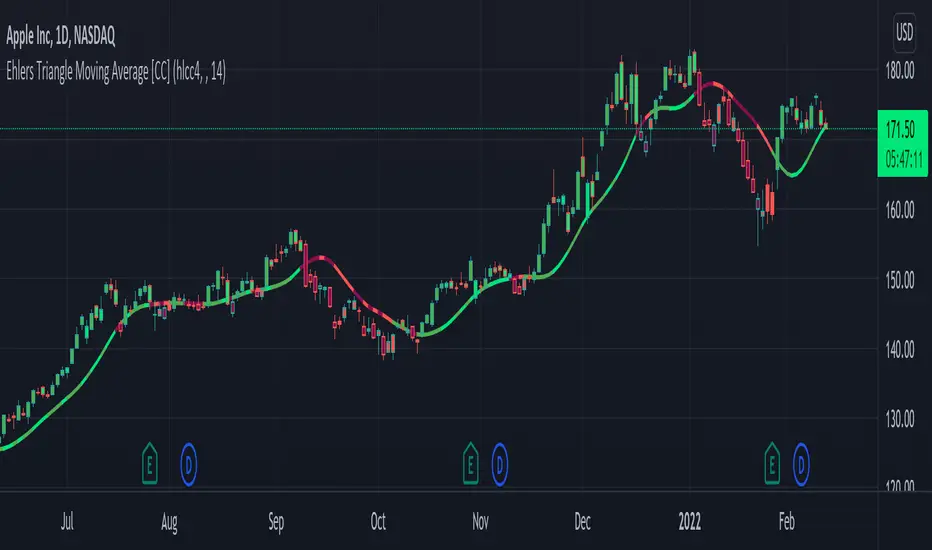
Ehlers Triangle Moving Average [CC]The Triangle Moving Average is the last of custom scripts converting Ehlers Window Indicators to Moving Averages. As you can see this is actually very similar to the Hamming Moving Average and the Hann Moving Average so I would recommend to test this one out with different settings and see what works best for you. As far as the formula calculation, it is a custom weighted moving average that determines how close the price is compared to the middle of the length period and gives a custom weight to that price. For example it will assign heavier weights according to how close the price is to the beginning of the loop (which is the most recent data) and lighter weights, the further the price is away from the recent prices. I have included strong buy and sell signals in addition to normal ones so strong signals are darker in color and normal signals are lighter in color. Buy when the line turns green and sell when it turns red.
Let me know if there are any other indicators or scripts you would like to see me publish!
Ehlers Hamming Moving Average [CC]The Hamming Moving Average is a custom script I made to attempt to create a moving average using Ehler's Hamming Window Indicator . Let me stress that this is extremely experimental considering the original indicator works by creating a sine wave by adjusting the Pedestal value. Change the Pedestal value to anything 5 or higher and you will see what I mean. I think this is a fun experiment so let me know what you think. I have included strong buy and sell signals in addition to normal ones so strong signals are darker in color and normal signals are lighter in color. Buy when the line turns green and sell when it turns red.
Let me know if there are any other indicators or scripts you would like to see me publish!

Ehlers Hann Moving Average [CC]The Hann Moving Average is an original script but a slightly modified version of the Hann Window Filter created by John Ehlers. I am using the same length but changed the default data source to use the new Weighted Close that tv added after I requested it awhile ago so thank you tv! The big strength of this moving average/filter is that it creates an extremely smooth filter with the added benefit of very little lag to smooth ratio. The weakness of this moving average/filter is that it does have a decent amount of lag which means it isn't as useful during choppy periods but does work well for sustained uptrends or downtrends. Feel free to experiment and let me know what settings work better for you. I have included strong buy and sell signals in addition to normal ones so strong signals are darker in color and normal signals are lighter in color. Buy when the line turns green and sell when it turns red.
Let me know if there are any other indicators or scripts you would like to see me publish!

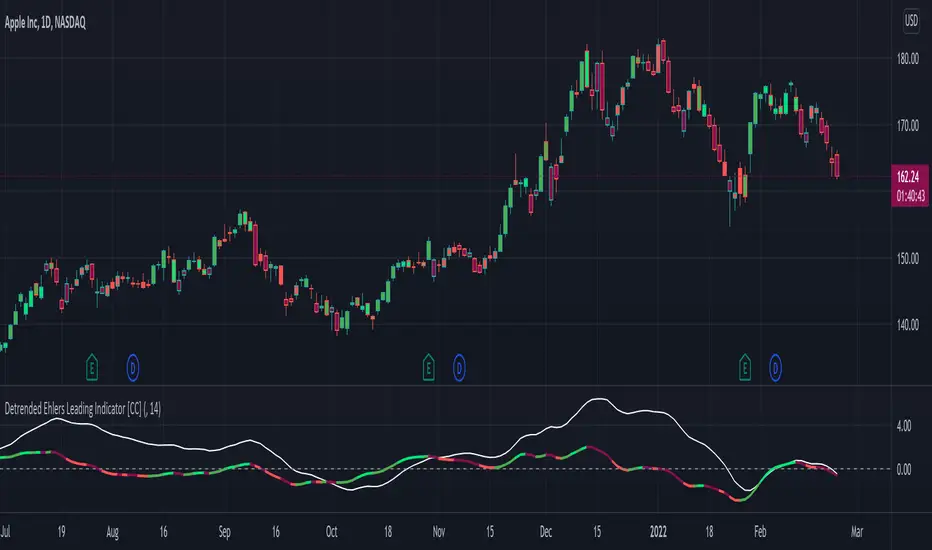
Detrended Ehlers Leading Indicator [CC]The Detrended Ehlers Leading Indicator was created by Bill Mars based off of Ehlers work and this is his attempt to create a leading indicator based on the previous Detrended Synthetic Price . I will be honest that this is a bit of a strange script because it is an indicator based off of the detrended synthetic price which is based off of Ehlers work so I haven't found clear buy and sell signals so I'm open to suggestions. His suggestion for buy and sell signals is to only buy and sell at the indicator crossings but haven't found buy and sell logic that I'm sure about. I have included strong buy and sell signals in addition to normal ones so strong signals are darker in color and normal signals are lighter in color. Buy when the line turns green and sell when it turns red.
Let me know if there are any other indicators or scripts you would like to see me publish!
JohnEhlersFourierTransformLibrary "JohnEhlersFourierTransform"
Fourier Transform for Traders By John Ehlers, slightly modified to allow to inspect other than the 8-50 frequency spectrum.
reference:
www.mesasoftware.com
high_pass_filter(source) Detrended version of the data by High Pass Filtering with a 40 Period cutoff
Parameters:
source : float, data source.
Returns: float.
transformed_dft(source, start_frequency, end_frequency) DFT by John Elhers.
Parameters:
source : float, data source.
start_frequency : int, lower bound of the frequency window, must be a positive number >= 0, window must be less than or 30.
end_frequency : int, upper bound of the frequency window, must be a positive number >= 0, window must be less than or 30.
Returns: tuple with float, float array.
db_to_rgb(db, transparency) converts the frequency decibels to rgb.
Parameters:
db : float, decibels value.
transparency : float, transparency value.
Returns: color.

Ehlers Median Average Adaptive Filter [CC]The Median Average Adaptive Filter was created by John Ehlers and this is another in my current series of undiscovered gems. I'm sure you are all saying but Franklin, Ehlers doesn't have any undiscovered gems but in this case you would be wrong. This was actually an indicator so buried on the internet that I had to use the wayback machine to find the original source code. Ehlers notoriously hates adaptive moving averages which is funny because he has made a decent amount of them. This is a very unique indicator that uses a while loop to adjust the length and I thought it deserved some extra recognition from the TV community. I have included strong buy and sell signals in addition to normal ones so strong signals are darker in color and normal signals are lighter in color. Buy when the line turns green and sell when it turns red.
Let me know if there are any other scripts or indicators you would like to see me publish!

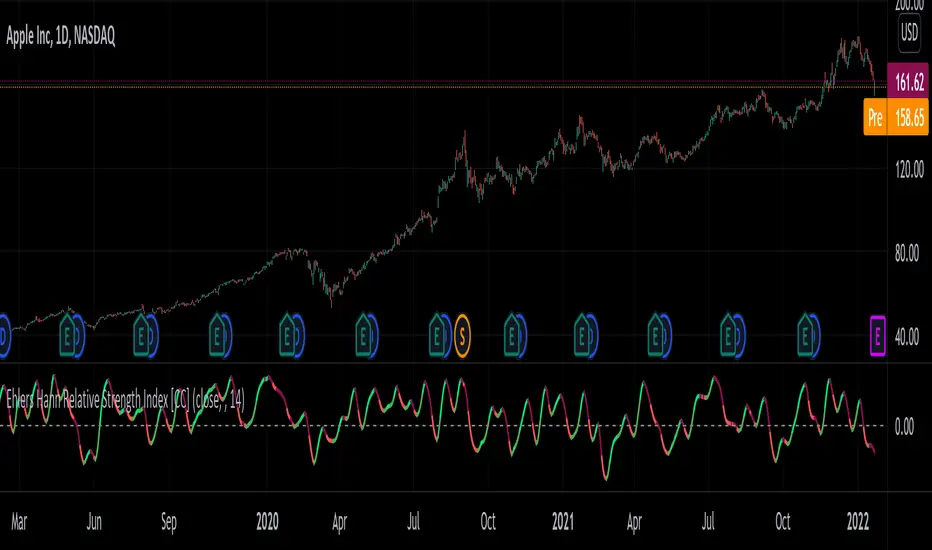
Ehlers Hann Relative Strength Index [CC]The Hann Relative Strength Index was created by John Ehlers (Stocks and Commodities Jan 2022 pgs 26-28) and this indicator builds upon his Hann Window Indicator to create an unique rsi indicator that doesn't rely on overbought or oversold levels to determine a reversal point and also provides a very superior smoothing without any of the lag associated with traditional smoothing. A much more useful RSI than the standard version in my honest opinion. Short term you buy when the line turns green and sell when it turns red. Medium to long term you buy when the indicator rises above the 0 line and sell when it falls below the 0 line. I have included strong buy and sell signals in addition to normal ones so strong signals are darker in color and normal signals are lighter in color.
Let me know if there are any other indicators or scripts you would like to see me publish!
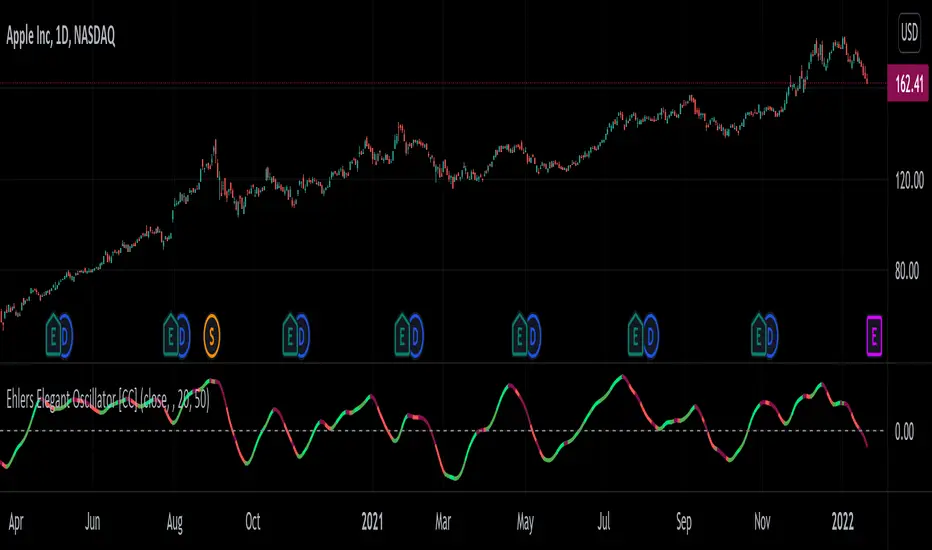
Ehlers Elegant Oscillator [CC]The Elegant Oscillator was created by John Ehlers (Stocks and Commodities Feb 2022 pg 21) and for those of you who don't know, he introduced the indicators for the Fisher Transform and Inverse Fisher Transform and this is a new updated version to that idea based on his latest research. This uses a soft limiter which he says is superior to a hard limiter. There are several ways to interpret this indicator. First if the indicator is above the 0 line then it is a long term bullish trend and below 0 a long term bearish trend. Second this indicator can be used for reversal points with the peaks and valleys. Finally when the indicator line starts moving higher for example it is a bullish short term trend and vice versa. I have included strong buy and sell signals in addition to normal ones so strong signals are darker in color and normal are lighter in color. Buy when the line turns green and sell when it turns red.
Let me know if there are any other indicators or scripts you would like to see me publish!
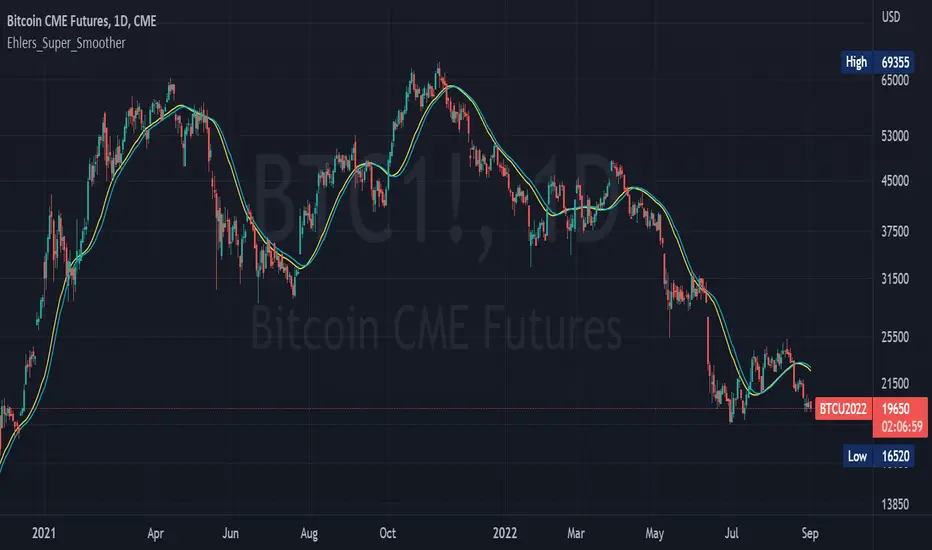
Ehlers_Super_SmootherThe 2 Pole and 3 Pole Super Smoother Filters were developed by John Ehlers and described in "Chapter 13: Super Smother" of his book Cybernetic Analysis for Stocks and Futures .
The 2 Pole Smoother is described as being a better approximation of price, whereas the 3 Pole Smoother has superior smoothing.
Library "Ehlers_Super_Smoother"
Provides the functions to calculate Double and Triple Exponentional Moving Averages (DEMA & TEMA)
twoPole(_source, _length) Calculates 2 Pole Ehlers Super Smoother Filter
Parameters:
_source : -> Open, Close, High, Low, etc ('close' is used if no argument is supplied)
_length : -> Ehlers Super Smoother length
Returns: 2 Pole Ehlers Super Smoothing to an input source at the specified input length
threePole(_source, _length) Calculates 3 Pole Ehlers Super Smoother Filter
Parameters:
_source : -> Open, Close, High, Low, etc ('close' is used if no argument is supplied)
_length : -> Ehlers Super Smoother length
Returns: 3 Pole Ehlers Super Smoothing to an input source at the specified input length
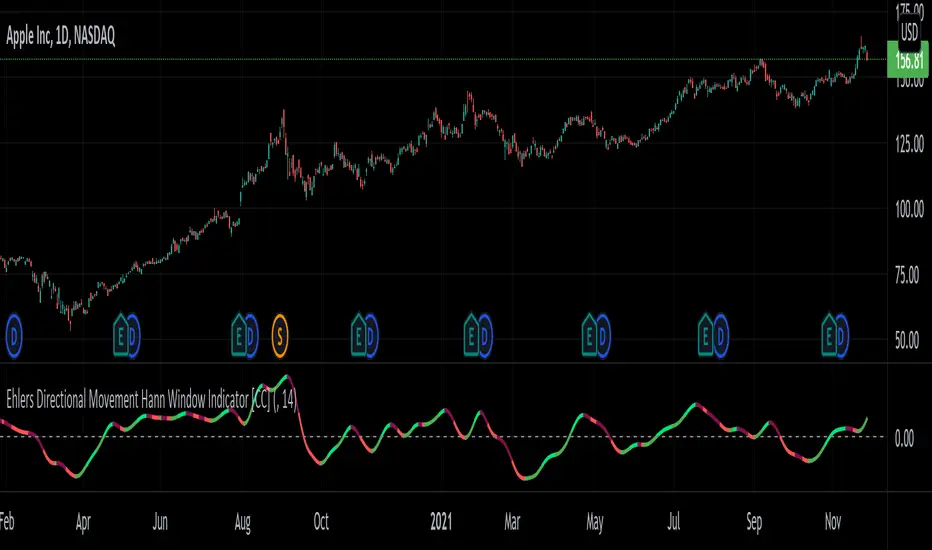
Ehlers Directional Movement Hann Window Indicator [CC]The Directional Movement Hann Window Indicator was created by John Ehlers (Stocks and Commodities Dec 2021 pgs 17-18) and this is his updated version of the classic Directional Movement indicator created by J. Welles Wilder. Ehlers uses the Hann Window Filtering after using an exponential moving average to smooth the classic directional movement indicator. This helps significantly with the lag and lack of smoothing which are both issues with the classic indicator. I have included strong buy and sell signals in addition to the normal ones so strong signals are darker in color and normal signals are lighter in color. Buy when the line turns green and sell when it turns red.
Let me know if there are any other indicators you would like to see me publish!
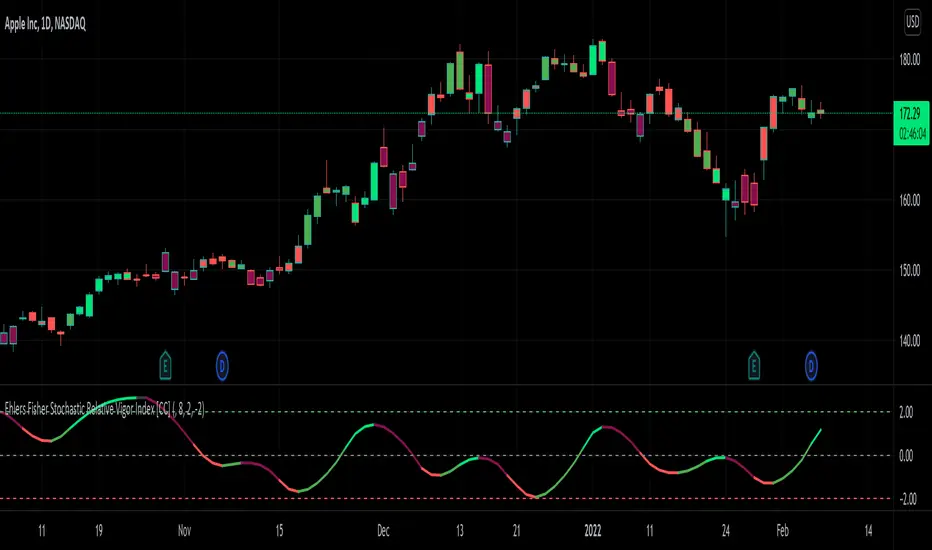
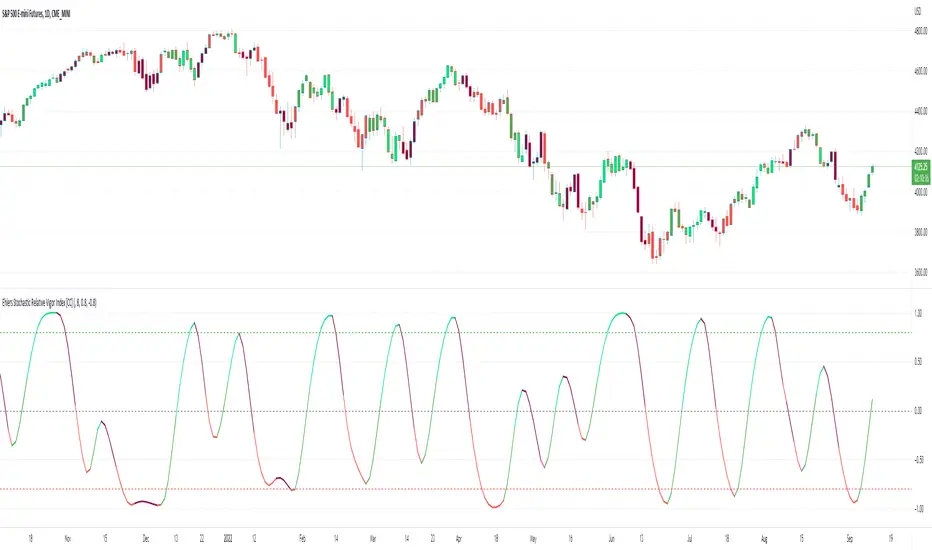
Ehlers Stochastic Relative Vigor Index [CC]The Stochastic Relative Vigor Index was created by John Ehlers (Cybernetic Analysis For Stocks And Futures pgs 84-89) and this of course is very similar to the Ehlers Fisher Stochastic Relative Vigor Index I just published. In hindsight I probably should have published this one first but just like with the other script this is a stochastic version of a Relative Vigor Index and I added some smoothing to make buy and sell signals clearer. There are several ways to identify buy and sell signals but generally in the long term it is a buy signal when the indicator is below the oversold line and is moving up and in the short term when the indicator is above it's trigger line which is what I coded the buy and sell signals to follow. Buy when the line is green and sell when it turns red.
Let me know if there are any other scripts you would like to see me publish!
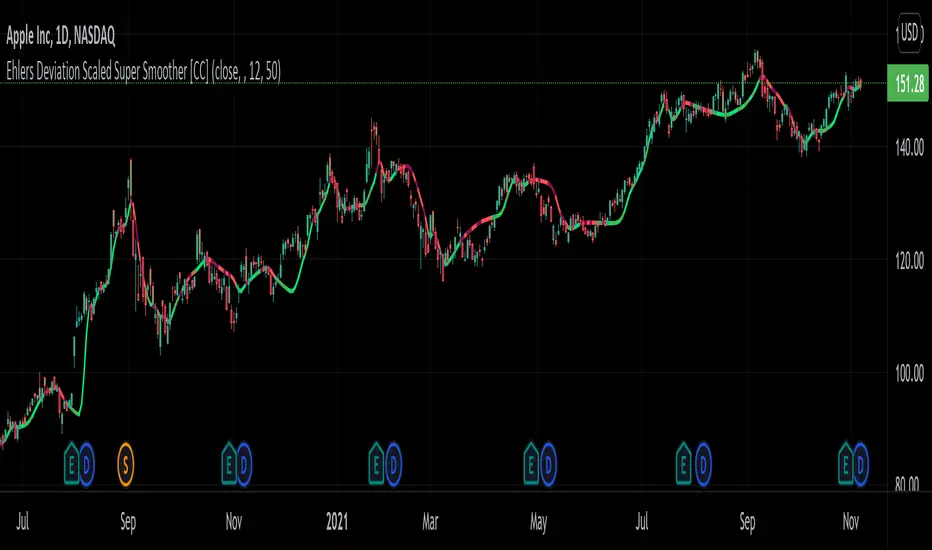
Ehlers Deviation Scaled Super Smoother [CC]The Deviation Scaled Super Smoother was created by John Ehlers and this is an excellent moving average that changes direction very quickly and can keep up with the current underlying trend. This indicator works by applying a Hann Windowed Moving Average to the stock's momentum and scaling that by the Root Mean Square and then using that value in the input for a Super Smoother . I have included strong buy and sell signals in addition to normal ones so lighter colors are normal signals and darker colors are strong ones. Buy when the line turns green and sell when it turns red.
Let me know if there are any other scripts you would like to see me publish!
Ehlers Fisher Stochastic Relative Vigor Index [CC]The Fisher Stochastic Relative Vigor Index was created by John Ehlers (Cybernetic Analysis For Stocks And Futures pgs 101-104) and this is a many layered indicator created from his original Relative Vigor Index turned into a stochastic and then performing a Fisher transform on the results. I have included extra smoothing to provide clearer buy and sell signals as well as normal and strong buy and sell signals. As always strong signals are darker in color and normal signals are lighter in color. Buy when the line turns green and sell when it turns red.
Let me know if there are any other scripts you would like to see me publish!