Week High MTFSimple script to plot weekly data into your chart and as example how MTF works in pine script.
I use it for the 52 week high but you can choose other sources as well f.e. HL2 or close to reduce noise from wicks, also define your own length.
Yüksek-Düşük Endeksi

Liquidation Points for 50 and 100 Leverage V1First basic cut for all those who get liquidated.
The theory behind the liquidation system for Bitmex, shows an estimate where other trader's liquidation prices might be and ultimately how one can exploit other trader's losses for one's own gain.
I have left the code for the x25 leverage level if you wish to use.
If you wish to understand the theory more go to www.youtube.com
I have used vitvlkv’s Day/Low Code to assist in the calculations -
If somebody could improve on this. It would be great. Thanks

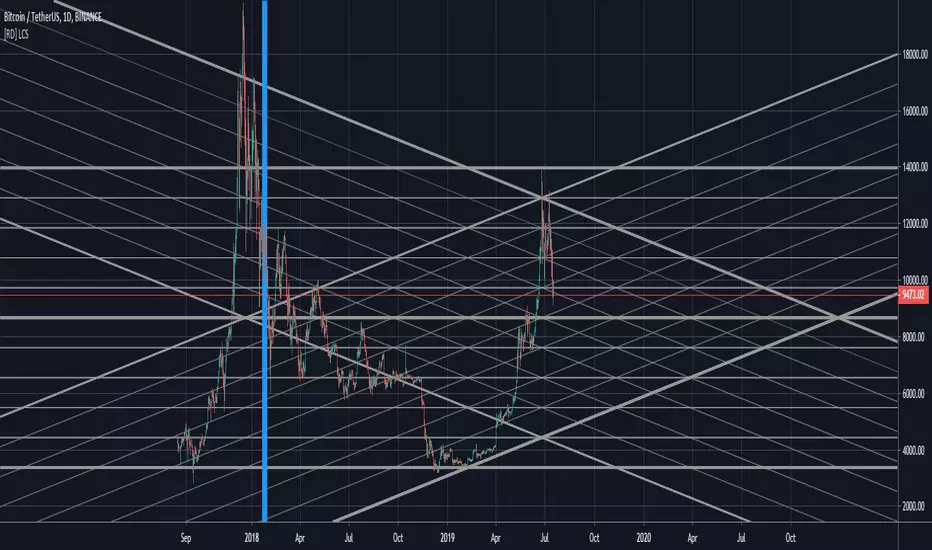
[RD] LCS - line channels (basic) v3 - [republish]==================================================================
July 18 2019 - LCS - line channels (basic) by RootDuk
Version : v3 - read the notes
==================================================================
Easy script to draw channels based on ie. GANN using the following
input params
- ibback : barsback to search for high and low
- ffactor : factor to up/downscale the lines
- oextend : extend lines, left, right, both, none
- bshowline : show horizontal lines yes/no
- bsshowdown : show diag down lines yes/no
- bsshowup : show diag up lines yes/no
- bshowindm : show index marker, where is you current ibback
===================================================================
Notes
===================================================================
When you use this code, pls let me know where and how you used it
as iam always curious what some can do with it. Thanks!
===================================================================
Updates
===================================================================
v1
v2 - July 17 2019
- Removed support wallets from source code. I think the source
- has been deleted because of this, find no other clue.
v3 - July 18 2019
- Republish
[RD] high / low lines pv4 v1==================================================================
July 7 2019 - high / low lines pv4 v1 - by RootDuk
==================================================================
Easy script to draw some lines on the input variable barsback.
You can extend the lines on the sides: left, right, both or none.
With the show variables (bools) you can show or hide the lines
Lines: high to high, low to low, high to low or low to high
Easy way to find support / resistance based on the past with
extended lines. Cheers and enjoy
===================================================================
Notes
===================================================================
Hope TV (pinescript) will get color inputs for line or a type color so we can
easily create inputs for colors for lines. Now its static. If someone knows
another way, pls let me know, i'll integrate it
===================================================================
Updates
===================================================================
Non so far v1

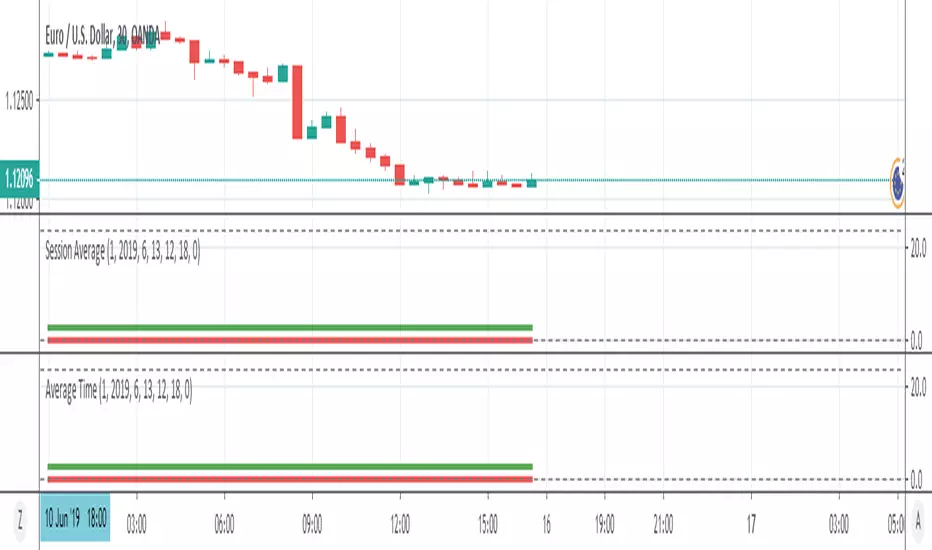
Session AverageThis indicator finds the average time of High or Low formed in sessions.
This is a request from trader @Salmanmahmood15 . You need permission from him to fully use it
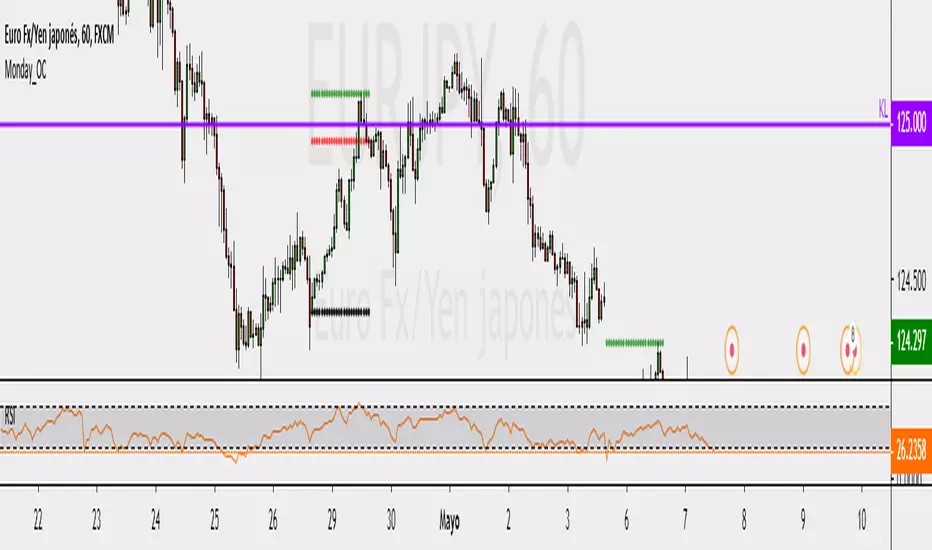
MONDAY HIGH LOW OPEN CLOSEMarks the monday HLOC of the day ill try to update it to mark all the week with mondays HLOC and use a rectangle in stead of lines
Max/Min by ResolutionIndicador que plota no gráfico as máximas e mínimas de acordo com um período selecionado.


Assassin OHLCshow yesterday Daily high and low ,close(today's open).
You can save It yourself for change show last value.
Pine script limit change the length from configure.

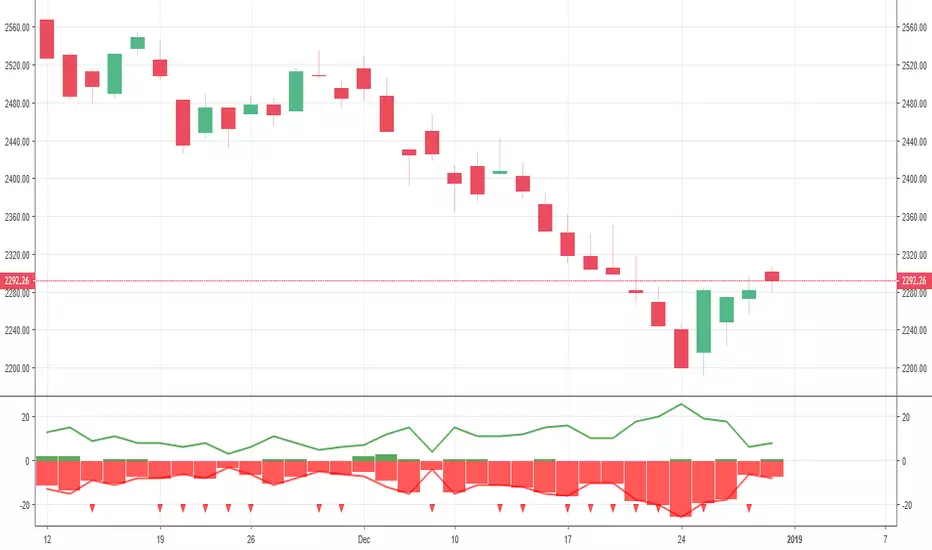
New Highs-Lows AMEX-Buschi
English:
This indicator shows the AMEX's up volume (green) and down volume (red).
Extreme trading days with more than 90 % up or down volume are marked via lines (theoretically values) and triangles (breaches).
Deutsch:
Dieser Indikator zeigt das Aufwärts- (grün) und Abwärts-Volumen (rot) der AMEX.
Extreme Handelstage mit mehr als 90 % Aufwärts- oder Abwärts-Volumen ist gekennzeichnet über Linien (theoretische Werte) und Dreiecke (Überschreitungen).
New Highs-Lows NASDAQ-Buschi
English:
This indicator shows the NASDAQ's new highs (green) and new lows (red).
Extreme trading days with more than 99 % new highs relative to new lows vice versa are marked via lines (theoretically values) and triangles (breaches).
Deutsch:
Dieser Indikator zeigt die neuen Hochs (grün) und neuen Tiefs (rot) der NASDAQ.
Extreme Handelstage mit mehr als 99 % neuen Hochs relativ zu den neuen Tiefs und andersherum sind gekennzeichnet über Linien (theoretische Werte) und Dreiecke (Überschreitungen).
New Highs-Lows NYSE-Buschi
English:
This indicator shows the NYSE's new highs (green) and new lows (red).
Extreme trading days with more than 99 % new highs relative to new lows vice versa are marked via lines (theoretically values) and triangles (breaches).
Deutsch:
Dieser Indikator zeigt die neuen Hochs (grün) und neuen Tiefs (rot) der NYSE.
Extreme Handelstage mit mehr als 99 % neuen Hochs relativ zu den neuen Tiefs und andersherum sind gekennzeichnet über Linien (theoretische Werte) und Dreiecke (Überschreitungen).


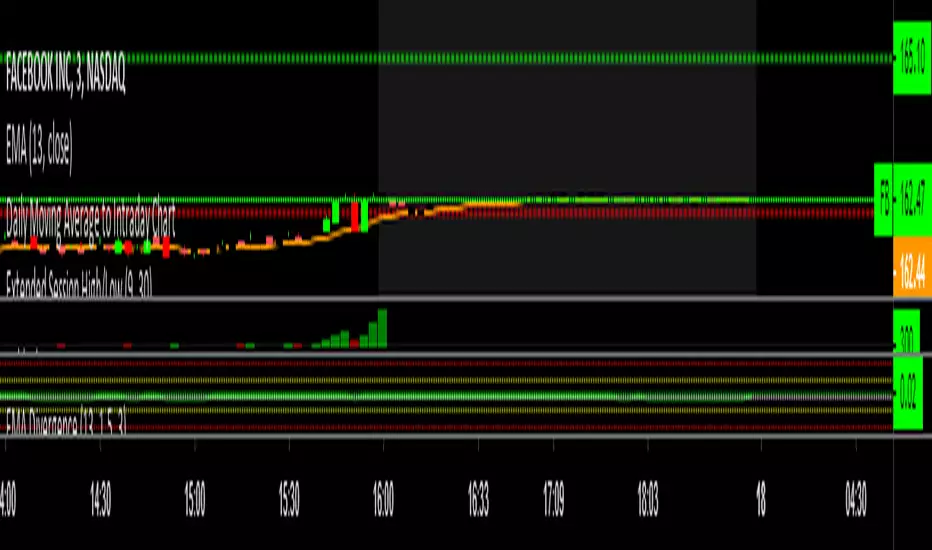
Real Price for Heikin Ashi ChartsThe indicator is in the top left of the screen! That's all there is, by design.
This is a super simple indicator that allows you to see what the real price of a candle was when using Heikin Ashi charts, while not cluttering up your screen.
HA charts are a great way to help those who can be spooked by the chaos of the markets (I'm one!), but they have a big drawback in that the price you see on a HA candle is often significantly different from the real price that you would trade on. This brings issues of unrealistic expectations of profits/losses, and also makes back testing a strategy very difficult. I still wouldn't recommend ever using TradingView's "strategy" tool when using HA charts, but using this indicator you can do accurate manual back tests.
There's nothing plotted on the screen given that there's no real point in it, but you can make the lines appear if you wish - just go into settings and change the transparency.
The order of the numbers on the indicator match the OHLC (Open, High, Low, Close) format.
There's also settings to turn off one or more of the OHLC values, simply open the settings and go to Inputs. This could be useful for some people, as the High and Low values of HA candles are the same as regular candles. Only the Open and Close are different.
Any queries let me know.
DreamsDefined


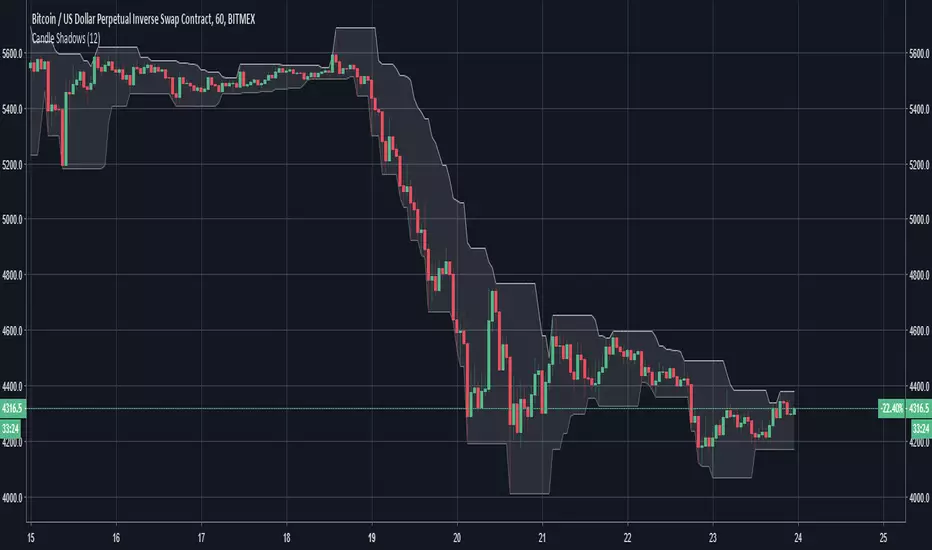
Candle ShadowsQuick and dirty script to show "shadows" off of wicks so they're easier to see, especially when zoomed out.

DRS - Daily Range SystemAn indicator that visualizes the evolution of a daily candle, inspired by a thread on forexfactory: www.forexfactory.com
Applied on a timeframe lower than D (actually lower than H4), it visualizes the evolution of the day's high and low, as well as mid and 25% and 75% lines.
The sole input parameters are the hour at which a day is supposed to start, and the extent of the "trade allowed" region as explained in the FF -1.44% thread.

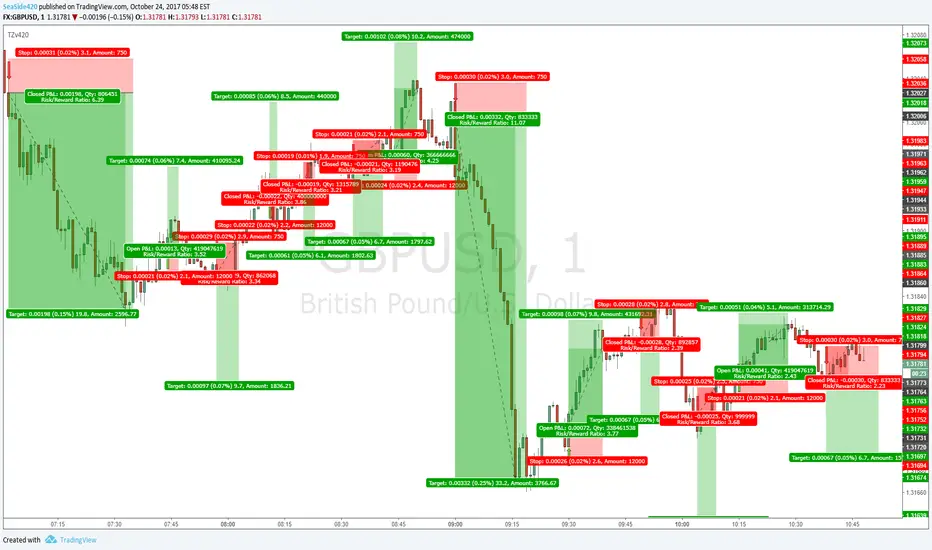
TZv420simplified version of TZ original. With Alert function
Transient Zones (v420)
I drew the trades on the arrow signals so you can see, its not all win, but with good money management and other ways of finding Target points (MA's or Pivots or Fib or Structure etc)
It is profitable. No repaint, No offset
High-Low Index [LazyBear]-- Fixed ---
Source: pastebin.com
Fixes an issue with "Combined" mode, using wrong symbols.
--- Original ---
The High-Low Index is a breadth indicator based on Record High Percent, which is based on new 52-week highs and new 52-week lows.
Readings below 50 indicate that there were more new lows than new highs. Readings above 50 indicate that there were more new highs than new lows. 0 indicates there were zero new highs (0% new highs). 100 indicates there was at least 1 new high and no new lows (100% new highs). 50 indicates that new highs and new lows were equal (50% new highs).
Readings consistently above 70 usually coincide with a strong uptrend. Readings consistently below 30 usually coincide with a strong downtrend.
More info:
stockcharts.com
List of my public indicators: bit.ly
List of my app-store indicators: blog.tradingview.com
Just noticed @Greeny has already published this -> Linking it here.
