Economic Profit (Fixed & Labeled) — Rated + PeersFRAC (Fundamental-Rated-Asset-Calculate)
FRAC is a fundamentals-driven tool designed to measure whether a company is creating or destroying shareholder value. Unlike surface ratios, FRAC uses Economic Profit (ROIC – WACC) as its engine, showing whether a business truly outperforms its cost of capital.
🔹 What FRAC Does
Calculates ROIC (Return on Invested Capital) vs. WACC (Weighted Average Cost of Capital).
Shows whether a company is creating or destroying shareholder value.
Uses tiered color coding for clarity:
🔵 Superior (Aqua Blue) → Top tier; best of the best.
🟣 Elite (Purple) → Strong value creation.
🟢 Positive (Green) → Solid, creating shareholder value.
🟡 Marginal (Yellow) → Barely covering cost of capital.
🔴 Negative (Red) → Value destruction.
🔹 Composite Ranking System (1–4)
FRAC also assigns each company a Composite Rank so you can compare multiple names side by side. The rank works like this:
Rank 1 → Superior (🔵 Aqua Blue)
Best possible rating; wide gap between ROIC and WACC.
Rank 2 → Elite (🟣 Purple)
Strongly positive; above-average capital efficiency.
Rank 3 → Positive (🟢 Green)
Creating value but only moderately; not a top compounder.
Rank 4 → Marginal/Negative (🟡/🔴)
Weak or destructive; either barely covering WACC or losing money on capital.
✅ How to Use the Ranks
When comparing a set of peers (e.g., NVDA, AMD, INTC):
FRAC will display each company’s color rating + composite rank (1–4).
You can instantly see who is strongest vs. weakest in the group.
Best decisions = overweight Rank 1 & 2 companies, avoid Rank 4 names.
🔹 Key Inputs Explained
Risk-Free Asset → Typically the 10-Year US Treasury yield (US10Y).
Corporate Tax Rate → Effective tax rate for the company’s country (e.g., USCTR).
Expected Market Return → Historical average ~8–10%, adjustable.
Beta Lookback Period → Controls how far back Beta is calculated (longer = more stable, shorter = more reactive).
👉 These must be set correctly for FRAC to calculate WACC accurately.
🔹 Example Comparison
NVDA: ROIC 25% – WACC 7% = +18% → 🔵 Superior → Rank 1
AMD: ROIC 17% – WACC 8% = +9% → 🟣 Elite → Rank 2
INTC: ROIC 11% – WACC 9% = +2% → 🟢 Positive → Rank 3
FSLY: ROIC 5% – WACC 10% = –5% → 🔴 Negative → Rank 4
🔹 Why It Matters
Buffett said: “The best businesses are those that can consistently generate returns on capital above their cost of capital.”
FRAC turns that into a visual + numeric rating system (1–4), making comparisons across peers simple and actionable.
🔹 Credit
FRAC was created by Hunter Hammond (Elite x FineFir), inspired by corporate finance models of Economic Profit and Economic Value Added (EVA).
⚠️ Disclaimer: FRAC is a research framework, not financial advice. Always pair with full due diligence.
Temel Analiz


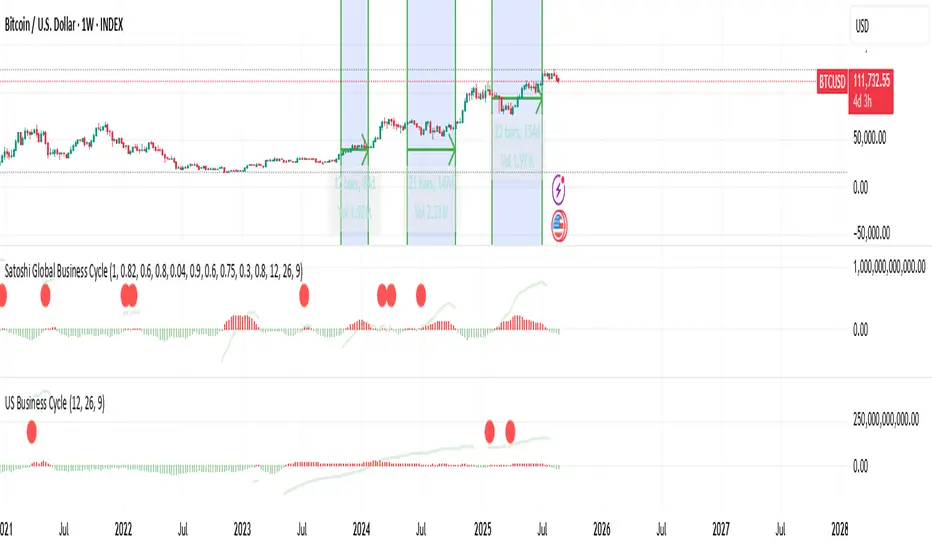
US Liquidity-Weighted Business Cycle📈 BTC Liquidity-Weighted Business Cycle
This indicator models the Bitcoin macro cycle by comparing its logarithmic price against a log-transformed liquidity proxy (e.g., US M2 Money Supply). It helps visualize cyclical tops and bottoms by measuring the relative expansion of Bitcoin price versus fiat liquidity.
🧠 How It Works:
Transforms both BTC and M2 using natural logarithms.
Computes a liquidity ratio: log(BTC) – log(M2) (i.e., log(BTC/M2)).
Runs MACD on this ratio to extract business cycle momentum.
Plots:
🔴 Histogram bars showing cyclical growth or contraction.
🟢 Top line to track the relative price-to-liquidity trend.
🔴 Cycle peak markers to flag historical market tops.
⚙️ Inputs:
Adjustable MACD lengths
Toggle for liquidity trend line overlay
🔍 Use Cases:
Identifying macro cycle tops and bottoms
Timing long-term Bitcoin accumulation or de-risking
Confirming global liquidity's influence on BTC price movement
Note: This version currently uses US M2 (FRED:M2SL) as the liquidity base. You can easily expand it with other global M2 sources or adjust the weights.
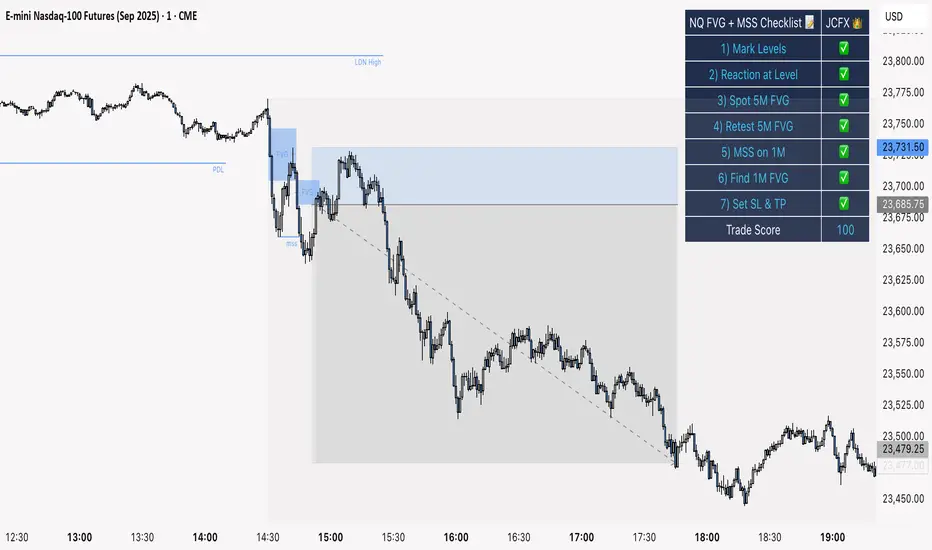
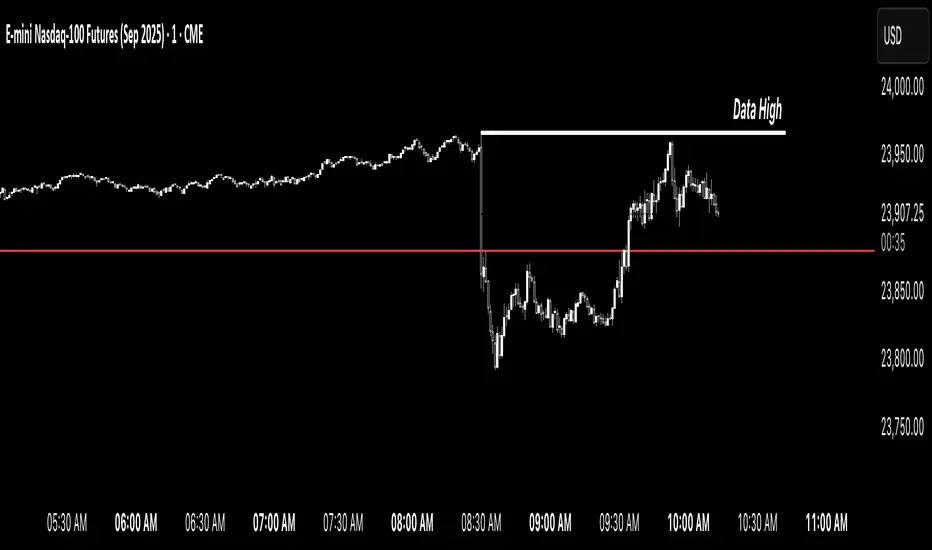
NQ FVG + MSS ChecklistThe NQ FVG + MSS Quick Checklist is a visual trading HUD for Nasdaq 100 (NQ) futures. It helps traders quickly track key setup elements: session & previous day levels, 5M FVG, retests, 1M MSS, and 1M FVG inside MSS.
Each step can be manually ticked, and a Trade Score shows setup strength at a glance. The checklist table sits on top of all chart elements for easy reference without interfering with your analysis.
Features:
Step-by-step NQ trading checklist
Manual inputs with visual ✅/❌
Trade Score for quick setup confirmation
Table overlay always on top of the chart
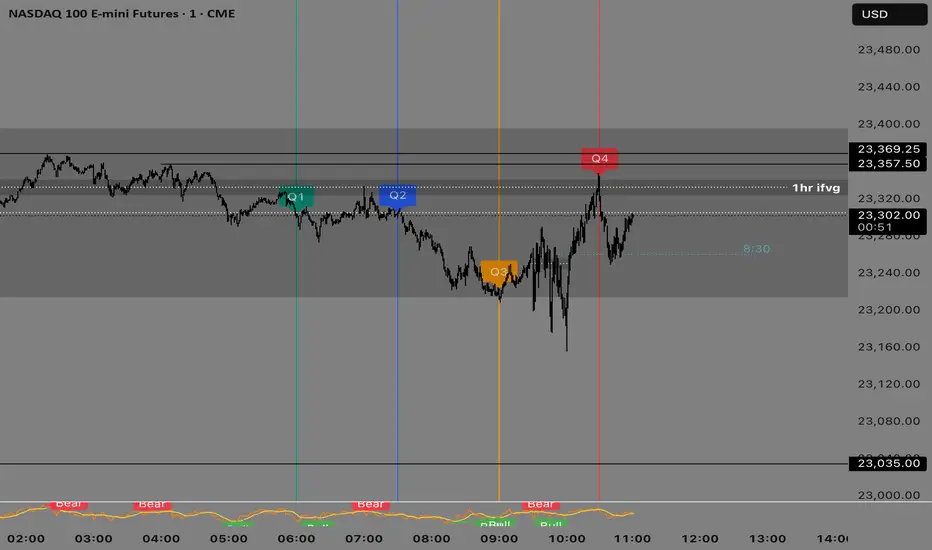
Quarterly Theory —Q1,Q2,Q3,Q4The Quarterly Theory Indicator is a trading tool designed to visualize the natural time-based cycles of the market, based on the principles of Quarterly Theory, popularized by the Inner Circle Trader (ICT). The indicator divides market sessions into four equal “quarters” to help traders identify potential accumulation, manipulation, and distribution phases (AMD model) and improve the timing of entries and exits.
Key Features:
Quarter Divisions (Q1–Q4):
Each market session (e.g., NY AM, London, Asia) is divided into four quarters.
Vertical lines mark the beginning of each quarter, making it easy to track session structure.
Optional labels show Q1, Q2, Q3, and Q4 directly on the chart.
True Open (Q2 Open):
The True Open is the opening price of Q2, considered a key reference point in Quarterly Theory.
A horizontal red line is drawn at the True Open price with a label showing the exact value.
This line helps traders filter bullish and bearish setups:
Buy below the True Open if the market is bullish.
Sell above the True Open if the market is bearish.
Session Awareness:
The indicator can automatically detect market sessions and reset lines and labels for each new session.
Ensures that only the current session’s True Open and quarter lines are displayed, reducing chart clutter.
Timeframe Flexibility:
Works on any chart timeframe (1-minute to daily).
Maintains accurate alignment of quarters and True Open regardless of the timeframe used.
Purpose of Quarterly Theory:
Quarterly Theory is based on the idea that market behavior is fractal and time-driven. By dividing sessions into four quarters, traders can anticipate potential market phases:
Q1: Initial price discovery and setup for the session.
Q2: Accumulation or manipulation phase, where the True Open is established.
Q3: Manipulation or Judas Swing phase designed to trap traders.
Q4: Distribution or trend continuation/reversal.
By visualizing these quarters and the True Open, traders can reduce ambiguity, identify high-probability setups, and improve their timing in line with the ICT AMD (Accumulation, Manipulation, Distribution) framework.
Forward P/E CalculatorI could not find a forward P/E indicator that gave me proper results. So here is mine.

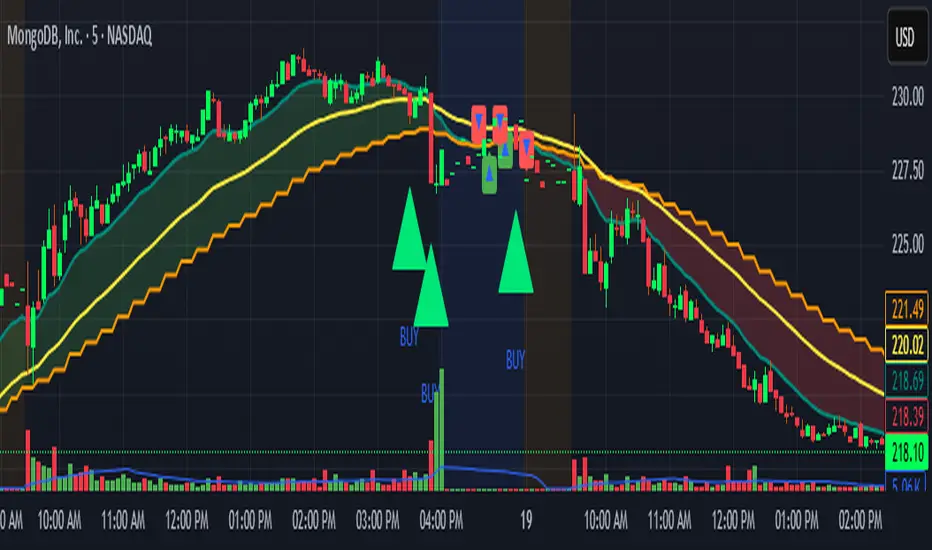
Locked 5m 13 EMA & 15m 20 EMA with Mid EMA & SignalsThis indicator overlays the 5-minute 13 EMA and the 15-minute 20 EMA on any chart timeframe up to 15 minutes, along with a mid EMA (5-minute 36-period) for reference.
Features include:
EMA Cross Detection: Shows bullish and bearish cross arrows when the 5m 13 EMA crosses the 15m 20 EMA.
EMA Fill: Highlights the area between the EMAs in green (bullish) or red (bearish).
Mid EMA Buy/Sell Signals: Generates buy signals when price touches the mid EMA in a bullish stack and sell signals in a bearish stack.
Custom Alerts: Alerts for EMA crosses, EMA stack direction, and mid EMA buy/sell triggers.
Timeframe Safety Warning: Alerts if applied on timeframes higher than 15 minutes.
Ideal For:
Traders who want a locked, non-repainting EMA setup for multi-timeframe analysis and clear entry/exit signals based on mid-range EMA interaction.
Inputs:
Show/Hide arrows for EMA crosses
Show/Hide fill between EMAs
Show/Hide mid EMA line
Show/Hide buy/sell signals
Fill transparency adjustment
SPX → NQ Levels ConverterSPX → NQ Levels Converter is a Pine Script indicator that projects key S&P 500 (SPX) levels onto the NASDAQ 100 (NQ) chart using a configurable conversion ratio.
• Dynamic ratio: calculates the live SPX/NQ ratio in real time.
• Static ratio: allows manual input of a fixed ratio.
• Supports up to 10 custom SPX levels, automatically converted into their equivalent NQ values.
• Each level is displayed with a line and label (SPX → NQ) with independent color settings.
• Advanced visualization controls:
• line extension (right, left, both, or fixed)
• line length & placement
• label side & offset.
• Lines and labels auto-update on every bar to stay accurate over time.
Use case: particularly useful for traders who track SPX option levels or support/resistance zones but execute trades on the NQ.

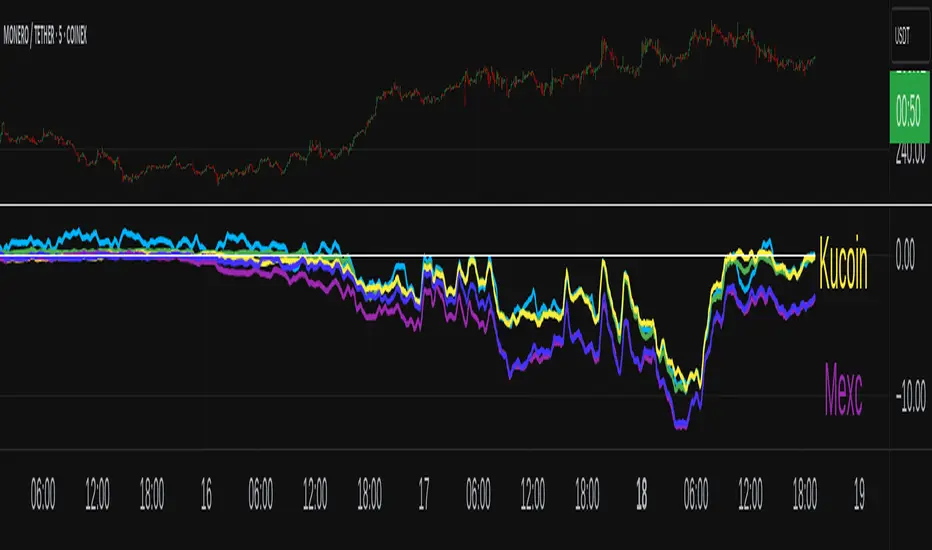
XMR Divergences vs KrakenSUMMARY
This script finds the percentage difference between Kraken, and multiple other exchanges, for the price of XMRUSD, and then runs a variable length moving average of those differences. Optionally, you can multiply by the reported volume of the exchange in question. Skip to "USAGE" at the bottom for a quick view of the settings. But I recommend reading DETAILED DESCRIPTION as well.
PURPOSE
The purpose of this script is to get a look into the relative funds flows of XMR between Kraken and the other exchanges. So long as an exchange withdraws are open: 1) Negative divergences indicate XMR outflows from the exchange under consideration, 2) Postive divergences indicate XMR inflows from Kraken to the exchange.
This appears to be moderately correlated with price movements in Monero (but not always). There is also the theory that positive accumulation is a leading indication of a growing probability of postive price action in the general crypto market, and negative accumulation is a leading indicator of an upcoming peak. In other words, exchanges like to accumulate Monero quietly during calm downtimes, and they like to manage its price from gaining too much attention (pump) during broad market positivity.
BACKGROUND
It's well known among XMR traders that most exchanges are operating on a heavy fractional reserve basis as regards Monero. The past 2 years have seen regular and repeated withdraw freezes, sometimes for weeks/months at a time. Occasionally, liquidity stress tests have been performed, with predictable results - none of these exchanges are able to continue supporting withdraws.
Kraken is the only exchange of meaningful volume that has never frozen withdraws for more than an hour or so. Thus, we theorize that Kraken is operating with all, or most of the XMR they claim to have.
Furthermore, we have seen in the past, large price negative price divergences of these fractional reserve exchanges relative to Kraken. As the social outcry grew stronger for this malfeasance, these exchanges have gone to greater lengths to hide their price divergences.
On minute-by-minute ; hour-by-hour basis, typically, a look with the naked eye would show oscillation around the zero point. But when you average it out, especially on lower timeframes (like the 1 and 5 min candles), you can very clearly see that when withdraws are shut down, these exchanges simultaneously diverge their prices downwards as well.
DETAILED DESCRIPTION
The ideal view of price divergence would compare second-by-second prices, and then run something like a rolling 4-hr or 1-day SMA to average out the overall divergences. However, due to limitations of TradingView, this is impractical/impossible for actual usage/viewing. As a result, a balance must be struck, when selecting the combination of the candle period, and the SMA lookback length.
I find that 5min candles, with a 48-period lookback (that equates to a rolling 4-hour SMA), offers the best view of recent and historical price divergence activity. This of course means that we're only sampling price divergences once every 5 minutes, but it still provides a decent look at what's happening. If this script gets popular, I wouldn't be surprised if these exchanges start timing their candle closes to mask their misdeeds, but that's of course speculative on my part.
The other important factor here, *IS TO MULTIPLY BY VOLUME*. Some of these no-volume exchanges have large price divergences. But if they're not doing any real volume, then it doesn't really have any real market impact. Thus, I recommend keeping the "Make volume adjustment" option on.
If that ends up happening, we'll have to infer that by comparing the difference in close prices, vs the difference in the highest or lowest intra-candle prices (wicks). Typically a divergence should have all 3 showing similar results.
Notes regarding "Sum_of_All": This only makes sense when multiplying by volume. So only check this if you also made the volume adjustment. Generally I believe that *Binance* sets the tone. However, we have seen numerous occasions where Binance diverges down, and the others diverge up. I believe this is a social influence tactic, since most people look at Binance price. Meanwhile, they're trying to accumulate some small amount on the other exchanges to minimize their overall loss. This of course assumes collusion by these exchanges, which is a high likely hood, seeing as how in May 2021, they all diverged together simultaneously (among other evidence).
USAGE
I recommend using your browser zoom, to see data beyond 1 month in the past.
Lookback - The number of candles over which to conduct a moving average. On 5-min candles for example, here's how the math works out:
12 - Equates to a 1 hr MA
24 - 2 hrs
48 - 4 hrs (default)
288 - 1 day
2880 - 10 days
Make Volume Adjustment - Recommend that you usually keep this on.
Line Widths - Set to preference
Show_Close_Price? - You can compute the difference at candle close. Or you can check the other boxes to compare the highest/lowest prices for intra candle prices (wicks).
Show Sum_of_All? - You can sum all of the differences, which only makes sense if you're making the volume adjustement. Default is off. Below, you can also choose which exchanges to include in the sum.
This works best on lower timeframes, like the 1m, 5, and 15m charts. I personally use 5m, with 48 or 96 length lookback. You get a better view of the real time price divergences that way.
AI Fib Strategy (Full Trade Plan)This indicator automatically plots Fibonacci retracements and a Golden Zone box (61.8%–65% retracement) based on the 4H candle body high/low.
Features:
Auto-detects session breaks or daily breaks (configurable).
Draws standard Fib retracement levels (0%, 23.6%, 38.2%, 50%, 61.8%, 78.6%, 100%).
Highlights the Golden Zone for high-probability trade entries.
Optional Take Profit extensions (TP1, TP2, TP3).
Fully compatible with Pine Script v6.
Usage:
Best applied on intraday charts (15m, 30m, 1H).
Use the Golden Zone for entry confirmations.
Combine with candlestick patterns, order blocks, or volume for stronger signals.

BTC Power Law Valuation BandsBTC Power Law Rainbow
A long-term valuation framework for Bitcoin based on Power Law growth — designed to help identify macro accumulation and distribution zones, aligned with long-term investor behavior.
🔍 What Is a Power Law?
A Power Law is a mathematical relationship where one quantity varies as a power of another. In this model:
Price ≈ a × (Time)^b
It captures the non-linear, exponentially slowing growth of Bitcoin over time. Rather than using linear or cyclical models, this approach aligns with how complex systems, such as networks or monetary adoption curves, often grow — rapidly at first, and then more slowly, but persistently.
🧠 Why Power Law for BTC?
Bitcoin:
Has finite supply and increasing adoption.
Operates as a monetary network , where Metcalfe’s Law and power laws naturally emerge.
Exhibits exponential growth over logarithmic time when viewed on a log-log chart .
This makes it uniquely well-suited for power law modeling.
🌈 How to Use the Valuation Bands
The central white line represents the modeled fair value according to the power law.
Colored bands represent deviations from the model in logarithmic space, acting as macro zones:
🔵 Lower Bands: Deep value / Accumulation zones.
🟡 Mid Bands: Fair value.
🔴 Upper Bands: Euphoria / Risk of macro tops.
📐 Smart Money Concepts (SMC) Alignment
Accumulation: Occurs when price consolidates near lower bands — often aligning with institutional positioning.
Markup: As price re-enters or ascends the bands, we often see breakout behavior and trend expansion.
Distribution: When price extends above upper bands, potential for exit liquidity creation and distribution events.
Reversion: Historically, price mean-reverts toward the model — rarely staying outside the bands for long.
This makes the model useful for:
Cycle timing
Long-term DCA strategy zones
Identifying value dislocations
Filtering short-term noise
⚠️ Disclaimer
This tool is for educational and informational purposes only . It is not financial advice. The power law model is a non-predictive, mathematical framework and does not guarantee future price movements .
Always use additional tools, risk management, and your own judgment before making trading or investment decisions.

NAS100 Component Sentiment Scanner# NAS100 Component Sentiment Scanner
## 🎯 Overview
The NAS100 Component Sentiment Scanner analyzes the top-weighted stocks in the NASDAQ-100 index to provide real-time bullish/bearish sentiment signals that can help predict NAS100 price movements. This indicator combines multiple technical analysis methods to give traders a comprehensive view of underlying market sentiment.
## 📊 How It Works
The indicator calculates sentiment scores for major NASDAQ-100 components (AAPL, MSFT, NVDA, GOOGL, AMZN, META, TSLA, AVGO, COST, NFLX) using:
- **RSI Analysis**: Identifies overbought/oversold conditions
- **Moving Average Trends**: Compares fast vs slow MA positioning
- **Volume Confirmation**: Validates moves with volume thresholds
- **Price Momentum**: Analyzes recent price direction
- **Market Cap Weighting**: Uses actual NASDAQ-100 weightings for accuracy
## 🚀 Key Features
### Real-Time Sentiment Analysis
- Weighted composite score based on individual stock analysis
- Color-coded sentiment line (Green = Bullish, Red = Bearish)
- Dynamic background coloring for strong signals
### Interactive Data Table
- Shows individual stock scores and signals
- Bullish/Bearish stock count summary
- Customizable position and size
### Smart Signal System
- **Bullish Signals**: Green triangle up when sentiment crosses threshold
- **Bearish Signals**: Red triangle down when sentiment falls below threshold
- **Alert Conditions**: Automatic notifications for signal changes
## ⚙️ Customization Options
### Technical Analysis Settings
- **RSI Period**: Adjust lookback period (default: 14)
- **RSI Levels**: Set overbought/oversold thresholds
- **Moving Averages**: Configure fast/slow MA periods
- **Volume Threshold**: Set volume confirmation multiplier
### Signal Thresholds
- **Bullish/Bearish Levels**: Customize trigger points
- **Strong Signal Levels**: Set extreme sentiment thresholds
- Fine-tune sensitivity to market conditions
### Display Options
- **Toggle Table**: Show/hide sentiment data table
- **Table Position**: 6 position options (Top/Bottom/Middle + Left/Right)
- **Table Size**: Choose from Tiny, Small, Normal, or Large
- **Background Colors**: Enable/disable signal backgrounds
- **Signal Arrows**: Show/hide buy/sell indicators
### Stock Selection
- **Individual Control**: Enable/disable any of the 10 major stocks
- **Dynamic Weighting**: Automatically adjusts calculations based on selected stocks
- **Flexible Analysis**: Focus on specific sectors or market leaders
## 📈 How to Use
### 1. Basic Setup
1. Add the indicator to your NAS100 chart
2. Default settings work well for most traders
3. Observe the sentiment line and signals
### 2. Signal Interpretation
- **Score > 30**: Bullish bias for NAS100
- **Score > 50**: Strong bullish signal
- **Score -30 to 30**: Neutral/consolidation
- **Score < -30**: Bearish bias for NAS100
- **Score < -50**: Strong bearish signal
### 3. Trading Strategies
**Trend Following:**
- Buy NAS100 when bullish signals appear
- Sell/short when bearish signals trigger
- Use background colors for quick visual confirmation
**Divergence Trading:**
- Watch for sentiment/price divergences
- Strong sentiment with weak NAS100 price = potential breakout
- Weak sentiment with strong NAS100 price = potential reversal
**Consensus Trading:**
- Monitor bullish/bearish stock counts in table
- 8+ stocks aligned = strong directional bias
- Mixed signals = wait for clearer consensus
### 4. Advanced Usage
- Combine with your existing NAS100 trading strategy
- Use multiple timeframes for confirmation
- Adjust thresholds based on market volatility
- Focus on specific stocks by disabling others
## 🔔 Alert Setup
The indicator includes built-in alert conditions:
1. Go to TradingView Alerts
2. Select "NAS100 Component Sentiment Scanner"
3. Choose from available alert types:
- NAS100 Bullish Signal
- NAS100 Bearish Signal
- Strong Bullish Consensus
- Strong Bearish Consensus
## 💡 Pro Tips
### Optimization
- **High Volatility**: Increase signal thresholds (±40, ±60)
- **Low Volatility**: Decrease thresholds (±20, ±40)
- **Day Trading**: Use smaller table, focus on real-time signals
- **Swing Trading**: Enable background colors, larger thresholds
### Best Practices
- Don't use as a standalone system - combine with price action
- Check individual stock table for context
- Monitor during market open for most reliable signals
- Consider earnings seasons for individual stock impacts
### Market Conditions
- **Trending Markets**: Higher accuracy, use with trend following
- **Ranging Markets**: Watch for false signals, increase thresholds
- **News Events**: Individual stock news can skew sentiment temporarily
## 🎨 Visual Guide
- **Green Line Above Zero**: Bullish sentiment building
- **Red Line Below Zero**: Bearish sentiment building
- **Background Color Changes**: Strong signal confirmation
- **Triangle Arrows**: Entry/exit signal points
- **Table Colors**: Quick sentiment overview
## ⚠️ Important Notes
- This indicator analyzes component stocks, not NAS100 directly
- Market cap weightings approximate real NASDAQ-100 weightings
- Sentiment can change rapidly during volatile periods
- Always use proper risk management
- Combine with other technical analysis tools
## 🔧 Troubleshooting
- **No signals**: Check if thresholds are too extreme
- **Too many signals**: Increase threshold sensitivity
- **Table not showing**: Ensure "Show Sentiment Table" is enabled
- **Missing stocks**: Verify individual stock toggles in settings
---
**Suitable for**: Day traders, swing traders, NAS100 specialists, index traders
**Best Timeframes**: 5min, 15min, 1H, 4H
**Market Sessions**: US market hours for highest accuracy

Extended CANSLIM Indicator❖ Extended CANSLIM Indicator.
The Extended CANSLIM indicator is an indicator that concentrates all the tools usually used by CANSLIM traders.
It shows a table where all the stock fundamental information is shown at once first for the last quarter and then up to 5 years back.
The fundamental data is checked against well known CANSLIM validation criteria and is shown over 4 state levels.
1. Good = Value is CANSLIM Compliant.
2. Acceptable = Value is not CANSLIM compliant but still good. value is shown with a lighter background color.
3. Warning = Value deserves special attention. Value is shown over orange background color.
3. Stop = Value is non CANSLIM compliant or indicates a stop trading condition. Value is shown over red background color.
The indicator has also a set of technical tools calculated on price or index and shown directly on the chart.
❖ Fundamental data shown in the table.
The table is arranged in 4 sets of data:
1. Table Header, showing Indicator and Company data.
2. CANSLIM.
3. 3Rs: RS Rating, Revenue and ROE.
4. Extra Data: Piotroski score, ATR, Trend Days, D to E, Avg Vol and Vol today.
Sets 3 and 4 can be hidden from the table.
❖ Indicator and Compay Data.
The table header shows, Indicator name and version.
It then displays Company Name, sector and industry, human size and its capitalization.
❖ CANSLIM Data.
Displays either genuine CANSLIM data from TradinView or custom data as best effort when that data cannot be obtained in TV.
C = EPS diluted growth, Quarterly YoY.
>= 25% = Good, >= 0% = Acceptable, < 0% = Stop
A = EPS diluted growth, Annual YoY.
>= 25% = Good, >= 0% = Acceptable, < 0% = Stop
N = New High as best effort (Cust).
Always Good
S = Float shares as best effort.
Always Good
L = One year performance relative to S&P 500 (Cust),
Positive : 0% .. 50% = Neutral, 50%+ = Leader, 80%+ = Leader+, 100%+ = Leader++
Negative : 0% .. -10% = Laggard, -10% .. -30% = Laggard+, -30%+ = Laggard++
>= 50% = Good, >= 0% = Acceptable, >= -10% Warning, < -10% = Stop
I = Accumulation/Distribution days over last 25 days as a clue for institutional support (Cust).
A delta is calculated by subtracting Distribution to Accumulation days.
> 0 = Good, = 0 = Acceptable, < 0 = Warning, < -5 = Stop
M = Market direction and exposure measured on S&500 closing between averages (Cust).
Varies from 0% Full Bear to 100% Full Bull
>= 80% = Good, >= 60% = Acceptable, >= 40% = Warning, < 40% = Stop
❖ Extra non CANSLIM Data.
RS = RS Rating.
>= 90 = Good, >= 80 = Accept, >= 50 = Warning, < 50 = Stop
Rev. = Revenue Growth Quarterly YoY.
>= 0% = Good, <0% = Stop
ROE = Return on Equity, Quarterly YoY.
>= 17% = Good, >= 0% = Acceptable, < 0% = Stop
Piotr. = Piotroski Score, www.investopedia.com (TV)
>= 7 = Good, >= 4 = Acceptable, < 4 = Stop
ATR = Average True Range over the last 20 days (Cust).
0% - 2% = Acceptable, 2% - 4% = Ideal, 4% - 6% = Warning, 5%+ = Stop.
Trend Days = Days since EMA150 is over EMA200 (Cust).
Always Good
D. to E. = Days left before Earnings. Maybe not a good idea buying just before earnings (Cust).
>= 28 = Good, >= 21 = Acceptable, >= 14 = Warning, < 14 = Stop
Avg Vol. = 50d Average Volume (Cust).
>= 100K = Good, < 100K = Acceptable
Vol. Today = Today's percentage volume compared to 50d average (Cust).
Always Good.
❖ Historical Data.
Optionally selectable historical data can be displayed for C, A, Revenue and ROE up to 20 quarters if available.
Quarterly numbers can also be displayed for A, C and Revenue.
Information can be shown in Chronological or Reverse Chronological order (default).
Increasing growth quarters are shown in white, while diminuing ones are shown in Yellow.
Transition from Losing to Profitable quarters are shown with an exclamation mark ‘!’
Finally, losing quarters are shown between parenthesis.
❖ MAs on chart.
Displays 200, 100, 50 and 20 days MAs on chart.
The MAs are also automatically scaled in the 1W time frame.
❖ New 52 Week High on chart.
A sun is shown on the chart the first time that a new 52 week high is reached.
The N cell shows a filled sun when a 52 week high is no older than a month, an lighter sun when it’s no older than a quarter or a moon otherwise.
❖ Pocket Pivots on chart.
Small triangles below the price are signaling pocket pivots.
❖ Bases on chart, formerly Darvas Boxes.
Draw bases as defined by Darvas boxes, both top or bottom of bases can be selected to be shown in order to only show resistance or support.
❖ Market exposure/direction indicator.
When charting S&P500 (SPX), Nasdaq 100 Index (NDX), Nasdaq composite (IXIC) or Dow Jownes Index (DJIA), the indicator switches to Market Exposure indicator, showing also Accumulation/Distribution days when volume information is available. This indication which varies from 0% to 100% is what is shown under the M letter in the CANSLIM table which is calculated on the S&P500.
❖ Follow Through Days indicator.
If you are an adept of the Low-cheat entry, then you will be highly interested by the Follow Through days indicator as measured in the S&P 500 and shown as diamonds on the chart.
The follow-through days are calculated on S&P500 but shown in current stock chart so you don’t need to chart the S&P 500 to know that a follow through day occurred.
Follow Through days show correctly on Daily time frame and most are also shown on the Weekly time frame as well.
They are also classified according to the market zone in which they occur:
0%-5% from peak = Pullback : FT day is not shown.
5%-10% from peak = Minor Correction : Minor FT days is shown.
10%-20% from peak = Correction : Intermediate FT days us shown
20+% from peak = Bear Market : Makor FT days is shown
❖ RS Line and Rating indicator.
A RS Line and Rating indicator can be added to the chart.
Relative Strength Rating Accuracy.
Please note that the RS Rating is not 100% accurate when compared to IBD values.
❖ Earning Line indicator.
An Earning Line indicator can be added to the chart.
❖ ATR Bands and ATR Trade calculator.
The motivation for this calculator came from my own need to enter trades on volatile stocks where the simple 7% Stop Loss rule doest not work.
It simply calculates the number of shares you can buy at any moment based on current stock price and using the lower ATR band as a stop loss.
A few words about the ATR Bands.
On this indicator the ATR bands are not drawn as a classical channel that follows the price.
The lower band is drawn as a support until it’s broken on a closing basis. It can’t be in a down trend.
The upper band is drawn as a resistance until it’s broken on a closing basis. It can’t be in an up trend.
The idea is that when price starts to fall down from a peak, it should not violate its lower band ATR and that means that we can use that level as a Stop Loss.
You must look back for the stock volatility and find out which ATR multiplier works well meaning that the ATR bands are not violated on normal pullbacks. By default, the indicator uses 5x multiplier.
❖ Extra things, visual features and default settings.
The first square cell of current quarter displays a check mark ‘V’ if the CANSLIM criteria is OK or acceptable or a cross ‘X’ otherwise.
The first square cell of historical C and Rev show respectively the count of last consecutive positive quarters.
There are different color themes from “Forest” to “Space” you can chose from to best fit your eyes.
You also have different table sizes going from “Micro” to “Huge” for better adjustment to the size of your display.
The default settings view show: Pocket Pivots, FT Days, MA50, RS Line and ATR Bands.
That's all, Enjoy!

EPS YoY% Labels (MarketSurge / IBD style)This script automatically calculates and displays year-over-year quarterly EPS growth (%) directly on the chart, in the same style used by MarketSurge / IBD.
🔹 Key Features
Detects each quarterly earnings report and shows EPS YoY growth as a label above the bar.
Works with both reported EPS and standardized EPS (selectable in settings).
Positive growth is highlighted in green, while negative growth is highlighted in red.
Optional setting to hide negative results for a cleaner, bullish-focused view.
Adjustable decimal precision (0–2 decimals) for percentage display.
🔹 Why it’s useful
EPS growth is one of the core fundamentals that top traders like Mark Minervini and William O’Neil (IBD) focus on when screening for market leaders.
Now you can see at a glance how a stock’s earnings power is accelerating or decelerating — without flipping between platforms.
Combine with Relative Strength (RS) analysis and price/volume patterns for a complete growth-stock trading workflow.
🔹 Example
If a company reports EPS of $1.20 this quarter vs. $0.80 in the same quarter last year, the label will display:
EPS +50% (green).

Currency Strength v3.0Currency Strength v3.0
Summary
The Currency Strength indicator is a powerful tool designed to gauge the relative strength of major and emerging market currencies. By plotting the True Strength Index (TSI) of various currency indices, it provides a clear visual representation of which currencies are gaining momentum and which are losing it. This indicator automatically detects the currency pair on your chart and highlights the corresponding strength lines, simplifying analysis and helping you quickly identify potential trading opportunities based on currency dynamics.
Key Features
Comprehensive Currency Analysis: Tracks the strength of 19 currencies, including major pairs and several emerging market currencies.
Automatic Pair Detection: Intelligently identifies the base and quote currency of the active chart, automatically highlighting the relevant strength lines.
Dynamic Coloring: The base currency is consistently colored blue, and the quote currency is colored gold, making it easy to distinguish between the two at a glance.
Non-Repainting TSI Calculation: Uses the True Strength Index (TSI) for smooth and reliable momentum readings that do not repaint.
Customizable Settings: Allows for adjustment of the fast and slow periods for the TSI calculation to fit your specific trading style.
Clean Interface: Features a minimalist legend table that only displays the currencies relevant to your current chart, keeping your workspace uncluttered.
How It Works
The indicator pulls data from major currency indices (like DXY for the US Dollar and EXY for the Euro). For currencies that don't have a dedicated index, it uses their USD pair (e.g., USDCNY) and inverts the calculation to derive the currency's strength relative to the dollar. It then applies the True Strength Index (TSI) to this data. The TSI is a momentum oscillator that is less volatile than other oscillators, providing a more reliable measure of strength. The resulting values are plotted on the chart, allowing you to see how different currencies are performing against each other in real-time.
How to Use
Trend Confirmation: When the base currency's line is rising and above the zero line, and the quote currency's line is falling, it can confirm a bullish trend for the pair. The opposite would suggest a bearish trend.
Identifying Divergences: Look for divergences between the currency strength lines and the price action of the pair. For example, if the price is making higher highs but the base currency's strength is making lower highs, it could signal a potential reversal.
Crossovers: A crossover of the base and quote currency lines can signal a shift in momentum. A bullish signal occurs when the base currency line crosses above the quote currency line. A bearish signal occurs when it crosses below.
Overbought/Oversold Levels: The horizontal dashed lines at 0.5 and -0.5 can be used as general guides for overbought and oversold conditions, respectively. Strength moving beyond these levels may indicate an unsustainable move that is due for a correction.
Settings
Fast Period: The short-term period for the TSI calculation. Default is 7.
Slow Period: The long-term period for the TSI calculation. Default is 15.
Index Source: The price source used for the calculations (e.g., Close, Open). Default is Close.
Base Currency Color: The color for the base currency line. Default is Royal Blue.
Quote Currency Color: The color for the quote currency line. Default is Goldenrod.
Disclaimer
This indicator is intended for educational and analytical purposes only. It is not financial advice. Trading involves substantial risk, and past performance is not indicative of future results. Always conduct your own research and risk management before making any trading decisions.

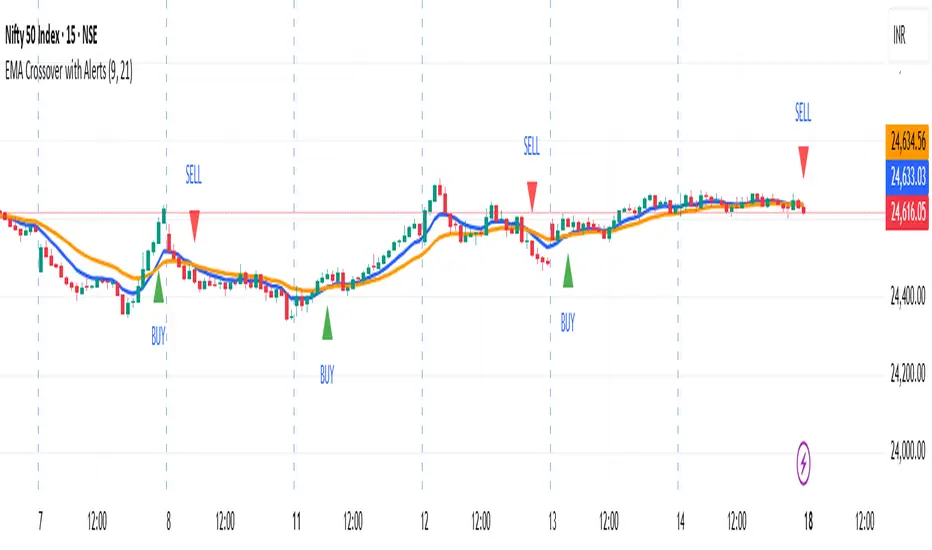
EMA Crossover with AlertsIndicator with Fast and Slow EMA Crossovers, includes alerts on such cross overs
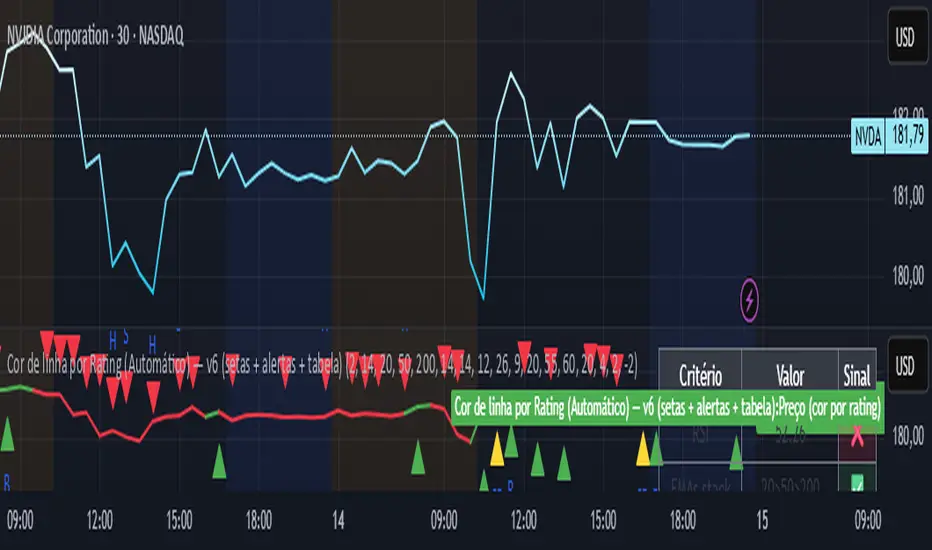
Line color best indices grouped by Artificial Intelligence
The script uses the best buy indicators, such as moving average crossovers, RSI, and others selected by AI. The idea is to determine whether the stock is classified as a strong buy (yellow line), a buy (green line), or a red (sell)
4 EMA Multi-Length / Abbas4 EMA Multi Length indicator
in case you need to make 4 different EMA/s for your chart
for swinging you'll need 50/100/150/200
for scalping perhaps 9/20/50
this indicator allows you to combine up to 4 EMAS in one indicator instead of 4 separate ones.

Trading bot gridsGuide: Price Lines – Arithmetic vs. Geometric
This script draws horizontal price lines (grids) between a start price and an end price.
You can choose whether the lines are distributed evenly (arithmetic) or by percentage (geometric).
🔧 Inputs
Start Price → Lower or upper boundary of the price range.
End Price → Opposite boundary of the price range.
Number of Lines → Total number of lines to be drawn between the start and end prices.
Distribution →
Arithmetic: Fixed USDT distance between each line.
Geometric: Fixed percentage distance between each line.
Grid Color → Color of the drawn lines.
📈 How it Works
The script calculates the lower (lo) and upper (hi) boundaries, regardless of which is entered first.
Arithmetic distribution: Each line is spaced by a fixed amount in USDT.
Geometric distribution: Each line is spaced by the same percentage difference from the previous one.
Lines are created only once at the first bar and remain on the chart.
All lines are extended across the entire visible chart.
💡 Tips
Useful for Grid Bot backtesting or visualizing price zones.
Works for both long and short price ranges.
In geometric mode, lines appear closer together near the lower price range and farther apart toward the upper range.

FVG + Bank Level Targeting w/ Alert TriggerDescription:
FVG + Bank Level Targeting w/ Alert Trigger is an intraday trading tool that combines Fair Value Gap (FVG) detection with dynamic institutional targeting using prior-day, weekly, and monthly high/low "Bank Levels." When a Fair Value Gap is detected, the script projects a logical target using the closest bank level in price's direction, and visually extends that level on your chart.
This tool is designed to help traders anticipate where price is most likely to move after an FVG appears — and alert them when price breaks through key target zones.
How It Works:
* Bank Level Calculation:
The indicator calculates Daily, Weekly, and Monthly high and low levels from the previous bar of each respective timeframe.
These are optionally plotted on the chart with a slight tick offset to avoid overlap with price.
* FVG Detection:
Bullish FVGs are defined by a gap between the low of the current candle and the high two candles prior, with a confirming middle candle.
Bearish FVGs follow the reverse pattern.
Once detected, the script finds the nearest unbroken institutional level (Bank Level) in the direction of the FVG and anchors a target line at that price level.
* Target Line Projection:
The script draws a persistent horizontal line (not just a plotted value) at the selected bank level.
These lines automatically extend a set number of bars into the future for clarity and trade planning.
* Breakout Detection:
When price crosses above a Bull Target or below a Bear Target, the script triggers a breakout condition.
These breakouts are useful for trade continuation or reversal setups.
* Alerts:
Built-in alert conditions notify you in real time when price crosses above or below a target.
These can be used to set TradingView alerts for your preferred Futures symbols or intraday pairs.
Parameters:
Tick Offset Multiplier: Adds distance between price and plotted levels.
Show Daily/Weekly/Monthly Levels: Toggle for each institutional level group.
FVG Extend Right (bars): Controls how far the target lines extend into the future.
Color Controls: Customize colors for FVG fill and target lines.
Use Case:
This indicator is designed for traders who want to:
Trade continuation or reversal moves around institutional price zones
Integrate Fair Value Gap concepts with more logical, historically anchored price targets
Trigger alerts when market structure evolves around key levels
It is especially useful for intraday Futures traders on the 15-minute chart or lower, but adapts well to any instrument with strong reactionary behavior at prior session highs/lows.

US Macro Cycle (Z-Score Model)US Macro Cycle (Z-Score Model)
This indicator tracks the US economic cycle in real time using a weighted composite of seven macro and market-based indicators, each converted into a rolling Z-score for comparability. The model identifies the current phase of the cycle — Expansion, Peak, Contraction, or Recovery — and suggests sector tilts based on historical performance in each phase.
Core Components:
Yield Curve (10y–2y): Positive & steepening = growth; inverted = slowdown risk.
Credit Spreads (HYG/LQD): Tightening = risk-on; widening = risk-off.
Sector Leadership (Cyclicals vs. Defensives): Measures market leadership regime.
Copper/Gold Ratio: Higher copper = growth signal; higher gold = defensive.
SPY vs. 200-day MA: Equity trend strength.
SPY/IEF Ratio: Stocks vs. bonds relative strength.
VIX (Inverted): Low/falling volatility = supportive; high/rising = risk-off.
Methodology:
Each series is transformed into a rolling Z-score over the selected lookback period (optionally using median/MAD for robustness and winsorization to clip outliers).
Z-scores are combined using user-defined weights and normalized.
The smoothed composite is compared against phase thresholds to classify the macro environment.
Features:
Customizable Weights: Emphasize the indicators most relevant to your strategy.
Adjustable Thresholds: Fine-tune cycle phase definitions.
Background Coloring: Visual cue for the current phase.
Summary Table: Displays composite Z, confidence %, and individual Z-scores.
Alerts: Trigger when the phase changes, with details on the composite score and recommended tilt.
Use Cases:
Align sector rotation or relative strength strategies with the macro backdrop.
Identify favorable or defensive phases for tactical allocation.
Monitor macro turning points to manage portfolio risk.
It's doesn't fill nan gaps so there is quite a bit of zeroes, non-repainting.
