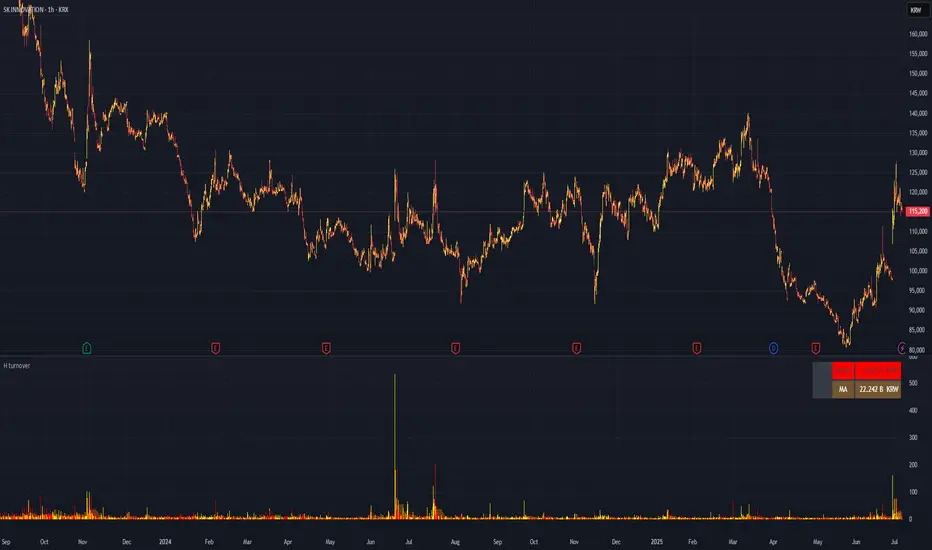
H turnoverTrading Value refers to the total monetary amount of all transactions for a particular stock or the entire market over a specific period. It is calculated by multiplying the trading volume (the number of shares traded) by the price at which they were traded. For example, if 10,000 shares of a stock are traded in a day at an average price of 50,000 KRW, the trading value for that day would be 500,000,000 KRW.
Key points about trading value:
Market Activity and Liquidity: A high trading value indicates an active and liquid market.
Flow of Investment Funds: Increasing trading value suggests more money is flowing into the market or a particular stock.
Relationship with Price Movements: When both trading value and price rise together, it often signals strong buying interest. Conversely, significant price changes with low trading value may be less reliable.
Market Sentiment Indicator: Changes in trading value can reflect shifts in investor interest and sentiment.
In summary, trading value is the total amount of money exchanged in trades and serves as an important indicator of market activity, liquidity, and investor sentiment.
Temel Analiz
Quarterly Revenue & Growthinspired by TrendSpider. Monitoring a company's earning revenue quarter by quarter.

Dynamic VWAP: Fair Value & Divergence SuiteDynamic VWAP: Fair Value & Divergence Suite
Dynamic VWAP: Fair Value & Divergence Suite is a comprehensive tool for tracking contextual valuation, overextension, and potential reversal signals in trending markets. Unlike traditional VWAP that anchors to the start of a session or a fixed period, this indicator dynamically resets the VWAP anchor to the most recent swing low. This design allows you to monitor how far price has extended from the most recent significant low, helping identify zones of potential profit-taking or reversion.
Deviation bands (standard deviations above the anchored VWAP) provide a clear visual framework to assess whether price is in a fair value zone (±1σ), moderately extended (+2σ), or in zones of extreme extension (+3σ to +5σ). The indicator also highlights contextual divergence signals, including slope deceleration, weak-volume retests, and deviation failures—giving you actionable confluence around potential reversal points.
Because the anchor updates dynamically, this tool is particularly well suited for trend-following assets like BTC or stocks in sustained moves, where price rarely returns to deep negative deviation zones. For this reason, the indicator focuses on upside extension rather than symmetrical reversion to a long-term mean.
🎯 Key Features
✅ Dynamic Swing Low Anchoring
Continuously re-anchors VWAP to the most recent swing low based on your chosen lookback period.
Provides context for trend progression and overextension relative to structural lows.
✅ Standard Deviation Bands
Plots up to +5σ deviation bands to visualize levels of overextension.
Extended bands (+3σ to +5σ) can be toggled for simplicity.
✅ Conditional Zone Fills
Colored background fills show when price is inside each valuation zone.
Helps you immediately see if price is in fair value, moderately extended, or highly stretched territory.
✅ Divergence Detection
VWAP Slope Divergence: Flags when price makes a higher high but VWAP slope decelerates.
Low Volume Retest: Highlights weak re-tests of VWAP on low volume.
Deviation Failure: Identifies when price reverts back inside +1σ after closing beyond +3σ.
✅ Volume Fallback
If volume is unavailable, uses high-low range as a proxy.
✅ Highly Customizable
Adjust lookbacks, show/hide extended bands, toggle fills, and enable or disable divergences.
🛠️ How to Use
Identify Buy and Sell Zones
Price in the fair value band (±1σ) suggests equilibrium.
Reaching +2σ to +3σ signals increasing overextension and potential areas to take profits.
+4σ to +5σ zones can be used to watch for exhaustion or mean-reversion setups.
Monitor Divergence Signals
Use slope divergence and deviation failures to look for confluence with overextension.
Low volume retests can flag rallies lacking conviction.
Adapt Swing Lookback
30–50 bars: Faster re-anchoring for swing trading.
75–100 bars: More stable anchors for longer-term trends.
🧭 Best Practices
Combine the anchored VWAP with higher timeframe structure.
Confirm signals with other tools (momentum, volume profiles, or trend filters).
Use extended deviation zones as context, not as standalone signals.
⚠️ Disclaimer
This script is for educational and informational purposes only. It does not constitute financial advice or a recommendation to buy or sell any security or asset. Always do your own research and consult a qualified financial professional before making any trading decisions. Past performance does not guarantee future results.

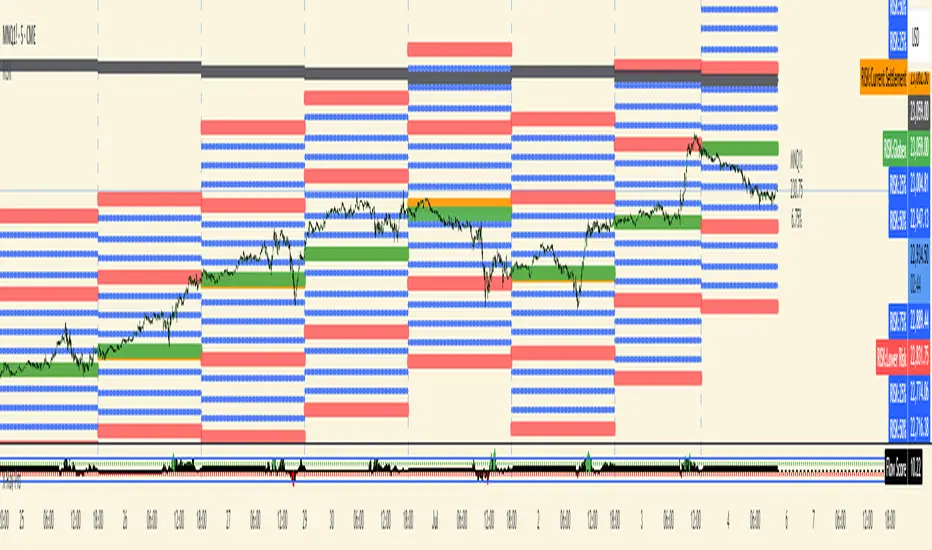
RISK## Main Purpose
The indicator calculates and displays risk levels based on margin requirements and daily settlement prices, helping traders visualize their potential risk exposure.
## Key Features
**Inputs:**
- **Margin for Calculation**: The CME long margin requirement for the asset
- **HTF Margin Line**: An anchor point for higher timeframe margin calculations
**Core Calculations:**
1. **Settlement Price Tracking**: Captures daily settlement prices during specific session times (6:58-6:59 PM ET for close, 6:00-6:01 PM ET for new day open)
2. **Risk Percentage**: Calculates `margin / (point value × settlement price)` - with special handling for Micro contracts (symbols starting with "M") that uses 10× point value
3. **Risk Intervals**: Determines price intervals representing one margin unit of risk
## Visual Display
The indicator plots multiple risk levels on the chart:
- **Settlement price** (orange circles)
- **Globex open** (green circles)
- **Upper/Lower Risk levels** (red circles) - one and two risk intervals away
- **Subdivision levels** (blue crosses) - 25%, 50%, and 75% of each risk interval
- **MHP+ level** (black crosses) - HTF anchor adjusted by risk percentage
- **HTF Anchor** (black crosses)
## Practical Use
This helps futures traders:
- Visualize how far price can move before hitting margin calls
- See risk levels relative to daily settlements
- Plan position sizing and risk management
- Understand exposure in terms of actual margin requirements
The indicator essentially transforms abstract margin numbers into concrete price levels on the chart, making risk management more visual and intuitive.
BTC SmartMoney + SQZMOM + EMA + Cloud + Trailing Stop (v2.5)🚀 BTC 15-Minute Smart Strategy: SmartMoney + SQZMOM + EMA + Trailing Stop
Designed specifically for the fast-paced and volatile crypto market, this strategy is finely tuned to deliver maximum performance on Bitcoin’s 15-minute chart.
🌟 Key Features:
SmartMoney Concepts (SMC) based CHoCH signals to detect market structure shifts and capture early trend reversals.
SQZMOM (Squeeze Momentum Oscillator) to gauge strong volatility and momentum confluence.
50 & 200 EMA Cloud combining short-term and long-term trend filters for reliable market direction.
ATR-based and manually adjustable Trailing Stop for flexible and automated risk management.
Scientifically optimized Take Profit and Stop Loss levels to minimize losses and maximize gains.
Clear exit labels on chart for real-time trade tracking and decision making.
🔥 Why Choose This Strategy?
Provides fast and reliable signals on 15-minute timeframe, protecting you against sudden market moves.
Maximizes profits with trailing stops while keeping risks controlled.
Built on professional financial models, ideal for both beginners and experienced traders.
📈 How to Use
Easily deploy on TradingView with flexible parameters that adjust to your trading style. Automates entry and exit decisions based on real-time market conditions.
A powerful companion for traders who want a reliable yet aggressive approach to BTC trading on the 15-minute timeframe.

Shavarie's Sniper LineShavarie’s Sniper Line is a precision confirmation tool built for high-quality entries — not noisy signals.
It activates only when all 3 conditions agree:
🔁 Momentum bend detection
💧 Money Flow Index (MFI) pressure
🔺 Delta volume strength (emulated from price/volume flow)
When all conditions align, the Sniper Line shifts to:
+1 for potential buy zone
-1 for potential sell zone
0 when neutral — no action
Best used in combination with supply/demand zones, Heikin Ashi, or larger trend structures. Built for traders who value patience, precision, and massive R:R setups.

Red Report FilterHello Traders,
This script will make your everyday trading sessions a lot less stressful if you're having to watch for 'Red' restricted reports.
You can set up to five reports for the day, with a selector for either: 'Red' / 'Orange'
Super simple to update manually, usually less than 15s. You do need to pull the information from ForexFactory.com or your required feed daily.
No need to worry about audio fails; the alarm background visually updates as price candles start to sweep thru the preset time window.
Default window settings are for Red Reports, '15m Before' / '6m After', for a 5m x 5m window.
I like the '15m Before' because it gives me a buffer to react to if I'm managing an open trade.
Click the tool-tip for more details.
PLEASE NOTE: Time-Zone is hard-coded UTC -4. Make the appropriate adjustment to a different zone if necessary.
Let me know how it works for you.
Thx!

Intermarket Analisis V.1What is Intermarket Analysis?
Intermarket analysis looks at how various asset classes influence each other. The key idea is that markets are interconnected, and movements in one can signal or predict movements in another. For example:
Stocks and Bonds: Rising bond yields (e.g., US 10-year Treasury) often pressure stock prices downward.
Commodities and Forex: A rising US Dollar (USD) typically weakens gold (XAU/USD) prices due to their inverse relationship.
Forex and Equities: Strong economic data boosting equities might strengthen the USD.
This method helps you confirm trends, anticipate reversals, or avoid false signals in your EMA 10/20 crossover strategy.
Key Intermarket Relationships
USD Index (DXY) and Gold (XAU/USD):
Correlation: Inverse. When DXY rises (stronger USD), gold often falls, and vice versa.
Indicator: Track DXY on a separate chart. Use a 50-period SMA or RSI to spot overbought/oversold conditions in USD strength.
Application: If your EMA 10/20 gives a buy signal on gold but DXY is overbought (RSI > 70), it might be a false signal—wait for DXY to cool off.
US 10-Year Treasury Yields and Equities (e.g., S&P 500):
Correlation: Inverse. Higher yields increase borrowing costs, pressuring stocks.
Indicator: Use a 200-day EMA on yields (e.g., ^TNX) and compare with S&P 500’s 50-day EMA.
Application: If yields are trending up (above 200 EMA) while your EMA 10/20 signals a stock buy, consider it risky—cross-check with macro data.
Crude Oil (WTI/Brent) and Gold:
Correlation: Positive. Both are inflation hedges, so they often move together during economic uncertainty.
Indicator: Apply a MACD (12, 26, 9) on oil prices to confirm trend direction.
Application: If oil’s MACD shows a bullish crossover and your gold buy signal aligns, it strengthens the case for a trend.
Bond Yields and USD:
Correlation: Positive. Rising yields support a stronger USD.
Indicator: Use a Stochastic Oscillator (14, 3, 3) on DXY to spot momentum shifts.
Application: If Stochastic is overbought on DXY and yields are high, a gold sell signal from EMA 10/20 might be more reliable.
How to Apply Intermarket Analysis to Your EMA 10/20 Strategy
Your current strategy uses EMA 10/20 crossovers for entry/exit, with SL at swing low/high and no TP until an opposite crossover. Here’s how to integrate intermarket analysis:
Confirmation: Before acting on a buy signal (EMA 10 > EMA 20), check if DXY is weakening (e.g., below 50 SMA) or oil is rising (MACD bullish). This supports a gold uptrend.
Divergence Warning: If your EMA 10/20 buy signal occurs but DXY is trending up (strong USD) or yields are spiking, it might indicate a false breakout—hold off.
Macro Context: On July 02, 2025, 08:30 PM WIB, watch for upcoming US Jobless Claims (3-4 July). A weak report could boost gold and weaken USD, aligning with your buy signal.

Modüler Trailing Stop (Doğru Ölçekli)
📌 Modular Trailing Stop – Advanced Risk Management for Long & Short Strategies
Modular Trailing Stop is a dual-direction stop management tool that calculates independent stop levels for long and short positions. It is fully scale-adjusted, strategy-agnostic, and optimized for TradingView integration.
🚀 Key Features
🔹 Dual-Side Stop Logic
Separate Ref High and Stop levels for long and short trades, allowing precise and directional control.
🔹 Modular Architecture
Designed to be easily integrated into any indicator or strategy. Operates independently from entry signals.
🔹 Accurate Price Scaling
Automatically adjusts to symbol tick size using syminfo.mintick, ensuring precision across all markets (BTCUSD, ETHUSD, USDTRY...).
🔹 Static Trailing Logic
Once a position is opened, stop levels are anchored to a fixed reference price and adjusted by ATR volatility.
🔹 User-Configurable
- Customizable ATR period and multiplier
- Manual reference high percentages for long and short
- Real-time table display on the chart with key values
⚙️ Calculation Formulas
- Ref High (Long) = Base Price × (1 + %Offset) × scaleFix
- Ref High (Short) = Base Price × (1 - %Offset) × scaleFix
- Step = ATR × Multiplier
- Long Stop = Ref High (Long) – Step
- Short Stop = Ref High (Short) + Step
📈 Use Cases
- Volatility-based static stop-loss framework
- Compatible with RSI, EMA crossover, breakout, and custom signal systems
- Backtesting via TradingView Strategy Tester (WinRate, Sharpe, AvgPnL...)
🧪 Example Backtest (BTCUSDT, 4H Timeframe)
- Win Rate: 41.9%
- Sharpe Ratio: 0.27
- Profit Factor: 1.31
- Avg Trade Duration: 18 bars
- Test Strategy: RSI-based entries + modular trailing stops
🧩 Strategy Integration (Sample)
strategy.exit("Long Exit", from_entry="Long", stop=longStop)
strategy.exit("Short Exit", from_entry="Short", stop=shortStop)
🏁 Summary
Modular Trailing Stop is a robust and intuitive stop-loss management tool. It can be used as a standalone module or combined with any strategy for improved position handling, effective drawdown control, and systematic risk management.
Whether you're building strategies or optimizing entries and exits, this tool brings precision and modular flexibility to your trading workflow.


Opening Range Breakout🧭 Overview
The Open Range Breakout (ORB) indicator is designed to capture and display the initial price range of the trading day (typically the first 15 minutes), and help traders identify breakout opportunities beyond this range. This is a popular strategy among intraday and momentum traders.
🔧 Features
📊 ORB High/Low Lines
Plots horizontal lines for the session’s high and low
🟩 Breakout Zones
Background highlights when price breaks above or below the range
🏷️ Breakout Labels
Text labels marking breakout events
🧭 Session Control
Customizable session input (default: 09:15–09:30 IST)
📍 ORB Line Labels
Text labels anchored to the ORB high and low lines (aligned right)
🔔 Alerts
Configurable alerts for breakout events
⚙️ Adjustable Settings
Show/hide background, labels, session window, etc.
⏱️ Session Logic
• The ORB range is calculated during a defined session window (default: 09:15–09:30).
• During this window, the highest high and lowest low are recorded as ORB High and ORB Low.
📈 Breakout Detection
• Breakout Above: Triggered when price crosses above the ORB High.
• Breakout Below: Triggered when price crosses below the ORB Low.
• Each breakout can trigger:
• A background highlight (green/red)
• A text label (“Breakout ↑” / “Breakout ↓”)
• An optional alert
🔔 Alerts
Two built-in alert conditions:
1. Breakout Above ORB High
• Message: "🔼 Price broke above ORB High: {{close}}"
2. Breakout Below ORB Low
• Message: "🔽 Price broke below ORB Low: {{close}}"
You can create alerts in TradingView by selecting these from the Add Alert window.
📌 Best Use Cases
• Intraday momentum trading
• Breakout and scalping strategies
• First 15-minute range traders (NSE, BSE markets)

JIYANS FVGJIYAN'S FVG is a powerful Fair Value Gap (FVG) indicator designed to help traders visually identify and track bullish and bearish imbalances across customizable timeframes. The script automatically detects FVGs based on market structure and plots them with shaded boxes and clear boundary lines on the chart.
Key Features:
Multi-Timeframe Detection: Select your preferred timeframe for FVG detection (e.g., H4, H1, M30).
Visual Clarity: Displays shaded gaps with customizable colors, upper and lower boundary lines, and optional midpoint lines for precise reference.
Dynamic Management: Automatically removes mitigated (filled) gaps to keep the chart clean and focused.
Labeling: Annotates each FVG with the selected timeframe for easy tracking.
Alerts: Built-in alerts notify you when a new FVG forms or when price touches the boundary of an existing unmitigated FVG.
This tool is perfect for traders who rely on price imbalances and fair value gaps to identify potential trading opportunities and key areas of interest.

Previous Day High & Low with Breakout Zones📌 Script Summary: Previous Day High/Low with Breakout Zones and Alerts
This Pine Script plots the previous day’s high and low on intraday charts, and highlights when the current price breaks out of that range during regular trading hours.
✅ Key Features
• Previous Day High/Low Lines: Draws horizontal lines at the prior day’s high and low, updated daily.
• Time-Filtered Session (09:15–15:30 IST): All logic applies only during Indian market hours.
• Breakout Zone Highlighting:
• 🟩 Green background when price closes above previous high
• 🟥 Red background when price closes below previous low
• Dynamic Labels: Displays labeled levels each day on the chart.
• Alerts:
• 🔼 Triggered when price crosses above the previous day’s high.
• 🔽 Triggered when price crosses below the previous day’s low.
• Customizable Inputs:
• Enable/disable alerts
• Toggle breakout zone highlights
• Set label offset
⚙️ Optimized For
• Intraday timeframes (e.g., 5m, 15m, 1h)
• Trading during NSE/BSE market hours
• Breakout strategy traders and range watchers

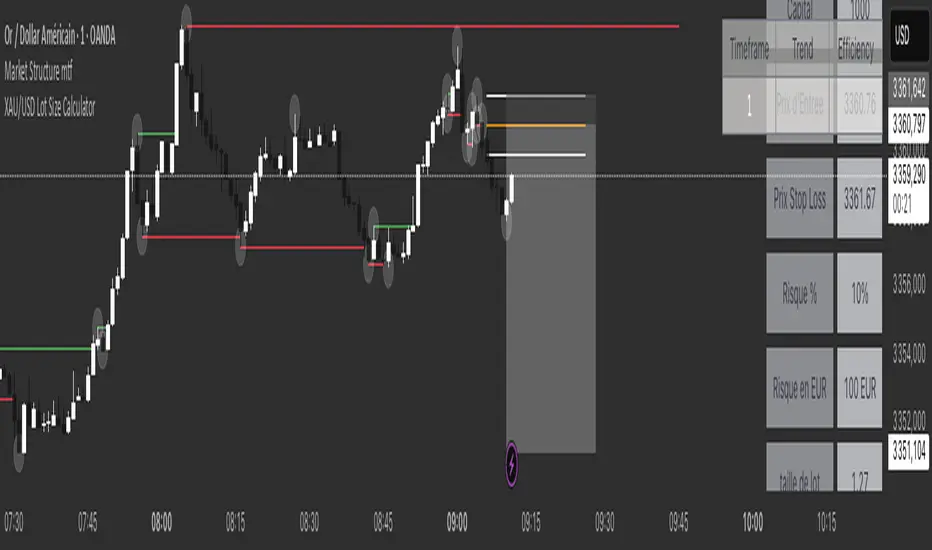
XAU/USD Lot Size CalculatorThis indicator automatically calculates the optimal lot size for XAUUSD (gold) based on the level of risk the trader wants to take. It is designed for traders using MetaTrader 4 or 5 and helps adjust position size according to the specific volatility of gold. The user can set the percentage of capital they are willing to risk on a single trade, for example 1%. The indicator also takes into account the stop loss level, which can be entered in pips or in dollars, as well as the account size (balance or equity).
Based on these parameters, it calculates the exact lot size that matches the risk amount. It then displays on the chart the recommended lot size, the risk amount in dollars, the pip value for XAUUSD, and a confirmation of the stop loss level. This type of indicator is useful for maintaining disciplined risk management and avoiding position sizing errors, especially on a highly volatile asset like gold.
Sessioni Colorate come ScreenshotPre-Market and Post-Market Session Highlighter (US)
This script highlights the Pre-Market and Post-Market trading sessions for US stocks and indices by coloring the background directly on the chart.
Time zone: UTC
• Pre-Market: 09:00 – 13:30 UTC
• Regular Session: 13:30 – 20:00 UTC (not highlighted)
• Post-Market: 20:00 – 00:00 UTC
Useful for identifying price behavior outside regular trading hours.

Steez's Timeframe TableSimple timeframe indicator which can assist with daily bias or draw on liquidity.
Shows all timeframes from 1 minute to 1 day.
Shows close time and if the candle is currently bearish or bullish.

EMA Crossover with DiamondsGreen diamond when 20 exponential moving average crosses over 50 exponential moving average, and shows a red diamond when 50 moving average crosses over 20 exponential moving average

Boomerang Trading Indicator# Boomerang News Trading Indicator
## Overview
The Boomerang Trading Indicator is designed to identify potential reversal opportunities following major economic news releases. This indicator analyzes the initial market reaction to news events and provides visual cues for potential counter-trend trading opportunities based on Fibonacci retracement levels.
## How It Works
### News Event Detection
- Automatically detects major news release times (NFP, CPI, FOMC, etc.)
- Analyzes the first significant price movement following news releases
- Requires minimum candle size threshold to filter out weak reactions
### First Move Analysis
The indicator employs multiple analytical methods to determine the initial market direction:
**Simple Analysis (High Confidence):**
- When the news candle has ≥70% body-to-total ratio, uses straightforward bullish/bearish classification
**Advanced Analysis (Complex Cases):**
- Volume-weighted direction analysis
- Momentum and wick pattern analysis
- Market structure and gap analysis
- Weighted voting system combining all methods
### Entry Signal Generation
Based on the "boomerang" concept where markets often reverse after initial news reactions:
**For Bullish First Moves (Price Up Initially):**
- Generates SHORT entry signals when price retraces to 1.25-1.5 Fibonacci levels
- Visual: Red triangles above price bars
**For Bearish First Moves (Price Down Initially):**
- Generates LONG entry signals when price retraces to -0.25 to -0.5 Fibonacci levels
- Visual: Green triangles below price bars
## Key Features
### Visual Elements
- **Fibonacci Levels**: Displays key retracement levels based on the initial reaction range
- **Entry Zones**: Clear visual marking of optimal entry areas
- **Direction Arrows**: Shows the initial market reaction direction
- **Target Levels**: Displays profit target zones at 50% and 100% retracement levels
### Information Panel
Real-time display showing:
- Current setup status
- First move direction and body percentage
- Recommended trade direction
- Key price levels (reaction high/low)
- Profit targets with historical success rates
### Alert System
- Pre-news warnings (customizable timing)
- News event notifications
- Setup activation alerts
- Entry signal notifications
### Success Tracking
- Visual "BOOM!" animations when targets are hit
- Target 1 (50% level): ~95% historical success rate
- Target 2 (Main target): ~80% historical success rate
## Configuration Options
### Time Settings
- News release hour and minute (customizable for different events)
- Pre-news alert timing
- Setup duration (default 60 bars after news)
### Fibonacci Levels
- Adjustable retracement percentages
- Customizable target levels
- Mid-level importance weighting
### Risk Management
- Minimum reaction candle size filter
- Maximum risk point setting
- Visual risk/reward display
### Display Options
- Toggle Fibonacci level visibility
- Toggle target level display
- Toggle animation effects
- Customizable alert preferences
## Applicable News Events
This indicator is designed for high-impact economic releases:
- Non-Farm Payrolls (NFP) - First Friday, 8:30 AM ET
- Consumer Price Index (CPI) - Monthly, 8:30 AM ET
- Producer Price Index (PPI) - Monthly, 8:30 AM ET
- Gross Domestic Product (GDP) - Quarterly, 8:30 AM ET
- FOMC Interest Rate Decisions - 8 times yearly, 2:00 PM ET
## Trading Strategy Framework
### Core Principle
Markets often overreact to news initially, then reverse toward more rational price levels. This "boomerang effect" creates short-term trading opportunities.
### Entry Strategy
1. Wait for significant initial reaction (>10 points minimum)
2. Identify the initial direction using multi-factor analysis
3. Trade opposite to the initial reaction when price reaches sweet spot zones
4. Use Fibonacci retracement levels as entry triggers
### Risk Management
- Always use appropriate position sizing
- Set stop losses beyond recent swing levels
- Consider market volatility and news importance
- Monitor for setup invalidation signals
## Important Notes
### Educational Purpose
This indicator is for educational and analytical purposes. Users should:
- Thoroughly test strategies in demo environments
- Understand the risks involved in news trading
- Consider market conditions and volatility
- Use proper risk management techniques
### Market Considerations
- High volatility during news events increases both opportunity and risk
- Spreads may widen significantly during news releases
- Different brokers may have varying execution conditions
- Economic calendar timing may vary between sources
### Limitations
- Past performance does not guarantee future results
- Market conditions can change, affecting strategy effectiveness
- News events may have unexpected outcomes affecting normal patterns
- Technical analysis should be combined with fundamental analysis
## Version Information
- Compatible with TradingView Pine Script v5
- Designed for 1-minute timeframe optimal performance
- Works on major forex pairs, indices, and commodities
- Regular updates based on market condition changes
---
**Disclaimer:** This indicator is provided for educational purposes only. Trading involves substantial risk and is not suitable for all investors. Past performance is not indicative of future results. Users should conduct their own research and consider their financial situation before making trading decisions.

Price to Earnings (P/E) Ratio with Yearly Avgthis price to earning ratio indicator with average PE line.
average PE line can be customize for period

Trading Sessionsthis indicator labels asia, london, and new york sessions with accurate times for trading indexes like nq, es, or ym. It gives a range from the session lows to session highs which can be used to identify liquidity grabs and price action.

Multi Horizontal Lines 1000 Bars
This indicator is not my code, I have copied this from another user and extened the lines so they go back 1000 bars for back testing.
I use this indicator to trade Crude Oil and set the horizontal lines to 20 cents increments, 0.2 is 20 cents. You can change the horizontal lines to any price distance to suit your style of trading.
My idea is when price crosses over a horizontal line I will enter a trade long or short looking to secure 20 cents.

ADT MSI TableKey Features:
1. Market Smith Methodology
Composite Rating: Combines price and volume strength
Relative Strength Rating: Measures stock performance vs benchmark
Base Pattern Detection: Identifies consolidation patterns
Breakout Signals: Detects valid breakouts with volume confirmation
2. Indian Market Adaptations
INR Currency Formatting: Displays prices in ₹, Lakhs, and Crores
Indian Benchmarks: NIFTY, SENSEX, NIFTY500 options
Market Cap Display: Formatted in Indian currency standards
Trading Hours Compatibility: Works with NSE/BSE data
3. Comprehensive Data Table
Real-time Metrics: Current price, daily change, volume analysis
Technical Indicators: MA positions, RS rating, composite rating
Performance Tracking: 3M, 6M, 12M returns
Signal Generation: BUY/SELL/HOLD recommendations
4. Visual Elements
Multiple Moving Averages: 10, 20, 50, 200 period MAs
Support/Resistance Levels: Dynamic pivot-based levels
Volume Analysis: Color-coded volume bars with surge detection
Trend Background: Color-coded background based on trend strength
Breakout Markers: Visual signals for valid breakouts
5. Customizable Parameters
Adjustable Periods: All timeframes can be modified
Table Positioning: 9 different table positions
Alert System: Customizable breakout and volume alerts
Display Options: Toggle any component on/off
6. Indian Market Specific
No Errors: Fully compatible with Indian stock data
Proper Formatting: All values in Indian currency format
Market Hours: Optimized for Indian trading sessions
Volume Calculations: Adapted for Indian market volume patterns

Key Metrics Dashboard (Float, MCap, ATR) (ValueRay)This dashboard displays critical fundamental and volatility data, saving you from switching screens. It’s perfect for traders who need to quickly assess a stock's character, risk profile, and potential before making a move.
📊 Metrics Included
- Market Cap (MCap): Quickly gauge company size.
- Float: See tradable shares (color-coded for low-float stocks).
- Short %: Measure bearish sentiment and short-squeeze potential (color-coded).
- ATR % & ADR %: Understand true volatility to manage risk.
🚀 Key Features
- Fully Customizable: Toggle any metric on/off to create your ideal view.
- Flexible Layout: Choose your preferred on-chart position, size, and layout (horizontal or vertical).
- Lightweight & Clean: Get essential data without cluttering your chart.
If you find this indicator useful, please give it a Boost (🚀)!
Happy Trading
