RF+ Divergence Scalping SystemRF+ Divergence Scalping System + Custom Signals + Alerts.
This chart overlay indicator has been developed for the low timeframe divergence scalper.
Built upon the realtime divergence drawing code from the Divergence for Many indicator originally authored by Lonsometheblue, this chart overlay indicator bundles several additional unique features and modifications to serve as an all-in-one divergence scalping system. The current key features at the time of publishing are listed below (features are optional and can be enabled or disabled):
- Fully configurable realtime divergence drawing and alerting feature that can draw divergences directly on the chart using data sourced from up to 11 oscillators selected by the user, which have been included specifically for their ability to detect divergences, including oscillators not presently included in the original Divergence for Many indicator, such as the Ultimate Oscillator and TSI.
- Optional on chart table showing a summary of key statuses of various indicators, and nearby divergences.
- 2 x Range Filters with custom settings used for low timeframe trend detection.
- 3 x configurable multi-timeframe Stochastic RSI overbought and oversold signals with presentation options.
- On-chart pivot points drawn automatically.
- Automatically adjusted pivot period for up to 4 configurable time frames to fine tune divergences drawn for optimal divergence detection.
- Real-price line for use with Heikin Ashi candles, with styling options.
- Real-price close dots for use with Heikin Ashi candles, with styling options.
- A selection of custom signals that can be printed on-chart and alerted.
- Sessions indicator for the London, New York, Tokyo and Sydney trading sessions, including daylight savings toggle, and unique ‘invert background color’ option, which colours the entire chart - except the trading session you have selected, leaving your chart clear of distracting background color.
- Up to 4 fully configurable moving averages.
- Additional configurable settings for numerous built in indicators, allowing you to alter the lengths and source types, including the UO, TSI, MFI, TSV, 2 x Range Filters.
- Configurable RSI Trend detection signal filter used in a number of the signals, which filters buy signals where the RSI is over the RSI moving average, and only prints sell signals where RSI is under the moving average.
- Customisable on-chart watermark, with inputs for a custom title, subtitle, and also an optional symbol | timeframe | date feature.
The Oscillators able to be selected for use in drawing divergences at the time of publishing are as follows:
- Ultimate Oscillator (UO)
- True Strength Indicator (TSI)
- Money Flow Index (MFI)
- Cumulative Delta Volume (CDV)
- Time Segmented Volume (TSV)
- Commodity Channel Index (CCI)
- Awesome Oscillator
- Relative Strength Index (RSI)
- Stochastic
- On Balance Volume (OBV)
- MACD Histogram
What are divergences?
Divergence is when the price of an asset is moving in the opposite direction of a technical indicator, such as an oscillator, or is moving contrary to other data. Divergence warns that the current price trend may be weakening, and in some cases may lead to the price changing direction.
There are 4 main types of divergence, which are split into 2 categories;
regular divergences and hidden divergences. Regular divergences indicate possible trend reversals, and hidden divergences indicate possible trend continuation.
Regular bullish divergence: An indication of a potential trend reversal, from the current downtrend, to an uptrend.
Regular bearish divergence: An indication of a potential trend reversal, from the current uptrend, to a downtrend.
Hidden bullish divergence: An indication of a potential uptrend continuation.
Hidden bearish divergence: An indication of a potential downtrend continuation.
Setting alerts.
With this indicator you can set alerts to notify you when any/all of the above types of divergences occur, on any chart timeframe you choose, also when the triple timeframe Stochastic RSI overbought and oversold confluences occur, as well as when custom signals are printed.
Configurable pivot period values.
You can adjust the default pivot period values to suit your prefered trading style and timeframe. If you like to trade a shorter time frame, lowering the default lookback values will make the divergences drawn more sensitive to short term price action. By default, this indicator has enabled the automatic adjustment of the pivot periods for 4 configurable time frames, in a bid to optimize the divergences drawn when the indicator is loaded onto any of the 4 time frames selected. These time frames and their associated pivot periods can be fully reconfigured within the settings menu. By default, these have been further optimized for the low timeframe scalper trading on the 1-15 minute time frames.
How do traders use divergences in their trading?
A divergence is considered a leading indicator in technical analysis , meaning it has the ability to indicate a potential price move in the short term future.
Hidden bullish and hidden bearish divergences, which indicate a potential continuation of the current trend are sometimes considered a good place for traders to begin, since trend continuation occurs more frequently than reversals, or trend changes.
When trading regular bullish divergences and regular bearish divergences, which are indications of a trend reversal, the probability of it doing so may increase when these occur at a strong support or resistance level . A common mistake new traders make is to get into a regular divergence trade too early, assuming it will immediately reverse, but these can continue to form for some time before the trend eventually changes, by using forms of support or resistance as an added confluence, such as when price reaches a moving average, the success rate when trading these patterns may increase.
Typically, traders will manually draw lines across the swing highs and swing lows of both the price chart and the oscillator to see whether they appear to present a divergence, this indicator will draw them for you, quickly and clearly, and can notify you when they occur.
How do traders use overbought and oversold levels in their trading?
The oversold level is when the Stochastic RSI is above the 80 level is typically interpreted as being 'overbought', and below the 20 level is typically considered 'oversold'. Traders will often use the Stochastic RSI at, or crossing down from an overbought level as a confluence for entry into a short position, and the Stochastic RSI at, or crossing up from an oversold level as a confluence for an entry into a long position. These levels do not mean that price will necessarily reverse at those levels in a reliable way, however. This is why this version of the Stoch RSI employs the triple timeframe overbought and oversold confluence, in an attempt to add a more confluence and reliability to this usage of the Stoch RSI.
This indicator is intended for use in conjunction with related panel indicators including the TSI+ (True Strength Indicator + Realtime Divergences), UO+ (Ultimate Oscillator + Realtime Divergences), and optionally the STRSI+ (MTF Stochastic RSI + Realtime Divergences) and MFI+ (Money Flow Index + Realtime Divergences) available via this authors’ Tradingview profile, under the scripts section. The realtime divergence drawing code will not identify all divergences, so it is suggested that you also have panel indicators to observe. Each panel indicator also offers additional means of entry confirmation into divergence trades, for example, the Stochastic can indicate when it is crossing down from overbought or up from oversold, the TSi can indicate when the 2 TSI bands cross over one another upward or downward, and the UO and MFI can indicate an entry confluence when they are nearing, or crossing their centerlines, for more confidence in your divergence trade entries.
Additional information on the settings for this indicator can be found via the tooltips within the settings menu itself. Further information on feature updates, and usage tips & tricks will be added to the comments section below in due course.
Disclaimer: This indicator uses code adapted from the Divergence for Many v4 indicator authored by Lonesometheblue, and several stock indicators authored by Tradingview. With many thanks.
Filter

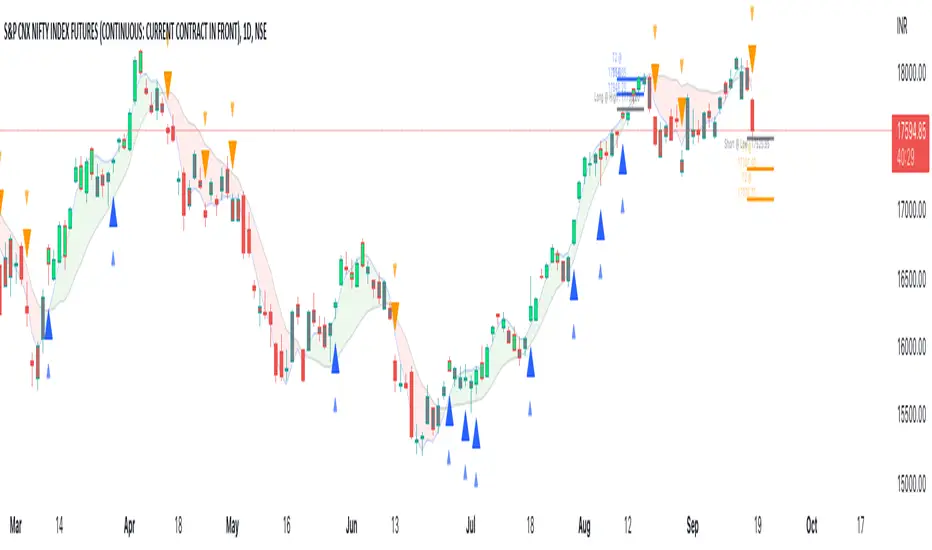
Probability Effort Scalper [PES]Probability Effort Scalper
Indicator is made of Two Basic Component
1. Probability Distribution Filter
2. Cumulative Effort Volumes
What is a Probability Distribution Filter ?
A filter which segregate the outcomes of any experiment into binary score of momentum based probabilities, so the filter is actually acting as a classifier to classify the probability of future occurrence of any event { in this case Stock prices going up / going down } { Long/ Short / Exit } by Binomial fitting method.
So the script uses Predictive Differential Filter, for filtering out the probability distribution, it actually uses differential calculations on binomial models.
Basic Assumptions:
That the Stock prices are in semi-strong efficiency
That the Stock prices follow up the Binomial Distribution
What is Cumulative Effort Volume
Effort Volume estimation is the process of predicting the most realistic amount of Volume Required to Push the Prices up or down, Its a group estimation model,
works on law of effort vs results and estimates the flow of the prices, (same as fluid dynamics), it's basically used to justify the harmony and Divergence occurrence in probability distribution.
How to use the Indicator
Simple Concept :
{ Signal candle = candle with a Triangle mark }
Long on the High of the Long Signal Candle,
Short on the Low of the Short Signal Candle
Exit on the Candle where "X" is present
For Long / Buy Signals {refer image below}
For Short / Sell Signals {refer image below}
Provisions for Alerts
Listed below are the Types of Alerts :
BUY SIGNAL
SELL SIGNAL
BOTH BUY/SELL SIGNAL
ALL STOP / EXIT SIGNALS
EXIT FROM LONG
EXIT FROM SHORT
What Securities will it work upon ?
The indicator works on every liquid security : stocks, futures, futures of indexes, forex, crypto : Having a Volume Informations provided by tradingview
Since the Indicator uses Volume Effort Estimation, The securities that you can apply the indicator on should be liquid
How to Get Access
Just Private Message me, would be happy to help you out !
Do not use comment box for asking for access, use it only for constructive feedbacks

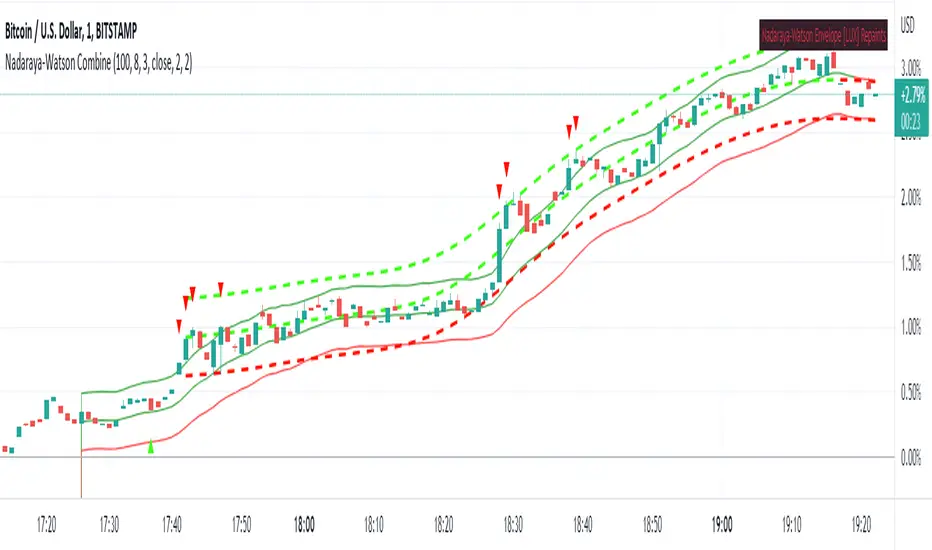
Nadaraya-Watson CombineThis is a combination of the Lux Algo Nadaraya-Watson Estimator and Envelope. Please note the repainting issue.
In addition, I've added a plot of the actual values of the current barstate of
the Nadaraya-Watson windows as they are computed (lines 92-95). It only plots values for the current data at
each time update. It is interesting to compare the trajectory of the end points of the Estimator and
Envelope to the smoothing function at each time update. Due to the kernel smoothing at each update the
history is lost at each update (repaint).
I've added a feature to allow adjustment to the kernel smoothing algorithm as suggested by thomsonraja (line 59).
The settings and usage are repeated from Lux Algo below.
Settings
Window Size: Determines the number of recent price observations to be used to fit the Nadaraya-Watson Estimator.
Bandwidth: Controls the degree of smoothness of the envelopes , with higher values returning smoother results.
Mult: Controls the envelope width.
Src: Input source of the indicator.
Kernel power: See line 59, adjusts the exponential power (powh) as suggested by thomsonraja
Kernel denominator: See line 59, adjusts the denominator (den) as suggested by thomsonraja
Usage
This tool outlines extremes made by the prices within the selected window size.
This is achieved by estimating the underlying trend in the price using kernel smoothing,
calculating the mean absolute deviations from it, and adding/subtracting it
from the estimated underlying trend.
I repeat Lux Algo's caution: 'we do not recommend this tool to be used alone
or solely for real time applications.'
Nadaraya-Watson: Rational Quadratic Kernel (Non-Repainting)What is Nadaraya–Watson Regression?
Nadaraya–Watson Regression is a type of Kernel Regression, which is a non-parametric method for estimating the curve of best fit for a dataset. Unlike Linear Regression or Polynomial Regression, Kernel Regression does not assume any underlying distribution of the data. For estimation, it uses a kernel function, which is a weighting function that assigns a weight to each data point based on how close it is to the current point. The computed weights are then used to calculate the weighted average of the data points.
How is this different from using a Moving Average?
A Simple Moving Average is actually a special type of Kernel Regression that uses a Uniform (Retangular) Kernel function. This means that all data points in the specified lookback window are weighted equally. In contrast, the Rational Quadratic Kernel function used in this indicator assigns a higher weight to data points that are closer to the current point. This means that the indicator will react more quickly to changes in the data.
Why use the Rational Quadratic Kernel over the Gaussian Kernel?
The Gaussian Kernel is one of the most commonly used Kernel functions and is used extensively in many Machine Learning algorithms due to its general applicability across a wide variety of datasets. The Rational Quadratic Kernel can be thought of as a Gaussian Kernel on steroids; it is equivalent to adding together many Gaussian Kernels of differing length scales. This allows the user even more freedom to tune the indicator to their specific needs.
The formula for the Rational Quadratic function is:
K(x, x') = (1 + ||x - x'||^2 / (2 * alpha * h^2))^(-alpha)
where x and x' data are points, alpha is a hyperparameter that controls the smoothness (i.e. overall "wiggle") of the curve, and h is the band length of the kernel.
Does this Indicator Repaint?
No, this indicator has been intentionally designed to NOT repaint. This means that once a bar has closed, the indicator will never change the values in its plot. This is useful for backtesting and for trading strategies that require a non-repainting indicator.
Settings:
Bandwidth. This is the number of bars that the indicator will use as a lookback window.
Relative Weighting Parameter. The alpha parameter for the Rational Quadratic Kernel function. This is a hyperparameter that controls the smoothness of the curve. A lower value of alpha will result in a smoother, more stretched-out curve, while a lower value will result in a more wiggly curve with a tighter fit to the data. As this parameter approaches 0, the longer time frames will exert more influence on the estimation, and as it approaches infinity, the curve will become identical to the one produced by the Gaussian Kernel.
Color Smoothing. Toggles the mechanism for coloring the estimation plot between rate of change and cross over modes.

obvFilterThis library comes with everything you need to add an On Balance Volume (OBV) filter to your strategy.
getOnBalanceVolumeFilter(source, maType, fastMaLength, fastMaLength)
Get the fast and slow moving average for on balance volume
Parameters:
source : hook this up to an 'input.source' input
maType : Choose from EMA, SMA, RMA, or WMA
fastMaLength : int smoothing length for fast moving average
fastMaLength : int smoothing length for fast moving average int smoothing length for slow moving average
Returns: Tuple with fast obv moving average and slow obv moving average
Add this to your strategy
▾ ▾ ▾ ▾ ▾ ▾ ▾ ▾ ▾ ▾ ▾ ▾ ▾ ▾ ▾ ▾ ▾ ▾ ▾ ▾ ▾ ▾ ▾ ▾
import jordanfray/obvFilter/1 as obv
obvSource = input.source(defval=close, title="OBV Source", group="On Balance Volume Filter")
obvMaType = input.string(defval="EMA", title="OBV Smoothing Type", options = , group="On Balance Volume Filter")
fastMaLength = input.int(title = "Fast OBV MA Length", defval = 9, minval = 2, maxval = 200, group="On Balance Volume Filter")
slowMaLength = input.int(title = "Slow OBV MA Length", defval = 21, minval = 1, maxval = 200, group="On Balance Volume Filter")
= obv.getOnBalanceVolumeFilter(obvSource, obvMaType, fastMaLength, slowMaLength)
RSI-Adaptive, GKYZ-Filtered DEMA [Loxx]RSI-Adaptive, GKYZ-Filtered DEMA is a Garman-Klass-Yang-Zhang Historical Volatility Filtered, RSI-Adaptive Double Exponential Moving Average. This is an experimental indicator. The way this is calculated is by turning RSI into an alpha value that is then injected into a DEMA function to output price. Price is then filtered using GKYZ Historical volatility. This process of creating an alpha out of RSI is only relevant to EMA-based moving averages that use an alpha value for it's calculation.
What is Garman-Klass-Yang-Zhang Historical Volatility?
Yang and Zhang derived an extension to the Garman Klass historical volatility estimator that allows for opening jumps. It assumes Brownian motion with zero drift. This is currently the preferred version of open-high-low-close volatility estimator for zero drift and has an efficiency of 8 times the classic close-to-close estimator. Note that when the drift is nonzero, but instead relative large to the volatility , this estimator will tend to overestimate the volatility . The Garman-Klass-Yang-Zhang Historical Volatility calculation is as follows:
GKYZHV = sqrt((Z/n) * sum((log(open(k)/close( k-1 )))^2 + (0.5*(log(high(k)/low(k)))^2) - (2*log(2) - 1)*(log(close(k)/open(2:end)))^2))
Included
Alerts
Signals
Loxx's Expanded Source Types
Bar coloring

KERPD Noise Filter - Kaufman Efficiency Ratio and Price DensityThis indicator combines Kaufman Efficiency Ratio (KER) and Price Density theories to create a unique market noise filter that is 'right on time' compared to using KER or Price Density alone. All data is normalized and merged into a single output. Additionally, this indicator provides the ability to consider background noise and background noise buoyancy to allow dynamic observation of noise level and asset specific calibration of the indicator (if desired).
The basic theory surrounding usage is that: higher values = lower noise, while lower values = higher noise in market.
Notes: NON-DIRECTIONAL Kaufman Efficiency Ratio used. Threshold period of 30 to 40 applies to Kaufman Efficiency Ratio systems if standard length of 20 is applied; maintained despite incorporation of Price Density normalized data.
TRADING USES:
-Trend strategies, mean reversion/reversal/contrarian strategies, and identification/avoidance of ranging market conditions.
-Trend strategy where KERPD is above a certain value; generally a trend is forming/continuing as noise levels fall in the market.
-Mean reversion/reversal/contrarian strategies when KERPD exits a trending condition and falls below a certain value (additional signal confluence confirming for a strong reversal in price required); generally a reversal is forming as noise levels increase in the market.
-A filter to screen out ranging/choppy conditions where breakouts are frequently fake-outs and or price fails to move significantly; noise level is high, in addition to the background buoyancy level.
-In an adaptive trading systems to assist in determining whether to apply a trend following algorithm or a mean reversion algorithm.
THEORY / THOUGHT SPACE:
The market is a jungle. When apex predators are present it often goes quiet (institutions moving price), when absent the jungle is loud.
There is always background noise that scales with the anticipation of the silence, which has features of buoyancy that act to calibrate the beginning of the silence and return to background noise conditions.
Trend traders hunt in low noise conditions. Reversion traders hunt in the onset of low noise into static conditions. Ranges can be avoided during high noise and buoyant background noise conditions.
Distance between the noise line and background noise can help inform decision making.
CALIBRATION:
- Set the Noise Threshold % color change line so that the color cut off is where your trend/reversion should begin.
- Set the Background Noise Buoyancy Calibration Decimal % to match the beginning/end of the color change Noise Threshold % line. Match the Background Noise Baseline Decimal %' to the number set for buoyancy.
- Additionally, create your own custom settings; 33/34 and 50 length also provides interesting results.
- A color change tape option can be enabled by un-commenting the lines at the bottom of this script.
Market Usage:
Stock, Crypto, Forex, and Others
Excellent for: NDQ, J225, US30, SPX
Market Conditions:
Trend, Reversal, Ranging

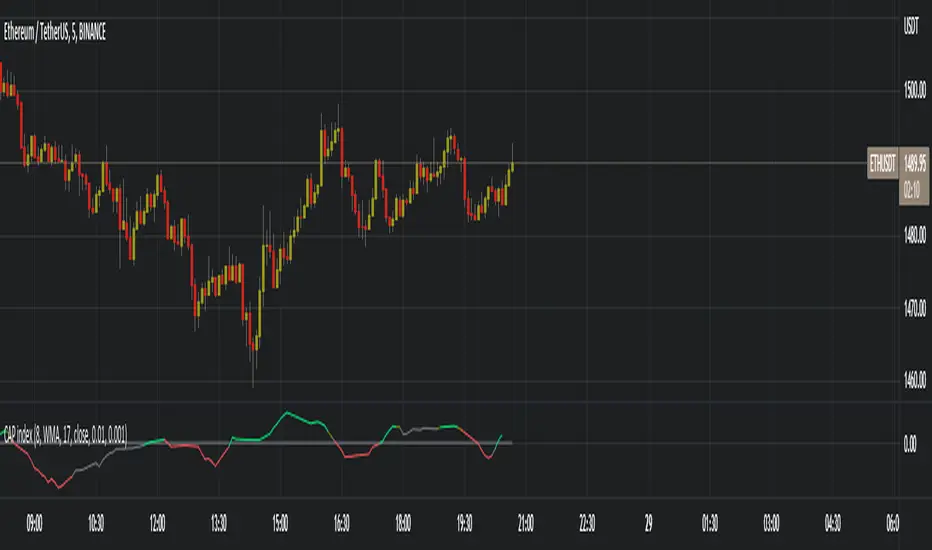
Constantly Applied Pressure Index (CAP index)BINANCE:ETHUSDT
The CAP index is my own homebrew trend indicator made to help traders see the slightly bigger picture, because we all know that as traders we can tend to hyper-focus in on a few candles and end up making a stupid trade because of it, or is it just me ? On a more serious note this indicator helps you find the short term trend by looking at bullish and bearish candles comparing their sizes, volumes and predominance.
The indicator has many technical settings for you to play around with but on the defaults it will render in a few colors which I will explain. Gray means no trend or that the current trend has died, bright green or red mean that a trend has formed, is playing out or that there is a good change a strong trend is about to form. Obviously green means bullish and red means bearish. Finally darker green and red mean a weak or weakening trend, this serves as a warning if you are about to take a trade in the trend direction.
The way I recommend using the indicator is the same way many trend indicators are used, as a filter to either a different indicator creating trading signals or to your own strategy's signals. I would add an illustration here that I prepared but I cannot because of tradingview's reputation rules
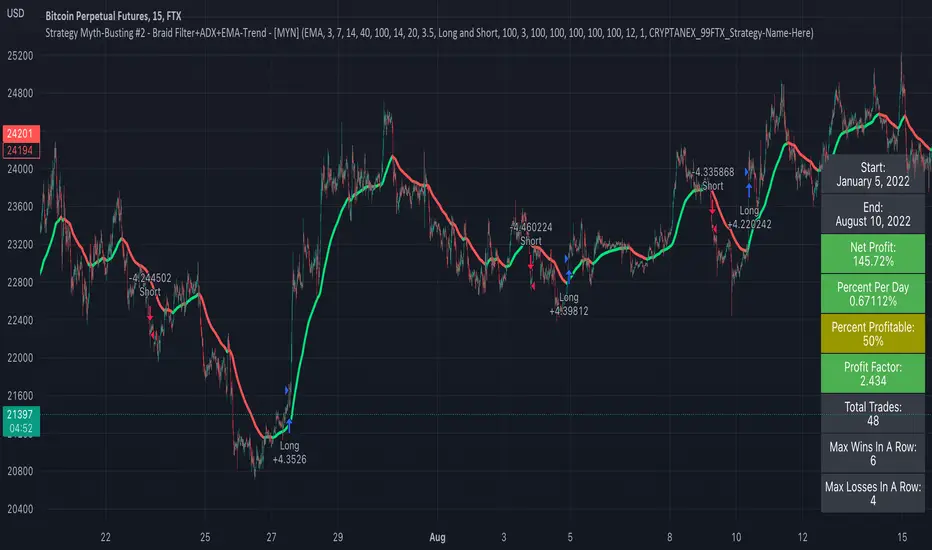
Strategy Myth-Busting #2 - Braid Filter+ADX+EMA-Trend - [MYN]This is part of a new series we are calling "Strategy Myth-Busting" where we take open public manual trading strategies and automate them. The goal is to not only validate the authenticity of the claims but to provide an automated version for traders who wish to trade autonomously.
Our second one we are automating is the " Braid Filter: The Indicator That Will Make You a Fortune ( Crazy Win Rate ! ) " strategy from " TradeIQ " who claims to have backtested this manually and achieved 453% profit with a 75% winrate over 100 trades in just a few months. I was unable to emulate these results accommodating for slippage and commission but this strategy does fair pretty well at least compared to the first one we automated.
If you know of or have a strategy you want to see myth-busted or just have an idea for one, please feel free to message me.
This strategy uses a combination of 3 open-source public indicators:
Braid Filter by Robert Hill
CM_EMA Trend Bars by Chris Moody
ADX and DI for V4 by Trend Bars by BeikabuOyaji
Trading Rules
15 min candles but other time-frames seem to work well too.
Long
1) Buy Price action above moving average. (bars are green)
2) Braid filter must issue a new green bar
3) ADX must be above the 20 level and be pointed up, If flat or downwards, don't enter trade (adjust ADX Slope to increase/decrease the incline of the slope)
4) Stop loss at the moving average or recent swing low.
Short
1) Buy Price action below moving average. (bars are red)
2) Braid filter must issue a new red bar
3) ADX must be above the 20 level and be pointed up, If flat or downwards, don't enter trade (adjust ADX Slope to increase/decrease the incline of the slope)
4) Stop loss at the moving average or recent swing high.
Target 1.5x the risk
Optimal Confidence Scalper [OCS]Introduction
OCS : Optimal Confidence Scalpers, Utilise the computational approach towards finding confidence estimating in signal generating process, It helps u enter and exit the financial markets quickly, It buy and sell many times in a day with the objective of making consistent profits from incremental movements in the traded security's price. As we all know Lag is very undesirable because a trading system. Late trades can many times be worse than no trades at all, Main aim of the System is to find optimal Entry and Exit points for a successful trade
Mathematics behind the indicator
The indicator use two fundamentals pillars :
Estimation of a Confidence Interval
In frequentist statistics, a confidence interval (CI) is a range of estimates for an unknown parameter. A confidence interval is computed at a designated confidence level; the 95% confidence level is most common, but other levels, such as 90% or 99%, are sometimes used.
Desired properties are Validity, Optimality and Invariance
Polynomial Filters
The polynomial filters are based on the orthogonal polynomials of Legendre and Laguerre. Orthogonal polynomials are widely used in applied mathematics, physics and engineering, and the Legendre and Laguerre polynomials are only two of infinitely many sets, each of which has its own weight function.
They can be characterized in three equivalent ways:
1. They are the optimal lowpass filters that minimize the NRR, subject to additional constraints than the DC unity-gain condition
2. They are the optimal filters that minimize the NRR whose frequency response H(ω) satisfies certain flatness constraints at DC
3. They are the filters that optimally fit, in a least-squares sense, a set of data points to polynomials of different degrees.
The System uses Predictive Differentiation Filters, as subset to Polynomial Filters
Components of the System
Buy Signal and Sell Signals
=====================
=====================------ HOW TO USE IT
=====================
ENTRY and EXITS
Momentum Bands
Confidence Levels
Indicator Properties
Provision For Alerts
1. Buy Signal Alert
2. Sell Signal Alert
3. Exit Alert if in Buy Trade
4. Exit Alert if in Sell Trade
Some Examples
What TimeFrames To Use
U can use any Timeframe, The indicator is Adaptive in Nature,
I personally use timeframes such as : 1m, 5m 10m, 15m, ..... 1D, 1W
How to Access
U will need to privately message me.
use comment box for constructive comments
Thanks
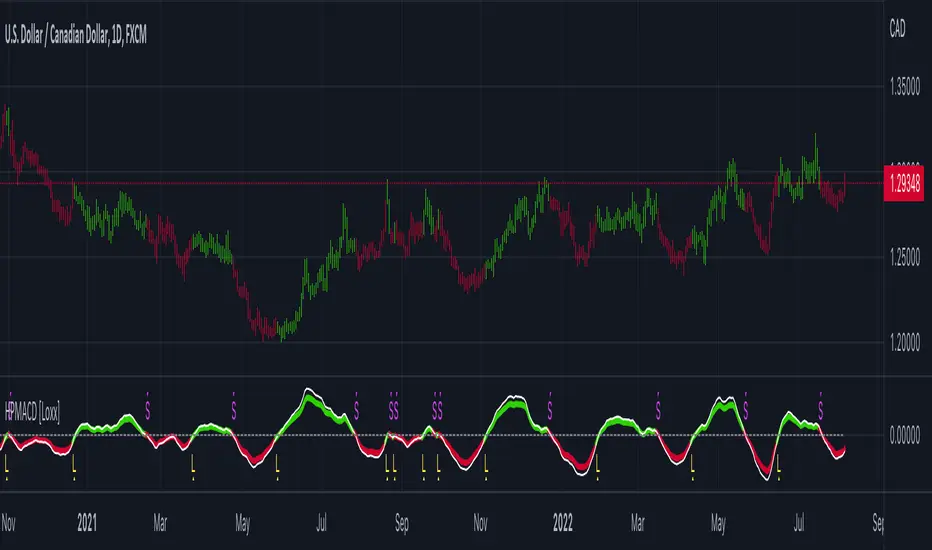
Hodrick-Prescott MACD [Loxx]Hodrick-Prescott MACD is a MACD indicator using a Hodrick-Prescott Filter.
What is Hodrick–Prescott filter?
The Hodrick–Prescott filter (also known as Hodrick–Prescott decomposition) is a mathematical tool used in macroeconomics, especially in real business cycle theory, to remove the cyclical component of a time series from raw data. It is used to obtain a smoothed-curve representation of a time series, one that is more sensitive to long-term than to short-term fluctuations. The adjustment of the sensitivity of the trend to short-term fluctuations is achieved by modifying a multiplier Lambda.
The filter was popularized in the field of economics in the 1990s by economists Robert J. Hodrick and Nobel Memorial Prize winner Edward C. Prescott, though it was first proposed much earlier by E. T. Whittaker in 1923.
There are some drawbacks to use the HP filter than you can read here: en.wikipedia.org
Included
Bar coloring
3 types of signals
Alerts
Loxx's Expanded Source Types
Hodrick-Prescott Channel [Loxx]Hodrick-Prescott Channel is a fast and slow moving average that moves inside a channel. Breakouts are when the fast ma crosses up over the slow ma and breakdowns are the opposite. The white moving average is the fast ma, the slow moving average is the red/green ma.
What is Hodrick–Prescott filter?
The Hodrick–Prescott filter (also known as Hodrick–Prescott decomposition) is a mathematical tool used in macroeconomics, especially in real business cycle theory, to remove the cyclical component of a time series from raw data. It is used to obtain a smoothed-curve representation of a time series, one that is more sensitive to long-term than to short-term fluctuations. The adjustment of the sensitivity of the trend to short-term fluctuations is achieved by modifying a multiplier Lambda.
The filter was popularized in the field of economics in the 1990s by economists Robert J. Hodrick and Nobel Memorial Prize winner Edward C. Prescott, though it was first proposed much earlier by E. T. Whittaker in 1923.
There are some drawbacks to use the HP filter than you can read here: en.wikipedia.org
Included
Bar coloring
Signals
Alerts

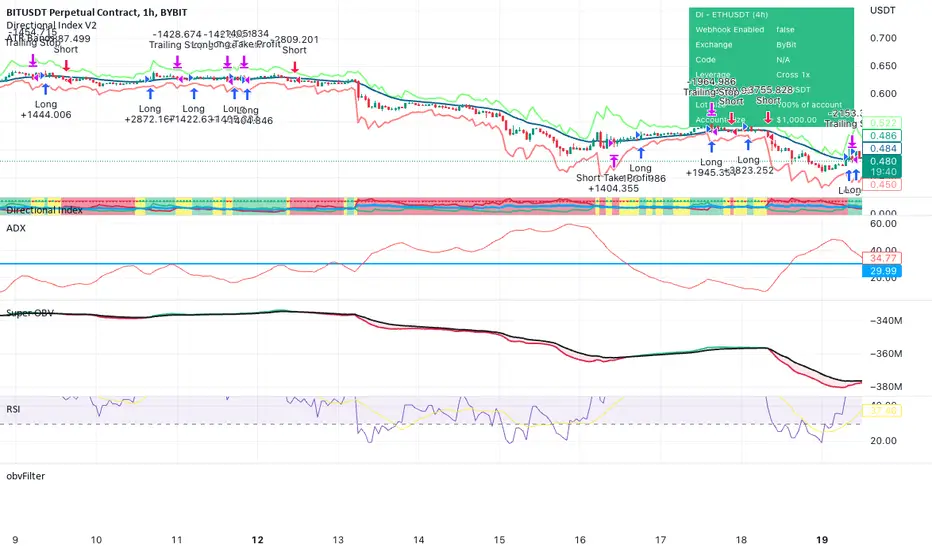
NLX Trading Bot Framework (+Trend Score & QQE)- Demo of my NLX Modular Trading Framework -
It includes all the common indicators and creates a positive or negative score, which can be used with my Modular Trading Framework and linked to an entry/exit indicator to filter out buy/sell signals if the trend is not favorable.
Combination of:
SuperTrend
VWAP Bands
Relative Strength Index ( RSI )
Commodity Channel Index ( CCI )
William Percent Range (WPR)
Directional Movement Index (DMI)
Elder Force Index ( EFI )
Momentum
Demarker
Parabolic SAR
- Getting Started -
1. Add this Trend Index to your Chart
2. Add one of my Indicator Modules to your Chart, such as the QQE++ Indicator
3. In the QQE Indicator Settings combine it with the Trend Index (and choose L1 Type)
4. Optional: Add the Noise Filter, and in the Noise Filter Settings you select the QQE Indicator as combination (and choose L2 for Type)
5. Add the Backtest Module to your Chart
6. Select the Noise Filter in the Backtest Settings
- Access -
Only as part of the NLX Framework - see my signature below for more info.

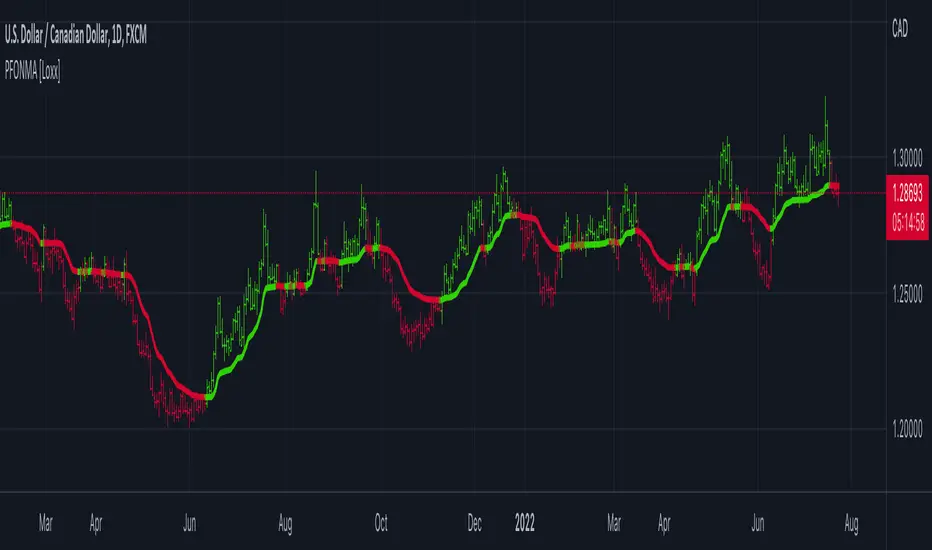
Price-Filtered Ocean Natural Moving Average (NMA) [Loxx]Price-Filtered Ocean Natural Moving Average (NMA) is a an Ocean Natural Moving Average indicator that takes as its input a moving average filter of price before applying the NMA volatility adaptation.
What is the Ocean Natural Moving Average?
Created by Jim Sloman, the NMA is a moving average that automatically adjusts to volatility without being programed to do so. For more info, read his guide "Ocean Theory, an Introduction"
What's the difference between this indicator and Sloan's original NMA?
Sloman's original calculation uses the natural log of price as input into the NMA, here we use moving averages of price as the input for NMA. As such, this indicator applies a certain level of Ocean theory adaptivity to moving average filter used.
Included
Bar coloring
Alerts
Expanded source types
Parabolic SAR of KAMA [Loxx]Parabolic SAR of KAMA attempts to reduce noise and volatility from regular Parabolic SAR in order to derive more accurate trends. In addition, and to further reduce noise and enhance trend identification, PSAR of KAMA includes two calculations of efficiency ratio: 1) price change adjusted for the daily volatility; or, 2) Jurik Fractal Dimension Adaptive (explained below)
What is PSAR?
The parabolic SAR indicator, developed by J. Wells Wilder, is used by traders to determine trend direction and potential reversals in price. The indicator uses a trailing stop and reverse method called "SAR," or stop and reverse, to identify suitable exit and entry points. Traders also refer to the indicator as to the parabolic stop and reverse, parabolic SAR, or PSAR.
What is KAMA?
Developed by Perry Kaufman, Kaufman's Adaptive Moving Average (KAMA) is a moving average designed to account for market noise or volatility. KAMA will closely follow prices when the price swings are relatively small and the noise is low. KAMA will adjust when the price swings widen and follow prices from a greater distance. This trend-following indicator can be used to identify the overall trend, time turning points and filter price movements.
What is the efficiency ratio?
In statistical terms, the Efficiency Ratio tells us the fractal efficiency of price changes. ER fluctuates between 1 and 0, but these extremes are the exception, not the norm. ER would be 1 if prices moved up 10 consecutive periods or down 10 consecutive periods. ER would be zero if price is unchanged over the 10 periods.
What is Jurik Fractal Dimension?
There is a weak and a strong way to measure the random quality of a time series.
The weak way is to use the random walk index (RWI). You can download it from the Omega web site. It makes the assumption that the market is moving randomly with an average distance D per move and proposes an amount the market should have changed over N bars of time. If the market has traveled less, then the action is considered random, otherwise it's considered trending.
The problem with this method is that taking the average distance is valid for a Normal (Gaussian) distribution of price activity. However, price action is rarely Normal, with large price jumps occuring much more frequently than a Normal distribution would expect. Consequently, big jumps throw the RWI way off, producing invalid results.
The strong way is to not make any assumption regarding the distribution of price changes and, instead, measure the fractal dimension of the time series. Fractal Dimension requires a lot of data to be accurate. If you are trading 30 minute bars, use a multi-chart where this indicator is running on 5 minute bars and you are trading on 30 minute bars.
Conclusion from the combined efforts explained above:
-PSAR is a tool that identifies trends
-To reduce noise and identify trends during periods of low volatility, we calculate a PSAR on KAMA
-To enhance noise and reduction and trend identification, we attempt to derive an efficiency ratio that is less reliant on a Normal (Gaussian) distribution of price
Included:
-Customization of all variables
-Select from two different ER calculation styles
-Multiple timeframe enabled

FiboBars ExtendedA trend indicator FiboBars Extended , the main purpose of which is to confirm the trend and cut off market noise. In his logic, he uses the Fibonacci sequence.
Two settings are used to account for noise suppression accuracy:
Period - number of calculation bars
Level - Fibonacci number selection

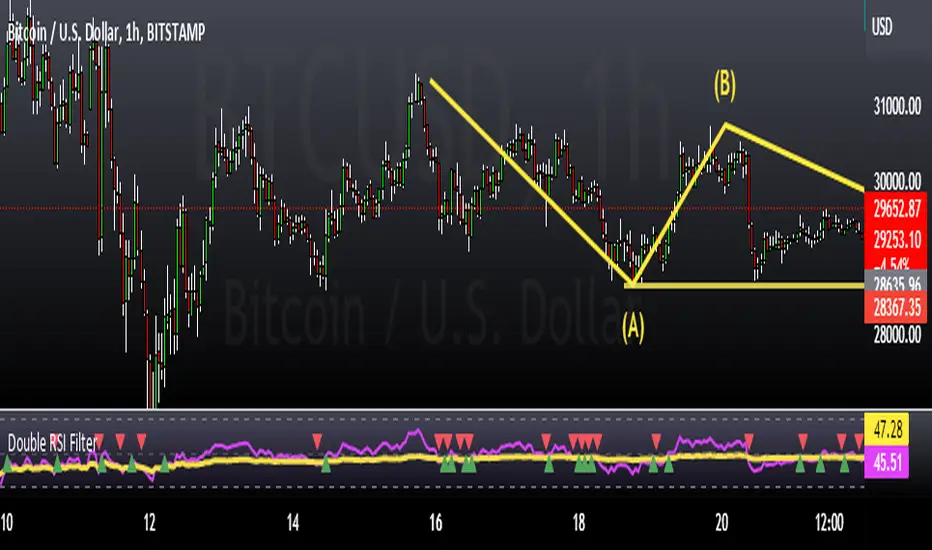
Double RSI FilterI've seen several youtubers using 2 RSI's on top of one another to filter trades for their strategies. I figured I would just code it up as an all-in-one indicator for people who have the basic package. This way they have an extra slot for another indicator if they need one and also for convenience.
Longs only when RSI 1 is above RSI 2 and shorts only when opposite. The arrows show where crosses of the RSI's occur.
Let me know if there is something else like this where it would just be very convenient to have 2 indicators on one window or other such things and I'll see if I can do something for you guys in my spare time. I'm just an amateur coder, but learning as I do more of these for people.
Thank you!
Hope this helps someone! :)
ATR with MAOVERVIEW
The Average True Range Moving Average (ATRMA) is a technical indicator that gauges the amount of volatility currently present in the market, relative to the historical average volatility that was present before. It adds a moving average to the Average True Range (ATR) indicator.
This indicator is extremely similar to the VOXI indicator, but instead of measuring volume, it measures volatility. Volume measures the amount of shares/lots/units/contracts exchanged per unit of time. Volatility, on the other hand, measures the range of price movement per unit of time.
The purpose of this indicator is to help traders filter between non-volatile periods in the market from volatile periods in the market without introducing subjectivity. It can also help long-term investors to determine market regime using volatility without introducing subjectivity.
CONCEPTS
This indicator assumes that trends are more likely to start during periods of high volatility, and consolidation is more likely to persist during periods of low volatility. The indicator also assumes that the average true range (ATR) of the last 14 candles is reflective of the current volatility in the market. ATR is the average height of all the candles, where height = |high - low|.
Suppose the ATR of the last 14 candles is greater than a moving average of the ATR(14) of the last 20 candles (this occurs whenever the indicator's filled region is colored BLUE). In that case, we can assume that the current volatility in the market is high.
Suppose the ATR of the last 14 candles is less than the moving average of the ATR(14) of the last 20 candles (this occurs whenever the indicator's filled region is colored RED). In that case, we can assume that the current volatility in the market is low.
HOW DO I READ THIS INDICATOR?
If the ATR line is above the ATR MA line (indicated by the blue color), the current volatility is greater than the historical average volatility.
If the ATR line is above the ATR MA line (indicated by the red color), the current volatility is less than the historical average volatility.

Highlight Trading Window (Simple Hours / Time of Day Filter)As the name says this is a straightforward way to highlight the times of day that you are interested in studying.
Like to trade just a market open, or highlight a full session?
Could also be used negatively to "block out" a window of time each day.
Usage:
Just set your preferred time zone and then your time window (start and end).
Hope you find it useful! 😁

[Fedra Algotrading Super Duper Trend Filter]All-in-one trend filter
Trend-following strategies are relatively easy to achieve, especially in backtesting. If only we knew what trend we were in! Let me help you:
- MAs crossovers
- Selection of the type of MAs
- Selection of MAs periods
-Super trend (optional)
-Trend zones based on trend lines (optional)
- Secret sauce
How to use it?
Do not open Longs if it is red
Don't open Shorts if it's green.
Apply it to your strategies and check the impact of a reliable trend filter before opening your entries.

Volume OximeterOVERVIEW
The Volume Oximeter (VOXI) is a technical indicator that gauges the amount of volume currently present in the market, relative to the historical volume that was present before. The purpose of this indicator is to filter out with-trend signals during ranging/non-trending conditions.
CONCEPTS
This indicator assumes that trends are more likely to start during periods of high volume, compared to during periods of low volume. This is because high volume indicates that there are bigger players currently in the market, which is necessary to begin a sustained trending move.
So, to determine whether the current volume is "high", it is compared to an average volume for however number of candles back the user specifies.
If the current volume is greater than the average volume, it is reasonable to assume we are in a high volume period. Thus, this is the ideal time to enter a trending trade due to the assumption that trends are more likely to start during these high volume periods.
The default values in the indicator are designed for use on the daily chart but can be applied to any timeframe.
The default volume lookback period is 259 since there are usually 259 daily candles in a year on Forex daily charts. This means that the average volume will represent the average volume over the past year. This would be 365 on Crypto daily charts, since the Crypto is open 24/7 instead of 24/5). This is what the current volume will be compared to.
The default smoothing lookback period is 10, but this can be adjusted depending on the indicator that's giving you your with-trend signals. After my backtesting, 10 was the best value for my with-trend indicator, so you should do your own testing to see which value works best with your with-trend indicator.
HOW DO I READ THIS INDICATOR?
If the VOXI line is above or equal to zero (indicated by the blue color), the current volume is greater than the historical average volume.
This is a good time to take with-trend signals since high volume is necessary for sustained trending moves to begin.
If the VOXI line is below zero (indicated by the red color), the current volume is less than the historical average volume.
This is a good time to ignore with-trend signals since an absence of volume indicates that there aren't big market participants to participate in a new trending move.

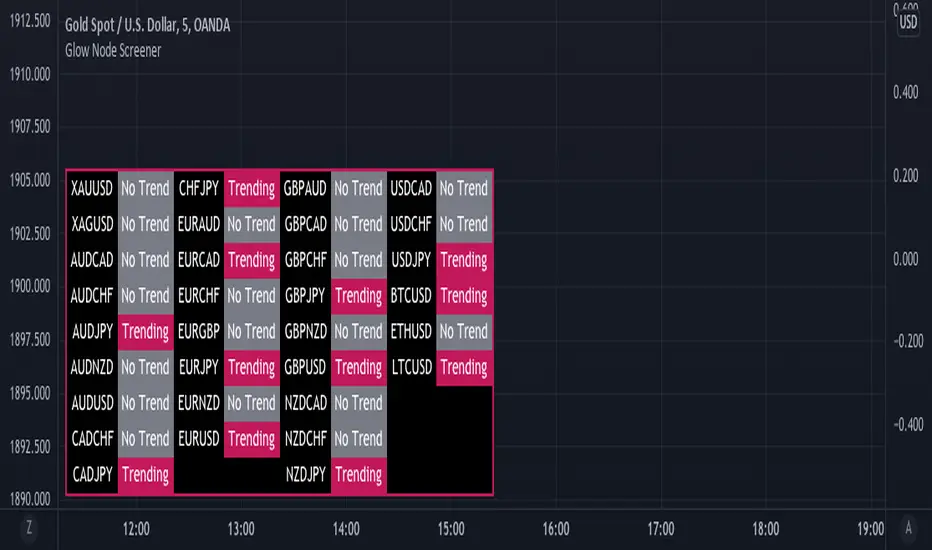
Glow Node ScreenerGlow Node Screener
Our Screener helps you identify whether a pair is in a strong trend for 32 different pairs including crypto.
Using our screener with a strategy will help you weed out bad markets that are ranging at a higher timeframe.
Which will in turn help reduce some of the bad trades you may take due to signals appearing in consolidation.
Very useful to choose which pairs you may like to trade for that day and what to avoid.
Higher Timeframe
The higher timeframe is automatically selected for you on the 15M - 30M - 1H - 4H time frames. You can override this by toggling the override button and selecting your timeframe manually
Pairs:
XAUUSD
XAGUSD
AUDCAD
AUDCHF
AUDJPY
AUDNZD
AUDUSD
CADCHF
CADJPY
CHFJPY
EURAUD
EURCAD
EURCHF
EURGBP
EURJPY
EURNZD
EURUSD
GBPAUD
GBPCAD
GBPCHF
GBPJPY
GBPNZD
GBPUSD
NZDCAD
NZDCHF
NZDJPY
USDCAD
USDCHF
USDJPY
BTCUSD
ETHUSD
LTCUSD
more will be added if requested
super SSL [ALZ]This script is designed and optimized for MULTI TIME
by Ali Zebardast (ALZ)
1.in part of ssl
Original Version credits to Mihkel00
Actual Version i just set alerts and change the parameters for BTCUSDT 1min Chart.
He designed for daily time. I tried to optimize 1 min time-frame .
And fix the errors with OTT
"This script has a SSL / Baseline (you can choose between the SSL or MA), a secondary SSL for continiuation trades and a third SSL for exit trades.
Alerts added for Baseline entries, SSL2 continuations, Exits.
Baseline has a Keltner Channel setting for "in zone" Gray Candles
Added "Candle Size > 1 ATR" Diamonds from my old script with the criteria of being within Baseline ATR range."
2.in part of Range
two Filter Buy and Sell for 3min
Wait For Bar close
ssl2 :Be under the candle for buy
and The bar color must confirm the order of purchase (Blue)
3.in part of OTT
when candles close over HOTT, means an UPTREND SIGNAL
and to Fuchia when candles begin closing under LOTT line to indicate a DOWNTREND SIGNAL.
FLAT ZONE is highlighted also to have the maximum concentration on sideways market conditions.
There are three quantitative parameters in this indicator:
The first parameter in the OTT indicator set by the two parameters is the period/length.
OTT lines will be much sensitive to trend movements if it is smaller.
And vice versa, will be less sensitive when it is longer.
As the period increases it will become less sensitive to little trends and price actions.
In this way, your choice of period, will be closely related to which of the sort of trends you are interested in.
The OTT percent parameter in OTT is an optimization coefficient. Just like in the period
small values are better at capturing short term fluctuations, while large values
will be more suitable for long-term trends.
The final adjustable quantitative parameter is HIGHEST and LOWEST length which is the source of calculations.
Credits go to:
SSL Hybrid www.tradingview.com
HIGH and LOW OTT : www.tradingview.com
Range Filter www.tradingview.com
