Hampel FilterHampel Filter script.
This indicator was originally developed by Frank Rudolf Hampel (Journal of the American Statistical Association, 69, 382–393, 1974: The influence curve and its role in robust estimation).
The Hampel filter is a simple but effective filter to find outliers and to remove them from data. It performs better than a median filter.
Filter

Ehlers FilterThis is the Adaptive Ehlers Filter.
I had to unroll the for loops and array because TV is missing crucial data structures and data conversions (Arrays and series to integer conversion for values).
I'm in the process of releasing some scripts. This is a very old script I had. This contains volatility ranges and can be used as trading signals. You can also see how the EF moves up or down, the direction, when price is sideways, and use price breaks up and down as signals from the line.
Have fun, because I didn't making this script hahaha
NOTE : There is an issue with the script where at certain time frames it positions itself below or above. I think its due to calculations. If anyone knows the fix before I get the chance to take a look at it, please let me know.
books.google.com

Ehlers Super Passband FilterEhlers Super Passband Filter script.
This indicator was originally developed by John F. Ehlers (Stocks & Commodities V. 34:8: The Super Passband Filter).
Ehlers StochasticEhlers Stochastic script.
This indicator was originally developed by John F. Ehlers (Stocks & Commodities V. 32:1: Predictive And Successful Indicators).
Ehlers Roofing FilterEhlers Roofing Filter script.
This indicator was originally developed by John F. Ehlers (Stocks & Commodities V. 32:1: Predictive And Successful Indicators).

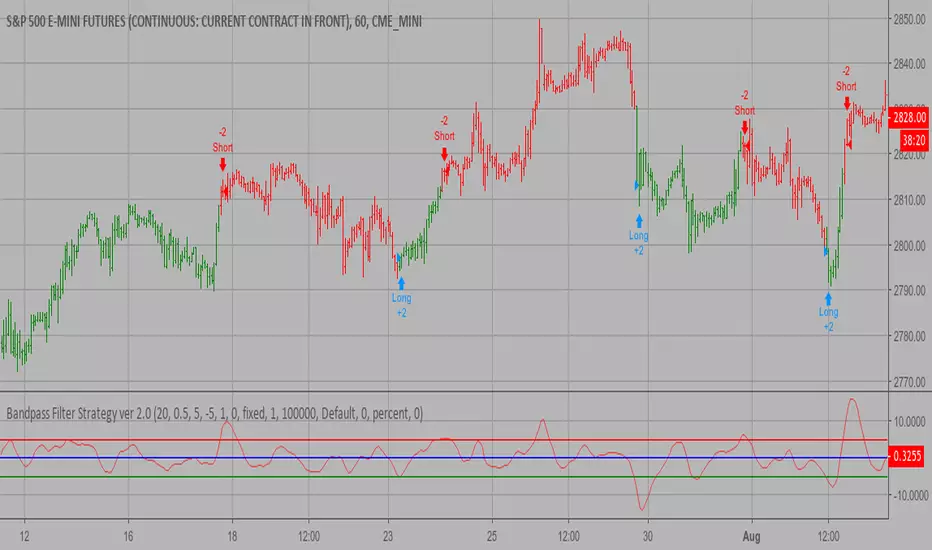
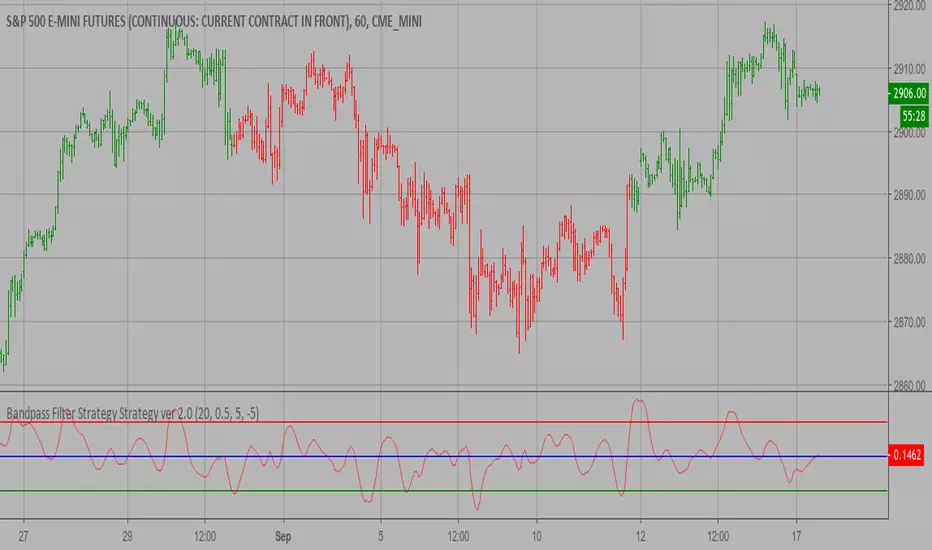
Bandpass Filter Strategy ver 2.0 The related article is copyrighted material from
Stocks & Commodities Mar 2010
You can use in the xPrice any series: Open, High, Low, Close, HL2, HLC3, OHLC4 and ect...
You can change long to short in the Input Settings
WARNING:
- For purpose educate only
- This script to change bars colors.
Ehlers Super Smoother FilterEhlers Super Smoother Filter script.
This indicator was originally developed by John F. Ehlers (see his book `Cybernetic Analysis for Stocks and Futures`, Chapter 13: `Super Smoothers`).
Bandpass Filter Strategy ver 2.0 The related article is copyrighted material from
Stocks & Commodities Mar 2010
You can use in the xPrice any series: Open, High, Low, Close, HL2, HLC3, OHLC4 and ect...
WARNING:
- This script to change bars colors.
Quadratic RegressionA quadratic regression is the process of finding the equation that best fits a set of data.This form of regression is mainly used for smoothing data shaped like a parabola.
Because we can use short/midterm/longterm periods we can say that we use a Quadratic Least Squares Moving Average or a Moving Quadratic Regression.
Like the Linear Regression (LSMA) a Quadratic regression attempt to minimize the sum of squares (sum of the squared difference between a set of data and an estimator), this is why
those kinds of filters have low lag .
Here the difference between a Least Squared Moving Average ( green ) and a Quadratic Regression ( red ) of both period 500
Here it look like the Quadratic Regression have a best fit than the LSMA

Price FlowFor those who like to trade with the trend instead of against it. This little script shows you what side of the daily/weekly/monthly timeframe open, price is currently trading at so that you dont accidentally trade against the higher timeframe momentum. Timeframes are customizable through the indicator settings panel.

Flat Market Filters4 separate indicators in one to identify flat/ranging market conditions, with the intention of filtering out MA crosses during periods of flatness (or targetting ranging conditions for mean reversion strats)
Options to use any combination of the 4 indicators (AND/OR settings for each indicator combination) and separate config options for each indicator.
Updates to come. Message for access.

Hamming Windowed Volume Weighted Moving AverageApplying a window to the filter weights provides sometimes extra control over the characteristics of the filter.In this script an hamming window is applied to the volume before being used as a weight.In general this process smooth the frequency response of a filter.
Lets compare the classic vwma with hamming windowed vwma
Something i noticed is that windowed filters depending on their period ( high ones in general ) tend to make less bad crosses with the price ( at least with the hamming window )
Here are some data regarding number of crosses with period 50 with the hamming vwma in orange and the classic vwma in purple
Feel free to use the hamming window when using weighted filter.

Rate of Change w/ Butterworth FilterIt passes the Rate of Change data through a Butterworth filter which creates a smooth line that can allow for easier detection of slope changes in the data over various periods of times.
The butterworth filter line and the rate of change are plotted together by default. The values for the lengths, for both the butterworth filter and the raw ROC data, can be changed from the format menu (through a toggle).
The shorter the Butterworth length, the closer the line is fitted to the raw ROC data, however you trade of with more frequent slope changes.
The longer the Butterworth length, the smoother the line and less frequent the slope changes, but the Butterworth line is farther of center from the raw ROC data.
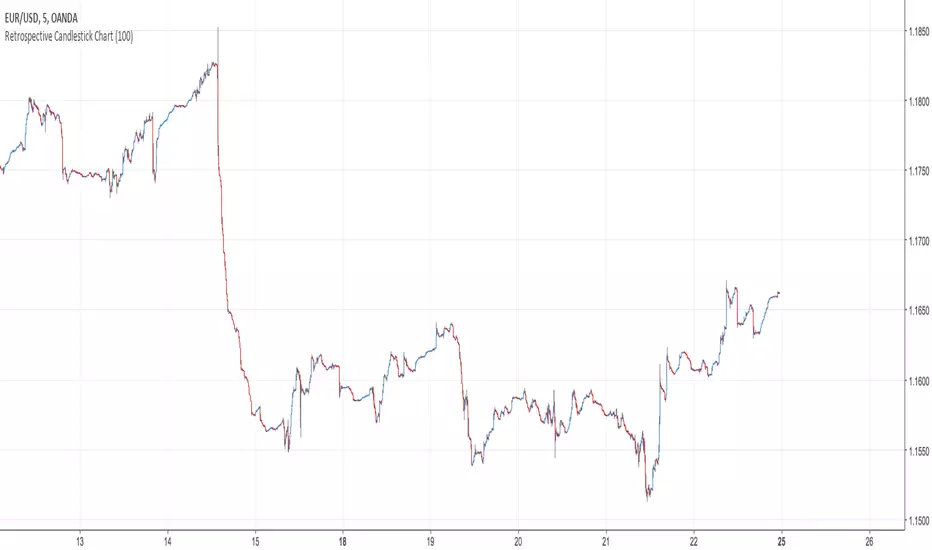
Retrospective Candlestick ChartWhen i was in Japan with some traders colleagues we talked about traditional charting tools from this country and how they changed the way we look at our charts today. Then suddenly one of the japanese traders i have met earlier said "Why not making another charting tool ? Smoother than Heikin-Ashi and including all the information a trader may need but easier to interpret".
So i had the idea of averaging the input and the output of the respective close / open / high and low price using a recursive exponential window functions, each values will be closer to their true value if they are volatile, if they are not then those values will look smoother, the length input represents the reactivity of the candles, high values represents smoother results but less reactive.The goal of those candles is to make all the information easier to interpret by a trader.
500 input length , the price look smoother, supports and resistances are easier to make.
The interpretation of highs and lows are important, the Retrospective Candlestick Chart save you time by showing only huge movements.
Double Exponential SmoothingSingle Exponential Smoothing ( ema ) does not excel in following the data when there is a trend. This situation can be improved by the introduction of a second equation with a second constant gamma .
The gamma constant cant be lower than 0 and cant be greater than 1, higher values of gamma create less lag while preserving smoothness.Higher values of length must be followed by higher values of gamma in order to keep the lag low.
The first smoothing part consist of a classic ema but we add s-s1 to the previous smoothed value, this will help decrease lag.The second smoothing part then updates the trend, which is expressed as the difference between the last two values.

VFilterAlthough this script is inspired by the design of Elder Impulse script created by LazyBear, the engine is not the same.
The goal of this indicator is to filter price movement, establish direction, and manage risk. This indicator is not be used on its own, its only to be used to help establish entrys and exits.
The signals are created using a privately developed moving average on multiple time frames.
HOW TO
15, 60, 120, or 240 min chart
Green = Buy signal
Red = Sell signal
Blue = Bullish consolidation, or an aggressive/riskier buy signal
Yellow = Bearish consolidation. or an aggressive/riskier sell signal
Adjustment value is high due to the nature of the moving averages. Try using 400, 700, 900, or 950 for best results.
I suggest using this indicator with MACD and a levels indicator for price targets.

Finite Impulse Response (FIR) FilterFinite Impulse Response (FIR) Filter indicator script.
This indicator was originally developed by John F. Ehlers (Stocks & Commodities V. 20:7 (26-31): Zero-Lag Data Smoothers).
NOTE: Ehlers' favorite FIR filter had 1, 2, 3, 3, 2, 1, 0 coefficients.
Recursive Median FilterRecursive Median Filter indicator script.
This indicator was originally developed by John F. Ehlers (Stocks & Commodities V. 36:03 (8–11): Recursive Median Filters).
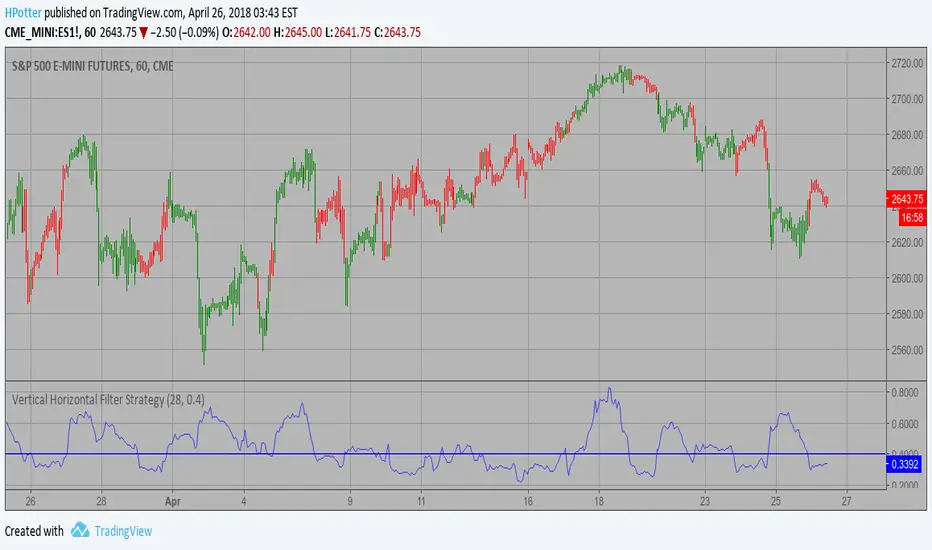
Vertical Horizontal Filter BacktestVertical Horizontal Filter was initiated by Adam White. It was first published
in a magazine called “Issues of Futures” in August, 1991. The Vertical Horizontal
Filter (VHF) is a very common Indicator used by traders to find out the Phase of
a Price Trend. Normally, a price trend can be in a Trending Phase or a Congestion
Phase/Choppy Movement Phase. Adam White created this particular Technical Indicator
to determine whether prices are trending in a particular direction or are they going
through a transitional period. He used it to measure the range of Futures available
in the market.
You can change long to short in the Input Settings
WARNING:
- For purpose educate only
- This script to change bars colors.

Vertical Horizontal Filter Strategy Vertical Horizontal Filter was initiated by Adam White. It was first published
in a magazine called “Issues of Futures” in August, 1991. The Vertical Horizontal
Filter (VHF) is a very common Indicator used by traders to find out the Phase of
a Price Trend. Normally, a price trend can be in a Trending Phase or a Congestion
Phase/Choppy Movement Phase. Adam White created this particular Technical Indicator
to determine whether prices are trending in a particular direction or are they going
through a transitional period. He used it to measure the range of Futures available
in the market.
WARNING:
- This script to change bars colors.
Above Below EMA OscillatorGives you an average of which side of the EMA price has close without the noise of the chart. Useful for measuring trend strength or as a trade filter (eg. only go long if above / below)
Support & Resistance FilterVisualize support and resistance levels with a high level of user control. Tired of meaningless, tightly clustered, support and resistance lines (shouldn't those just be considered bounces)? Just filter them out with the Bounce Filter. Want to visualize S&R in a crisp, clear new way? Use "Areas of S&R". Want to have a ridiculous amount of control over what counts for support and resistance in the first place? Use the Swing Filter (built-in). Perhaps most interesting... ...want to see support and resistance for (say) Bitfinex-BTC/USD on a Coinbase chart to see how they affect Coinbase candles? Then check out the advanced settings and have fun ;)
Support & Resistance levels are determined by historic pivots (swings). If a price breaks through the first resistance level, it may really take off. If it breaks through the second level, or through all five resistance levels, you might be on your way to the moon (Lambos not included). The inverse is true when the price breaks-down, through support levels.
5 Levels of Support and 5 levels of Resistance are available.
In a very bullish or bearish situation, searching back in time for the next highest Support or Resistance level can become quite demanding on TradingView's server. I've pushed it to the limit:
R2 & S2 look back 1,000 candles
R3 & S3 look back 2,250 candles
R4 & S4 look back 3,500 candles
R5 & S5 look back 4,999 candles
When TradingView's servers are getting a little bogged down, you may get an error about "a loop being longer than 100ms". That just comes with the territory of searching so many candles back. To resolve it, just click "Force Reload" in the settings.
I'd love to post the manual, the instructions for the settings, here in the description, but the publishing policy sets a limit as to how long these descriptions can be. So check the comments for a manual on how to use this indicator. And if you'd like to plug this kind of indicator into your scripts, just contact me for custom work.
~jdhadwin

Swing FilterSwing Filter allows you to identify market swings and use the settings to filter out the noise.
The concept is the same as Pine Script's built in pivothigh() and pivotlow(), except with a command center full of controls. Do you to only see swings that are a certain amount higher or lower than their neighboring candles? Want to filter out flash-crashes or freak-spikes? Do you want to count swing-highs or lows that are formed by multiple bars? ...how many? ...how strict? Do you only want swings that are already confirmed or do you want swings that are probably about to be confirmed? You get the idea.
Swing Filter was designed to be plugged into other tools. Swings are used to figure Support and Resistance in Technical Analysis (TA), so you'll find that it is swing filter working in the background of my Support & Resistance Indicator. The creator of this indicator would be happy to help you implement Swing Filter into your workflow, and even can unlock rewiring features that allow Trading View Premium customers to use outputs from other indicators as inputs to swing filter (indicator layering).
INDICATOR SETTINGS:
SWING HIGH VISIBILITY - Show the location of all filtered swing-highs, marked with green "H"
Show Unconfirmed Swing Highs - Whereas a confirmed swing high is shown with a green H, unconfirmed swing highs are shown with an orange H. Sometimes you want to see what could become a swing high before the final right-neighboring candle closes and confirms it. As long as the final right-side candle still has a lower high, we can show an unconfirmed swing high. Once the final right-side candle closes with a lower high, then we have a confirmed swing high. When the "# of Lower Bars to Right of Swing High" setting is set to a number greater than 1, keep in mind that unconfirmed candles will only ever appear one candle prior to confirmation.
# of Lower Bars to Left of Swing High - Swing highs are calculated based on being higher than neighboring candles. How many candles do you want to check to the left-side of a swing high?
# of Lower Bars to Right of Swing High - Swing highs are calculated based on being higher than neighboring candles. How many candles do you want to check to the right-side of a swing high?
Must be This % Higher Than Left Bars - Filter out highs that aren't high enough. "0.5" would require your swing highs to be at least half a percent higher than the high of its confirming left-side bars.
Must be This % Higher Than Right Bars - Filter out highs that aren't high enough. "1" would require your swing highs to be at least one percent higher than the high of its confirming right-side bars.
Multibar Highs - # Bars Allowed to Form High - Filter out or allow highs that are formed at a transition from one bar to another. Especially on low spread exchanges like GDAX, highs may be formed by many consecutive bars, formed by persistant impenetrable buy/sell walls. When using multibar highs, they are counted as a single candle: the swing high will be marked on the right-most high of the multi-bar high, and then the left-side bars are counted from the left-most high of the multi-bar high.
Multibar Highs Strict-Mode - Some multibar highs are just the result of chance, meaning that the first candle reached it's high, went back down, then the second candle reached the same high at a later time. Strict mode will filter these out and only show multibar swing highs that were formed when a candle closed at its high and the next candle opened at its same high. How strict? It allows a one penny difference (for negligible spreads). It also doesn't care about the candles' lows, which leaves room for a future super-strict mode.
*For the complete list of settings and instructions see comments below (sorry they're listed in backwards order below, and the publishing rules won't let me put them all here (too long))
