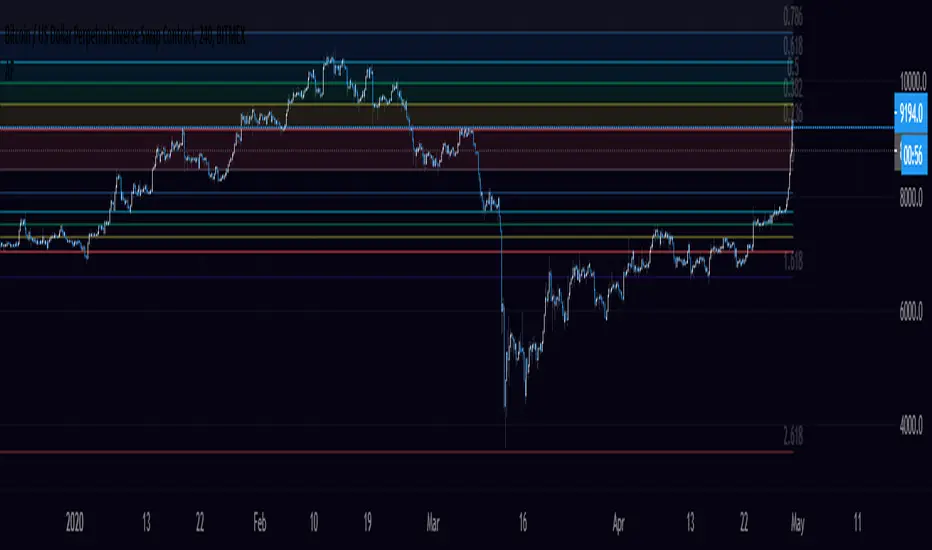
FIB Extensions and RetracmentsThis Indicator will help you find price levels.
The indicator analyzes yearly closing prices . It calculates extensions and retracement.
If you are a Forex trader, add zero to the variable in the input section.
The indicator does not specify tops or bottoms.
When you apply it to your chart, uncheck all the boxes(levels and mids) and keep the plots. this will make it zoomed in without compressing the whole chart.
If you are interested, please send me private message.
Fibonacci Düzeltmesi

GC-ShorterTimeFrame (STF) (GC)This is a fractal version of the higher time frame Fib for GC . This is a Shorter Time Frame Fib level indicator. To be used with Longer Time frame Indicator. Though it can be used independently. It shows where the market is looking to go and where it has been. When the market get above one level ( white bar, for example) look for price action to continue to the next level (white bar). If it breaks below the white bar look for price action to go the next level below for support. It is fractal in nature. It is fib levels inside longer time frame fib levels. I hope it will impress! More importantly I hope you can make some money! It is great for having targets and support levels. It helps in knowing why the market may continue in a direction. For example: When the price action has already moved up, why does it keep going up, because it hasn't reached targeted fib level, yet. Same reason price action may move lower once it breaks a particular level. It is looking for its fib level support. I know Gold is in the spot light now...as most of the time. This should help trade smaller time frames. If it drops below or goes above this range I can publish more levels..just ask if I forget. Thx

GC-LongerTimeFrame (LTF) - Maroon, Green, Black/White (GC)Let's bring GOLD to life here! Tis the season...like always for gold. This is a Longer Time Frame Fib level indicator. To be used with Longer Time frame Indicator. Though it can be used independently. It shows where the market is looking to go and where it has been. When the market get above one level ( white bar, for example) look for price action to continue to the next level (white bar). If it breaks below the white bar look for price action to go the next level below for support. It is fractal in nature. It is fib levels inside longer time frame fib levels. I hope it will impress! More importantly I hope you can make some money! It is great for having targets and support levels. It helps in knowing why the market may continue in a direction. For example: When the price action has already moved up, why does it keep going up, because it hasn't reached targeted fib level, yet. Same reason price action may move lower once it breaks a particular level. It is looking for its fib level support. I will add this as well. the third white bar is a reversal bar. If it breaks the top it wants to continue onward. The first white bar is a pullback bar to the bar below that is between the green bars (unless market is actively riding the 8 sma)

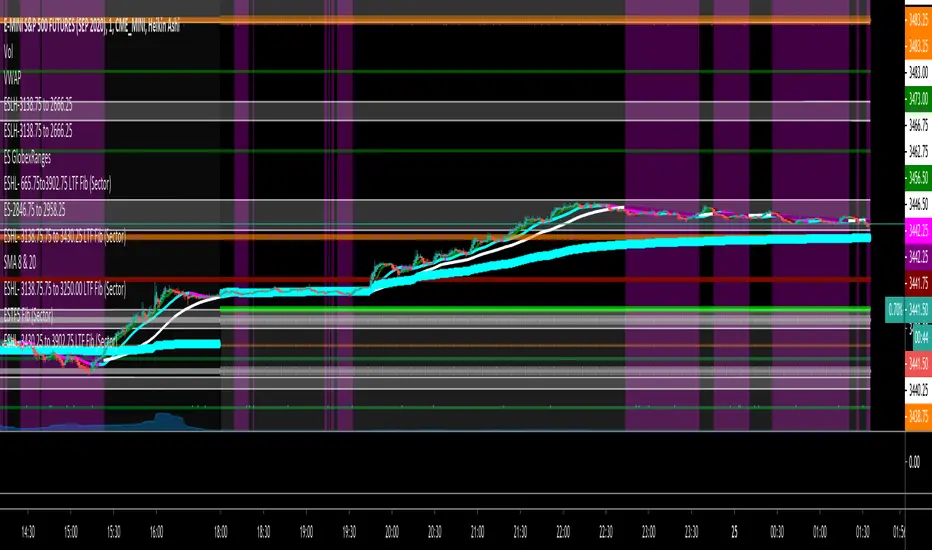
ES-3430.25 to 3902.75 ShorterTimeFrame (STF) This is a Shorter Time Frame Fib level indicator. To be used with Longer Time frame Indicator. Though it can be used independently. It shows where the market is looking to go and where it has been. When the market get above one level ( white bar, for example) look for price action to continue to the next level (white bar). If it breaks below the white bar look for price action to go the next level below for support. It is fractal in nature. It is fib levels inside longer time frame fib levels. I hope it will impress! More importantly I hope you can make some money! It is great for having targets and support levels. It helps in knowing why the market may continue in a direction. For example: When the price action has already moved up, why does it keep going up, because it hasn't reached targeted fib level, yet. Same reason price action may move lower once it breaks a particular level. It is looking for its fib level support.
NQ-ShorterTimeFrame (STF) - Maroon, Green, Black/White (NQ)This is a Shorter Time Frame Fib level indicator. To be used with Longer Time frame Indicator. Though it can be used independently. It shows where the market is looking to go and where it has been. When the market get above one level ( white bar, for example) look for price action to continue to the next level (white bar). If it breaks below the white bar look for price action to go the next level below for support. It is fractal in nature. It is fib levels inside longer time frame fib levels. I hope it will impress! More importantly I hope you can make some money! It is great for having targets and support levels. It helps in knowing why the market may continue in a direction. For example: When the price action has already moved up, why does it keep going up, because it hasn't reached targeted fib level, yet. Same reason price action may move lower once it breaks a particular level. It is looking for its fib level support.

NQ-ShorterTimeFrame2 (STF2) - Maroon, Green, Black/White (NQ)This is a Shorter Time Frame Fib level indicator. To be used with Longer Time frame Indicator. Though it can be used independently. It shows where the market is looking to go and where it has been. When the market get above one level ( white bar, for example) look for price action to continue to the next level (white bar). If it breaks below the white bar look for price action to go the next level below for support. It is fractal in nature. It is fib levels inside longer time frame fib levels. I hope it will impress! More importantly I hope you can make some money! It is great for having targets and support levels. It helps in knowing why the market may continue in a direction. For example: When the price action has already moved up, why does it keep going up, because it hasn't reached targeted fib level, yet. Same reason price action may move lower once it breaks a particular level. It is looking for its fib level support.


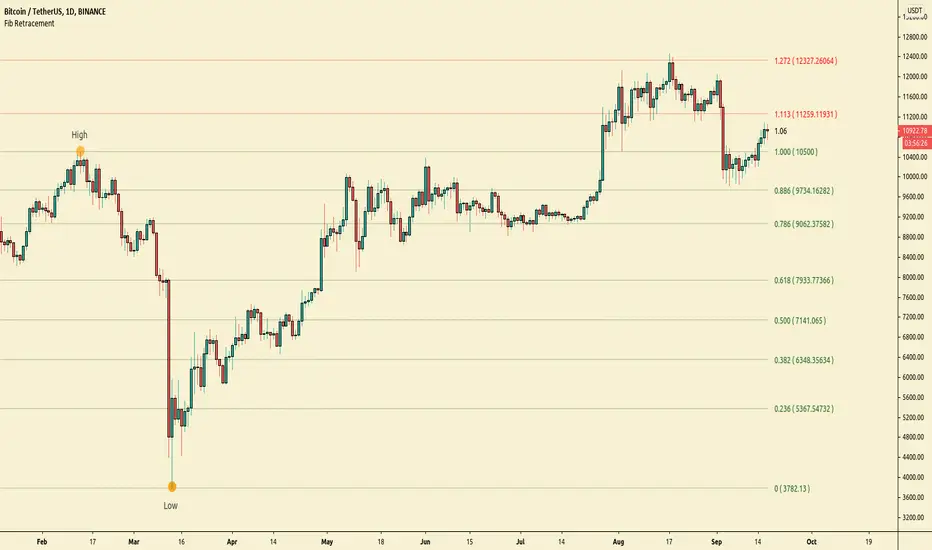
Simple Fibonacci RetracementSimple Fibonacci Retracement is a free and easy to use script to plot Fibonacci levels, for any assets like Stocks, Forex, Commodities , Cryptocurrencies etc. on any time frame chart.
Fibonacci Levels can be plotted using Lookback or manual Price input from the settings.
1. Lookback type - Candles
Determines the High and Low price of the user input number of Candles back (100 default) and plots Fibonacci Levels based on the calculated High and Low for the number of candles in the past from the current candle. The levels stay intact on any time frame as long as no new Highs or Lows are formed.
2. Lookback type - Days
Determines the High and Low price of the user input number of Days back (100 default) and plots Fibonacci Levels based on the calculated High and Low for the number of days in the past from the day of the current bar. The levels stay intact on any time frame as long as no new Highs or Lows are formed.
3. Manual Price Input
Plots Fibonacci Levels based on the user specified High and Low Price in the settings input fields. The levels stay intact on any time frame irrespective of new Highs or Lows being formed. Manual Price Input will enable the trader to keep the Levels intact and visually see the higher Fibonacci Retracement levels, when the price crosses beyond 100% retracement. On the other two lookback types, the Fibonacci levels are displayed only upto 100% retracement.
The Fibonacci levels can also be reversed by enabling 'Reverse' option from the settings.
Fibs, Pivots & SupportA 3-in-1 indicator for displaying Fibonacci retracement and pivot levels over custom periods along with areas of previous major support. Each of the three tools can be toggled on/off.
Used properly, these should give you a better idea of where to place orders and take profit.
Alerts are built in but had to remain somewhat generic due to data point limitations. There are alerts for crossing and crossing up/down over each category of line.

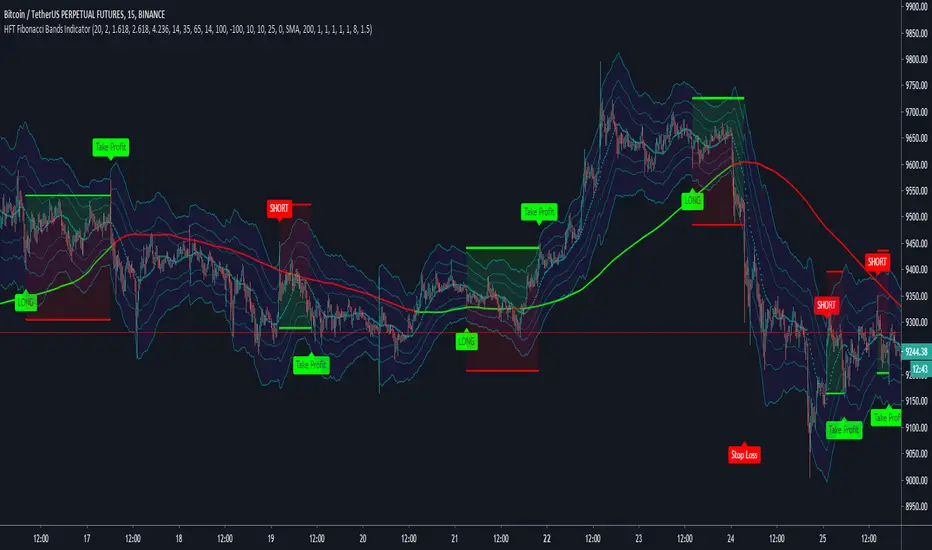
HFT Fibonacci Bands Indicator
Default Settings are meant to be used in XBT/USD chart on 15 min time frame. If you want to use for another asset on another time frame YOU MUST CHANGE THE SETTINGS
This is a Fibonacci bands based trading indicator developed by HFT Research. It is a highly customizable indicator and provided endless opportunities to find profitable trades in the market.
Use Fib BB
This is the main decision maker of the strategy. Tuning the settings of this portion of the strategy will change the outcome the most. We have provided default settings. However, they are only good for 15min chart on Bitcoin. Please adjust accordingly.
Fib BB Length: This setting adjusts the middle line of your Fibonacci Bands. It is the moving average that you take it as base for your Fibonacci bands. Default value is currently 20.
Fib Level to Use for Entry: Here, you adjust which one of the Fibonacci Ratio levels you would like to use for your entry. You can only choose one of the following options.
Fibonacci Ratio 1
This is your Fib ratio level 1 and you can put any number here you would like
Fibonacci Ratio 2
This is your Fib ratio level 2 and you can put any number here you would like
Fibonacci Ratio 3
This is your Fib ratio level 3 and you can put any number here you would like
Please keep in mind that Ratio 1 should be higher than Ratio 2 and Ratio 2 should be higher than Ratio 3.
Use RSI
You can also turn on and off the RSI as well. Alternatively, there is an option to use RSI on a different time frame than you are currently on. For example, if you are looking at the 5min chart to use Bollinger bands but you would like to look at the RSI value on the 15min chart. You can do so by selecting the custom RSI timeframe as well as adjusting the Oversold and Overbought value.
Use CCI
Commodity Channel Index is an indicator developed by Donald Lambert. It is a momentum-based oscillator used to help determine when an investment vehicle is reaching conditions of being overbought or oversold. It also used to asses price trend direction and strength. Default settings are usually the safest and the best fit.
Use VWAP
VWAP stands for volume weighted average price. It is an extremely useful indicator when trading intra-day. It does reset every trading session which is at 00:00 UTC. Instead of looking at x number of candles and providing an average price, it will take into consideration volume that’s traded at a certain price and weigh it accordingly.
Use ADX
ADX stands for average directional index. It is an indicator that measures volatility in the market. Unfortunately, the worst market condition for this strategy is sideways market. ADX becomes a useful tool since it can detect trend. If the volatility is low and there is no real price movement, ADX will pick that up and will not let you get in trades during a sideways market. It will allow you to enter trades only when the market is trending.
Use MA Filters
Lookback: It is an option to look back x number of candles to validate the price crossing. If the market is choppy and the price keeps crossing up and down the moving average you have chosen, it will generate a lot of “noisy” signals. This option allows you to confirm the cross by selecting how many candles the price needs to stay above or below the moving average. Setting it 0 will turn it off.
MA Filter Type: There is a selection of moving averages that is available on TradingView currently. You can choose from 14 different moving average types to detect the trend as accurate as possible.
Filter Length: You can select the length of your moving average. Most commonly used length being 50,100 and 200.
Filter Type: This is our propriety smoothing method in order to make the moving averages lag less and influence the way they are calculated slightly. Type 1 being the normal calculation and type 2 being the secret sauce.
Reverse MA Filter: This option allows you to use the moving average in reverse. For example, the strategy will go long when the price is above the moving average. However, if you use the reserve MA Filter, you will go short when the price is above the moving average. This method works best in sideways market where price usually retraces back to the moving average. So, in an anticipation of price reverting back to the moving average, it is a useful piece of option to use during sideway markets.
If you want to get access to this indicator please DM me or visit our website.
Fibonacci MTFi just made Fibonacci which you can change MTF
Defalt is Daily but you can choose other time, the Fibonacci for the previous time period will be displayed.
I hope that it will be help someoen :)
MTF付のフィボナッチを作ってみました。
ご意見等あればコメントください

Today High/Low Fibo LineDraw Fibonacci retracements using High/Low of the today
Draw Fibonacci retracements using High/Low of the week
A Fibonacci value of 0 will hide the line

Consolidation Zones - LiveHello Traders!
This is the script that finds Consolidation Zones in Realtime.
How it works?
- The script finds highest/lowest bars by using "Loopback Period"
- Then it calculates direction
- By using the direction and highest/lowest bar info it calculates consolidation zones in realtime
- If the length of consolidation area is equal/greater than user-defined min length then this area is shown as consolidation zone
- Then Consolidation Zone extends automatically if there is no breakout
if you increase the Loopback Length then you get bigger consolidation zones:
You have option to "Paint Consolidation Area" or not:
Enjoy!

NQLH-LongerTimeFrame (LTF) - Maroon, Green, Black/White (NQLH)This is a Longerer Time Frame Fib level indicator. It shows where the NQ market is looking to go and where it has been. When the market gets above one level ( white bar, for example) look for price action to continue to the next level. If it breaks below the white bar look for it to go the next level below for support. It is great for having targets. It helps in knowing why the market may continue in a direction. For example: When the price action has already moved up, why does it keep going up, because it hasn't reached targeted fib level yet. Same reason price action may move lower. It is looking for its fib level support. You can find them yourself by taking the red level fibs as plug numbers. This makes it fractal in nature. Find the fractal or/of inner fibs by plugging in two consecutive red level fib numbers as the plug numbers. With two plug number it will work for any instrument at any level. Use this indicator for a daily or weekly chart. The close on the day or the week would indicate where the next target level is at.

Auto Fibonacci Levels and DMA WMA Resistances by Ahmad DukhanHi,
This indicator will give you from -100% to 300% of the Fibonacci levels that is carefully calculated that doesn't change with frame change and is very reliable regardless which symbol you are trading (Ask for screenshot proof for symbol you trade)
Also included with
- Fibonacci Levels
Daily S/R
- 20 DMA
- 50 DMA
- 100 DMA
- 200 DMA
Weekly S/R
- 20 WMA
- 50 WMA
- 100 WMA
- 200 WMA
With options to toggle/enable/disable any of the above
For more details on how to get this indicator DM me
Thanks

Freedom FibThis script will allow to automatically draw levels on the chart for a potential pullback play like shown in this snapshot here
It will draw risk/reward levels upon your favorite ema (default is 13ema) as the price goes and it will work for both long or short scenarios for a potential trend continuation play.
You got the option to align your level to match exactly your selected ema or to be placed in between the first two levels (default settings) if you prefer.
I personally use this one settings for shorter time frames (up to 3min) and the aligned one for higher time frames.

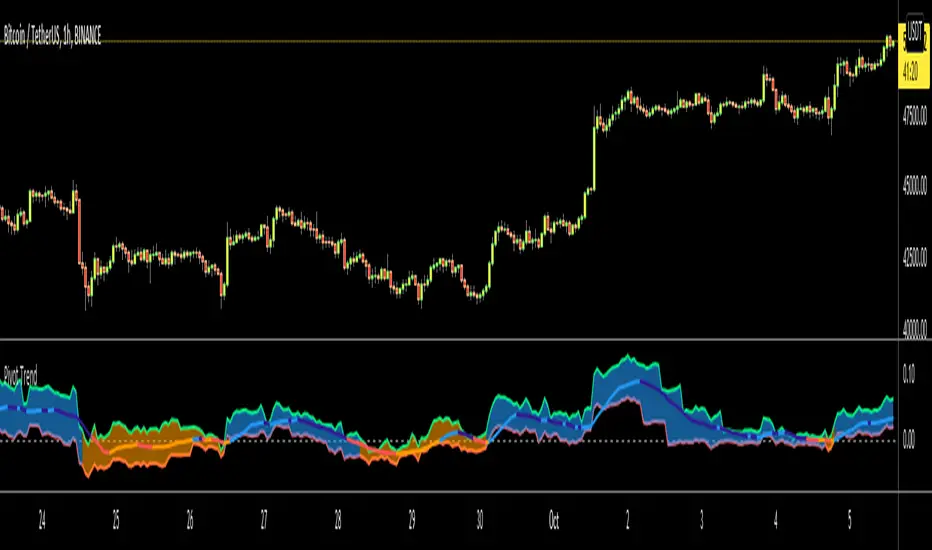
Pivot TrendHello Traders,
Another original idea is here with you. Actualy I can say that it's a breakout strategy that uses multiple Pivot Point's averages.
How it works?
- it finds the Pivot Points, you can set the length as you want
- it gets averages of Pivot Highs and Pivot Lows, you can set the number of Pivot Points to be included
- it compares the current closing price with averages of Pivot Highs and Pivot Lows
- if both are positive or negative then trend changes
You have two options:
- Pivot Point Period => is the length that is used to find Pivot Points. means it checks left/right bars if it's Pivot Point (4 by default)
- Number of PP to check => is the number of Pivot Points that the script finds and calculates the averages (3 by default)
An Example with the settings Pivot Point Period = 5 and Number of PP to check = 2
Play with settings as you wish. Comments are welcome, together we can improve it ;)
Enjoy!
Auto FibonacciA series of Fibonacci sequences using a variety of triggers to base highs and lows off.
High and low look back length can be altered, fibs and fib extensions can be shown or hidden and the background can be filled or transparent.
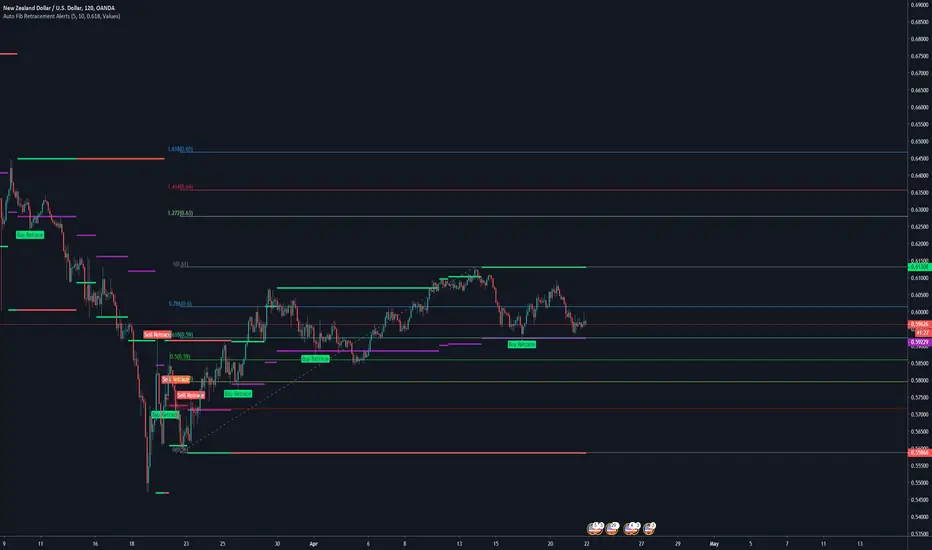
Auto Fib Retracement AlertsFor the fibonacci traders.
The Auto Fib Retracement Is a good indicator for tradingview to show you the current alerts and points to watch in the market
IMPORTANT SETTING => Retracement
This controls your alert levels
I have modified it to deliver the following
+Custom Fib retracement level alerts
+Drawing of old levels and retracement levels
+Backtesting Old Alerts
There are two shapes drawn on the chart;
Shown When the fib end is attained and market retraces back to your level
1. Buy retracement -
2. Sell retracement
How are they detected?
When we have new levels in the market; this is when the red or gree line changes, we calculate the new fib level that we will be watching for retracement
This is the purple level drawn on the chart
When the market first crosses below or above this level, The alert will be fired.
Consequent crosses are not updated
Enjoy! 😍
Originally requested by trade atechproduction
Donchian Channels with Auto Fibonacci RetracementRichard Donchian created Donchian Channels, which is a type of moving average indicator and a look-alike of other support and resistance trading indicators like Bollinger Bands.
Donchian Channels has a simple plotting of highest high and lowest low of the last “n” periods.
The “n” periods is based on the trader’s choice, who can select the period according to their requirements ranging from a day, hour and minutes etc.
Traders use Donchian Channels to understand the support and resistance levels.
Donchian Channels is a popular indicator for determining volatility in market prices.
The channels are wider when there are heavy price fluctuations and narrow when prices are relatively flat.
Generally, investors use 20-periods with the Donchian Channels as the default trading setting, but this value can be tweaked based on your trading style.
Donchian channels are mainly used to identify the breakout of a stock or any traded entity enabling traders to take either long or short positions.
Traders can take a long position, if the stock is trading higher than the Donchian channels “n” period and book their profits/short the stock if it is trading below the DC channels “n” period.
The middle band is the average of the upper and lower bands.
The middle band in Donchian channels could also be used as a breakout indicator.
If the stock rises above the middle band of the Donchian channels, then you can open a long position.
On the contrary, if the stock is trading below the middle band of the Donchian channel, then a trader can open a short position.
Combining Donchian Channel trading strategies with other trading strategies might decrease the false entry/exit signals and give a clearer picture of trading opportunities.
If you start to trade a choppy market on an intraday basis, you will be overloaded with false signals.
So, what I noticed is that in order for things to become clearer, we just need to increase the time frame.
Where Donchian Channels Can Fail You
It’s likely not the indicator but more likely our misinterpretation of the signals.
Few areas where the Donchian channel may be tough to read.
Low float stocks are not bound by any indicator, especially Donchian channels.
The challenge with the Donchian channels is that it does not factor in the most recent market volatility.
The indicators provide an equal weighting to all data points.
Therefore when a low float stock picks up and goes on a run, the lower bounds not capture the price movements quickly enough, thus risking giving back more profits than necessary.

EMA / Fibonacci / Bollinger Indicator for Market Sniper SuiteHello all,
this script was created to be used in conjunction with Market Sniper - Trading/Scalping Suite . It was put together to make instrument analysis faster and less convoluted.
It includes
9 Fibonacci Exponential moving averages + 2 Simple moving averages
Auto Fibonacci levels - Tradingviews Auto Fib Retracement - with some modifications
Bollinger Bands - To faster spot squeeze momentum

Auto Fibonacci Indicator for All Types of Charts/TickersHi,
Pine Version: 4
I have created an indicator that will draw automagically all fibonacci level for any given Chart/Ticker or Frame. This works for anything below Monthly frame as bigger frames calculation algorithms are still in the lab.
For access contact me on private
Thanks

Fibonacci Retracament Levels - Only for intraday.Fibonacci Retracament Levels - Only for intraday.
Perfect and best levels.
Works on all scripts with 5 and 15 mins.
Try and keep me posted.
