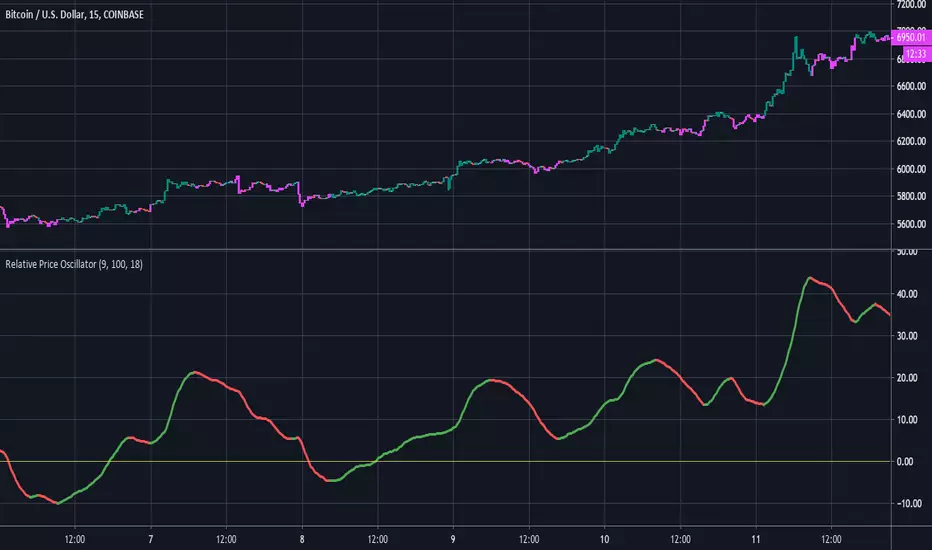
Relative Price OscillatorHere is a new experimental indicator we've been working on. The idea was to compare two EMA's of period midpoints to the actual closing price. The steps that were taken are listed below:
1.Calculate an EMA based on each period's midpoint ((High * Low) /2) for the last 9 periods.
2.Calculate an EMA based on each period's midpoint for the last 100 periods.
3. Divide the difference of the two EMA's by the closing price. ((EMA1 - EMA2) / Close).
4. Smooth the value from step #3 with an 18 period EMA. Multiply by 1000 for better scaling/visibility.
Using:
Bullish when line is green, bearish when line is red. Buy on first green, then sell on first red.
There is also an option to color the candles based on the RPO line.
Exponentialmovingaverages


Double EMA + ATR Trend FollowerThis indicator consists of a fast and slow EMA (default lengths are 50 and 9 periods) and an upper and lower ATR band. When combined, this combination gives traders an accurate picture of both trend strength and direction.
Users can modify the lengths of the fast and slow EMA , as well as the multipliers and length for the upper and lower ATR bands.

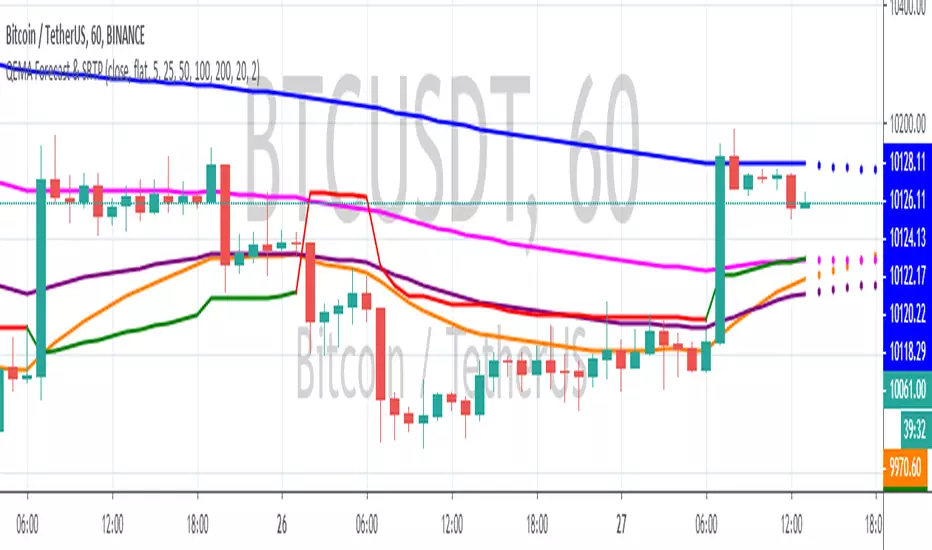
QEMA Forecast & SRTPThis script combine 4 EMA Forecast (21, 50, 100, 200) and a Stop and Reverse Signal based on volatility into one indicator.
You can select to use which EMA work best for you.
Hope you find it useful.
Palex 2.0Atualização do SETUP do saudoso Professor Alexandre Fernandes "Palex"
- Bandas de Bolliger (Standard) =
*Banda Superior = Média Móvel Simples (20 dias) + (2 x Desvio Padrão de 20 dias)
*Banda Inferior = Média Móvel Simples (20 dias) – (2 x Desvio Padrão de 20 dias)
- EMA 9 (Média Móvel Exponencial)
- SMA 21 (Média Móvel Simples)
- SMA 200 (Média Móvel Simples) Clássica MA 200 períodos
- SMA 400 (Média Móvel Simples)
- EMA 400 (Média Móvel Exponencial)
- WILD (Média Móvel Welles Wilder)
O mesmo usado pelo nosso grande Mestre PALEX!
Five EMA and Two SMA IndicatorIndicator Modeled After Krowns CrptoCave
-CryptoLumberJack
-BlazkingCryptoJunkies Web Slave Master

24/9 EMA with Bias & SignalsThis is a simple indicator that plots the 24 & 9 EMAs.
It also highlights the potential bias of the market (bull or bear) based on if the 9 EMA is above or below the 24 EMA.
In addition there are signal crosses that you can use for alerts.
This indicator is best used to confirm a particular underlying bias on the 5m, 15M, 1HR, 4HR, and Daily timeframes.
It's important to note on lower timeframes that the bias can be counter trend bias of the overall larger momentum of the instrument you are trading.
For clarity this means that many retraces get going when the 9 crosses the 24. But ultimately the larger timeframe bias will continue after this counter trend retraces.
Combining this indicator with value channels and ATR is what I recommend.

Extreme DeviationThis indicator calculates extreme deviation areas of the difference of zero-lag fast and slow exponential moving averages with volume (for Volume Weighted version). Here is a connection between the distance of prices to their respective moving averages (default periods are 50/200) and standard deviations (default period is 20) . Like in the academic literature, the idea behind this indicator depends on that prices tend to exhibit “reversal to the mean” attributes. By using both volume and standard deviation of moving averages, volatility is considered in calculations too.
The red zones are the “Extreme Zones” which signals and warns about possible incoming reversal. Because the indicator is semi non-directional, it is suggested to use it with a momentum indicator such as TTI , TPI or RSI . Using of momentum indicators becomes safer using it with ExDev/VoWExDev
The green zone is the “Trade Safe” areas which indicates that if the price and indicator moves in same directions, the price is trending or market has relatively greater volume (for Volume Weighted version) than past periods. On the other hand, if the indicator floats in gray “No Trade” zone, the market is in ranging mode probably. Signal line (black dashes, default is 55) can be used for new orders. In a scenario in which price and the indicator moves together in same direction and then indicator starts to change direction, indicates a possible trend reversal approaches in coming periods. Waiting for both momentum and ExDev/VoWExDev extreme zones would be a good strategy. Seeking for divergences between momentum and opposite ExDev ExDev/VoWExDev extreme zone is the best long/short strategy developed so far.
Notes:
VoWExDev refers to Volume Weighted Extreme Deviation
Multiplier adjusts the wave frequency of the indicator. Higher multiplier lowers the wave frequency of the indicator and vice versa.
Look Back is the calculation period of the standard deviation.
These two indicators are suitable for all markets for all time periods if there is enough back data to calculate. There would be significant differences between two versions due to volume as expected. For the markets lack of volume data, ExDev version is suggested to use.
Türkçe:
Bu indikatör, hacim ağırlıklı gecikmesiz üssel hareketli ortamaların birbirlerinden aşırı saptığı bölgeleri hesaplamaktadır. Fiyatın hareketli ortamaladan uzaklaşmasının standart sapması hesaplanarak aşırılık bölgeleri indikatör üzerinde gösterilmektedir. Bu indikatör, akademik çalışmalarda da bahsedilen “fiyat ortalamaya dönme eğilimindedir” teorisi üzerine geliştirilmiştir. Hareketli ortamala farklarının standart sapmasının hesaplanması ve hacim ile ilişkilendirilmesi ile volatilitede göz önünde bulundurularak indikatör hesaplamasına dahil edilmiş oldu.
İndikatördeki kırmızı bölgeler “Aşırılık Bölgelerini” gösterir ve muhtemel bir trend dönüşünün yaklaştığını sinyaller ve uyarır. İndikatör, fiyat yönünden yarı bağımsız hareket ettiği için TTI ,TPI ya da RSI gibi herhangi bir momentum indikatörü ile kullanılması önerilir. Momentum indikatörlerinin kullanılması bu indikatör ile birlikte daha güvenli hale gelmektedir.
Yeşil alan “Güvenli İşlem” bölgesini göstermektedir. Fiyat ve indikatör aynı yönde giderken piyasanın trendde olduğunu ve hacim ağırlıklı versiyonda da geçmiş dönemlere göre hacimin de göreceli olarak yükseldiğini göstermektedir. Diğer bir taraftan eğer indikatör gri “İşlem Yapma” bölgesinde dalgalanıyorsa piyasa muhtemelen yatay harekete geçmiştir. Sinyal çizgisi (kesik siyah çizgi, bazı 55) yeni işlemlere giriş için kullanılabilir. Fiyat ve indikatörün aynı yönde hareket ettiği ve indikatörün fiyattan önce yön değiştirmeye başladığı senaryoda indikatör, yaklaşan periyodlarda trendin dönebileceğini göstermektedir. Böyle bir senaryoda ExDev/VoWExDev ve momentum indikatörlerinin ikisinin de aşırılık bölgesine girmesinin beklenmesi iyi bir strateji olabilir. Momentum indikatörlerinde uyumsuzluk olduğu anlarda da indikatör aşırılık bölgesinde ise ve iki indikatörün birbirine göre de uyumsuz olduğu senaryolar şu ana kadar geliştirilmiş en başarılı stratejidir.
Notlar:
VoWExDev hacim ağırlıklı aşırı sapma indikatörünü tanımlamaktadır.
Multiplier/Çarpan, indikatörün dalga frekansını ayarlamaktadır. Çarpan yükseldikçe indikatör frekansı düşer veya tersi.
Look Back, standart sapmanın hesaplama periyodudur.
Bu indikatörler, eğer yeterli geçmiş veri varsa her piyasayda her zaman periyodunda kullanılabilir. Hacimden dolayı iki versiyon arasında bariz farklar olabilir ve bu beklenen bir şeydir. Hacim verisinin olmadığı marketlerde ExDev versiyonunun kullanılması önerilir.
Örnek stratejiler için/ For sample strategies:
kriptomuhtar.com/dersler/asiri-sapma-ve-hacim-agirlikli-asiri-sapma/

Volume Weigthed Extreme DeviationThis indicator calculates extreme deviation areas of the difference of zero-lag fast and slow exponential moving averages with volume (for Volume Weighted version). Here is a connection between the distance of prices to their respective moving averages (default periods are 50/200) and standard deviations (default period is 20) . Like in the academic literature, the idea behind this indicator depends on that prices tend to exhibit “reversal to the mean” attributes. By using both volume and standard deviation of moving averages, volatility is considered in calculations too.
The red zones are the “Extreme Zones” which signals and warns about possible incoming reversal. Because the indicator is semi non-directional, it is suggested to use it with a momentum indicator such as TTI , TPI or RSI . Using of momentum indicators becomes safer using it with ExDev/VoWExDev
The green zone is the “Trade Safe” areas which indicates that if the price and indicator moves in same directions, the price is trending or market has relatively greater volume (for Volume Weighted version) than past periods. On the other hand, if the indicator floats in gray “No Trade” zone, the market is in ranging mode probably. Signal line (black dashes, default is 55) can be used for new orders. In a scenario in which price and the indicator moves together in same direction and then indicator starts to change direction, indicates a possible trend reversal approaches in coming periods. Waiting for both momentum and ExDev/VoWExDev extreme zones would be a good strategy. Seeking for divergences between momentum and opposite ExDev ExDev/VoWExDev extreme zone is the best long/short strategy developed so far.
Notes:
VoWExDev refers to Volume Weighted Extreme Deviation
Multiplier adjusts the wave frequency of the indicator. Higher multiplier lowers the wave frequency of the indicator and vice versa.
Look Back is the calculation period of the standard deviation.
These two indicators are suitable for all markets for all time periods if there is enough back data to calculate. There would be significant differences between two versions due to volume as expected. For the markets lack of volume data, ExDev version is suggested to use.
Türkçe:
Bu indikatör, hacim ağırlıklı gecikmesiz üssel hareketli ortamaların birbirlerinden aşırı saptığı bölgeleri hesaplamaktadır. Fiyatın hareketli ortamaladan uzaklaşmasının standart sapması hesaplanarak aşırılık bölgeleri indikatör üzerinde gösterilmektedir. Bu indikatör, akademik çalışmalarda da bahsedilen “fiyat ortalamaya dönme eğilimindedir” teorisi üzerine geliştirilmiştir. Hareketli ortamala farklarının standart sapmasının hesaplanması ve hacim ile ilişkilendirilmesi ile volatilitede göz önünde bulundurularak indikatör hesaplamasına dahil edilmiş oldu.
İndikatördeki kırmızı bölgeler “Aşırılık Bölgelerini” gösterir ve muhtemel bir trend dönüşünün yaklaştığını sinyaller ve uyarır. İndikatör, fiyat yönünden yarı bağımsız hareket ettiği için TTI ,TPI ya da RSI gibi herhangi bir momentum indikatörü ile kullanılması önerilir. Momentum indikatörlerinin kullanılması bu indikatör ile birlikte daha güvenli hale gelmektedir.
Yeşil alan “Güvenli İşlem” bölgesini göstermektedir. Fiyat ve indikatör aynı yönde giderken piyasanın trendde olduğunu ve hacim ağırlıklı versiyonda da geçmiş dönemlere göre hacimin de göreceli olarak yükseldiğini göstermektedir. Diğer bir taraftan eğer indikatör gri “İşlem Yapma” bölgesinde dalgalanıyorsa piyasa muhtemelen yatay harekete geçmiştir. Sinyal çizgisi (kesik siyah çizgi, bazı 55) yeni işlemlere giriş için kullanılabilir. Fiyat ve indikatörün aynı yönde hareket ettiği ve indikatörün fiyattan önce yön değiştirmeye başladığı senaryoda indikatör, yaklaşan periyodlarda trendin dönebileceğini göstermektedir. Böyle bir senaryoda ExDev/VoWExDev ve momentum indikatörlerinin ikisinin de aşırılık bölgesine girmesinin beklenmesi iyi bir strateji olabilir. Momentum indikatörlerinde uyumsuzluk olduğu anlarda da indikatör aşırılık bölgesinde ise ve iki indikatörün birbirine göre de uyumsuz olduğu senaryolar şu ana kadar geliştirilmiş en başarılı stratejidir.
Notlar:
VoWExDev hacim ağırlıklı aşırı sapma indikatörünü tanımlamaktadır.
Multiplier/Çarpan, indikatörün dalga frekansını ayarlamaktadır. Çarpan yükseldikçe indikatör frekansı düşer veya tersi.
Look Back, standart sapmanın hesaplama periyodudur.
Bu indikatörler, eğer yeterli geçmiş veri varsa her piyasayda her zaman periyodunda kullanılabilir. Hacimden dolayı iki versiyon arasında bariz farklar olabilir ve bu beklenen bir şeydir. Hacim verisinin olmadığı marketlerde ExDev versiyonunun kullanılması önerilir.
Örnek stratejiler için/ For sample strategies:
kriptomuhtar.com/dersler/asiri-sapma-ve-hacim-agirlikli-asiri-sapma/

Bollinger Bands + Moving AveragesBollinger Bands + 3 MAs(EMA)
Exponential Moving Averages (EMA) 13, 62 & 200 (default values)
Bollingers Band (BB) 20 (default value)
Values can be amended based on your trading strategy.

Alessio Rastani's 21,55,100 EMA & 100 SMAMeant for any market, this script is a technique shown by Alessio Rastani that utilizes exponential and simple moving averages that are used to anticipate potential buying & shorting opportunities for Technical Analysts.

Triple Moving Averages with Bollinger BandsCombines 3 moving averages with Bollinger Bands. Each moving average can be configured to be SMA or EMA.

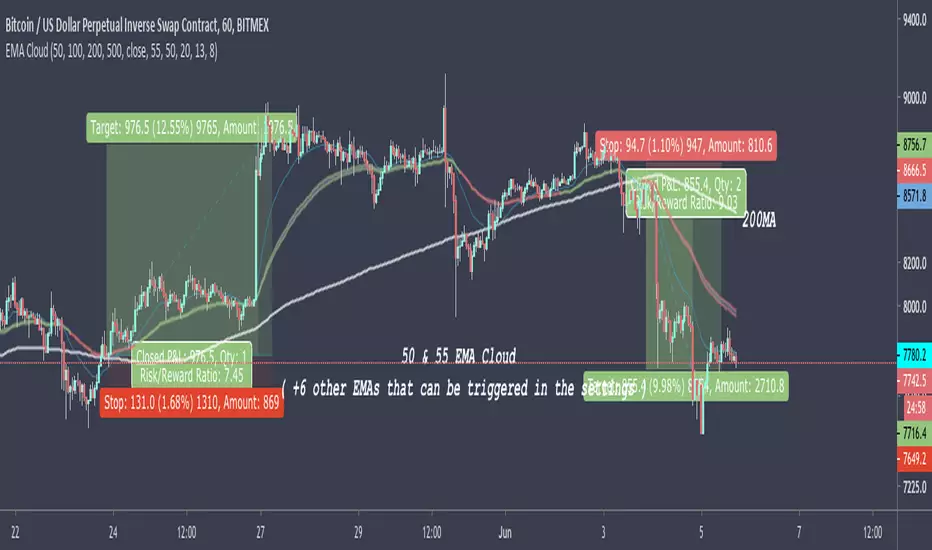
50 & 55 EMA CloudAfter testing thousands of indicators over the years, this simple EMA cloud indicator that I built is still my main weapon. It's always the first one I add to a blank charts and that is not going to change anytime soon.
I find EMAs and MAs are such underrated tools, By observing the price action surrounding these, I can see straight away if it's a good time to get into a trade or not.
As seen here, I also use the 200MA along with the 50/55EMA cloud to find extra strong support and resistances. If price starts to reject both the cloud and the 200MA at the same time/level, then it's a very good indication the price is going to make a big move in that direction as seen here in this chart.

EMA's 5/20/50/200For those who want to use multiple EMA's in a single indicator.
You can also change ema by just editing in pine editor.
For example:
open pine editor and then just alter => "short = ema(close, 5)" to "short = ema(close, 6)"
By doing this your short ema will be changed at your desire.
Just like this you can increase more ema in your script.
For any help you can pm me :)

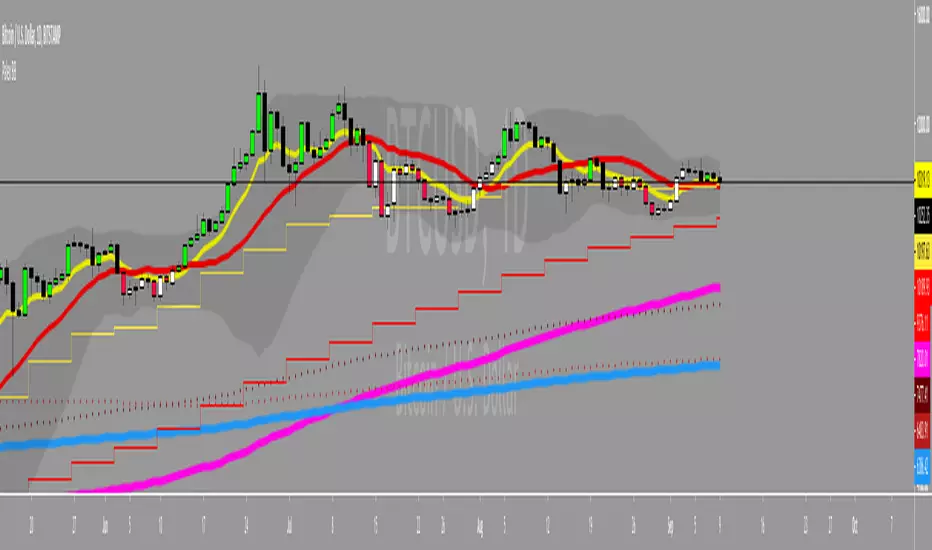
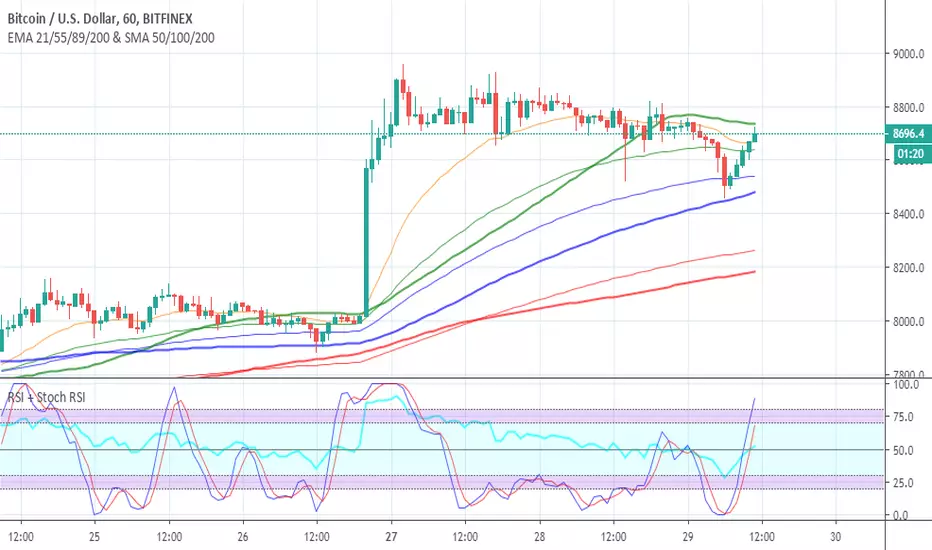
EMA 21/55/89/200 & SMA 50/100/200Free to use indicator combining all important time periods for two of the most valuable trading tools: EMAs and SMAs . As you can see on the chart and previous time periods, BTC often bounces off these, giving you an insight into possible future price movement. Add to your favourite scripts now at the bottom of this page and stay ahead of the game.
Switching off all except the most important periods in the indicator settings (21 & 55 EMA + 100 & 200 MA) can help keep a nice clean trading chart, if that is your preference.
SIMPLE MOVING AVERAGE
Smooths out the price across each period to reveal short, medium and long term trends and potential areas of support or resistance.
50, 100 and 200 are three of the most commonly used/respected moving averages.
The 200MA in particular provides very strong support/resistance on longer time frames.
EXPONENTIAL MOVING AVERAGE
A slightly more sophisticated version of the moving average, the EMA gives more weight to recent price action (i.e. a recent big move up/down will be reflection sooner... "the trend is your friend").
21, 55, 89 and 200 are four of the most commonly used/respected exponential moving averages.
The 21 and 55 EMA are undoubtedly the most powerful, and somewhat a self-fulfilling prophecy since so many people follow them.
Just so you know...
Green = 55/50, blue = 89/100, red = 200/200
EMAs are shown with thinner lines (as they change direction faster, think light and quick)
SMAs are shown with thicker lines (as they change direction slower, think heavier and more respected)
My free Combined RSI and Stochastic RSI Indicator , is also shown on the chart above and will save you valuable space on your trading screen, since you are strictly limited to the number of indicators you can use at one time. Give it a try and you'll wonder why you ever had separate indicators for RSI and Stoch RSI clogging up both your screen and indicator allowance.
These tools are for educational purposes only and not a recommendation to buy or sell. Always do your own research before trading.


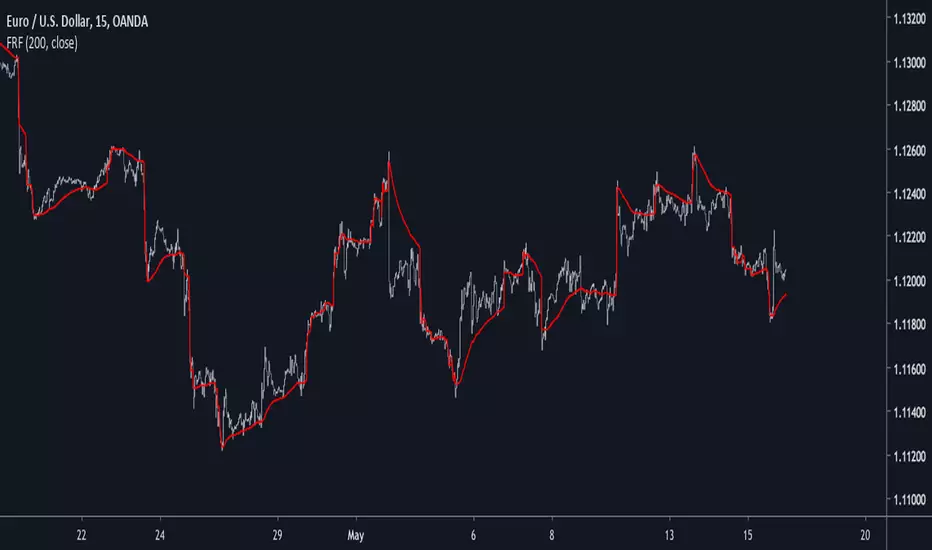
Falling-Rising FilterIntroduction
This is a modification of an old indicator i made. This filter aim to adapt to market trend by creating a smoothing constant using highest and lowest functions. This filter is visually similar to the edge-preserving filter, this similarity can make this filter quite good for MA cross strategies.
On The Filter Code
a = nz(a ) + alpha*nz(error ) + beta*nz(error )
The first 3 terms describe a simple exponential filter where error = price - a , beta introduce the adaptive part. beta is equal to 1 when the price is greater or lower than any past price over length period, else beta is equal to alpha , someone could ask why we use two smoothing variable (alpha, beta) instead of only beta thus having :
a = nz(a ) + beta*nz(error )
well alpha make the filter converge faster to the price thus having a better estimation.
In blue the filter using only beta and in red the filter using alpha and beta with both length = 200 , the red filter converge faster to the price, if you need smoother results but less precise estimation only use beta .
Conclusion
I have presented a simple indicator using rising/falling functions to calculate an adaptive filter, this also show that when you create an exponential filter you can use more terms instead of only a = a + alpha*(price - a ) . I hope you find this indicator useful.
Thanks for reading !
7/20 EMAs 50/100/200 SMAs as One Script.This is one of the scripts I use daily as a full time daytrader. It works well for me to predict MA resistance and support levels and has been very reliable.
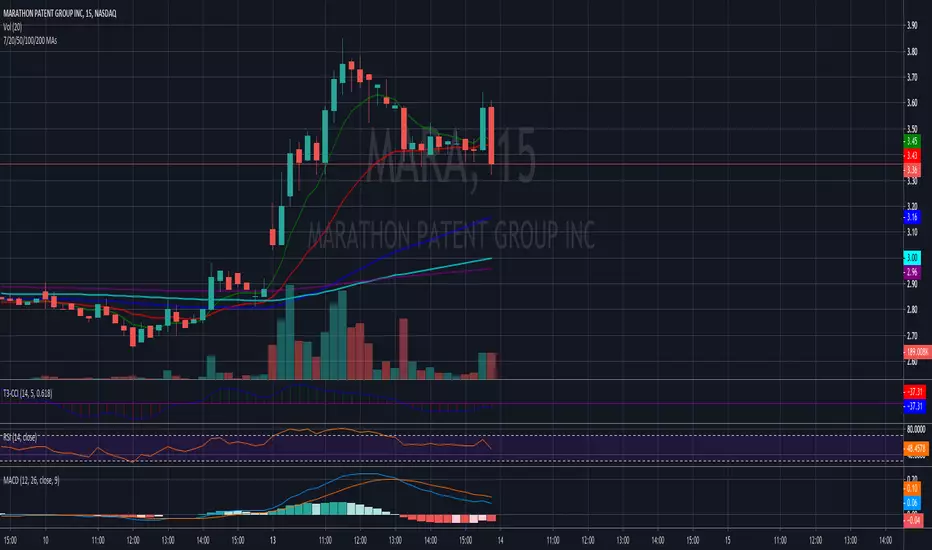
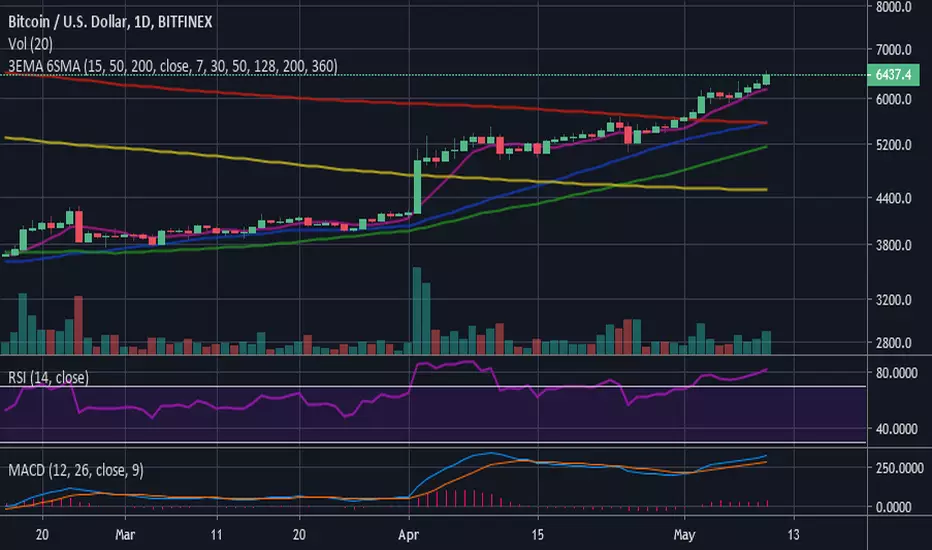
3 EMA (15-50-200) - 6 SMA (7-30-50-128-200-360)3 Moving Average Exponential - 6 Simple Moving Average . Crypto EMA - MA . 7 is a fast support or resistance, 15 confirmation support or resistance. 30 Important support and resistance . 50 institutional support or resistance. 200 institutional general trend, support and resistance , 360 general trend, support and resistance . The use of EMA or MA is according to your liking/trading plan