MrCryptoBos - EMA/SMAThe MrCryptoBos - EMA/SMA indicator contains essential Exponential Moving Averages and Simple Moving Averages that matches with important levels on the timeframes.
Exponentialmovingaverages

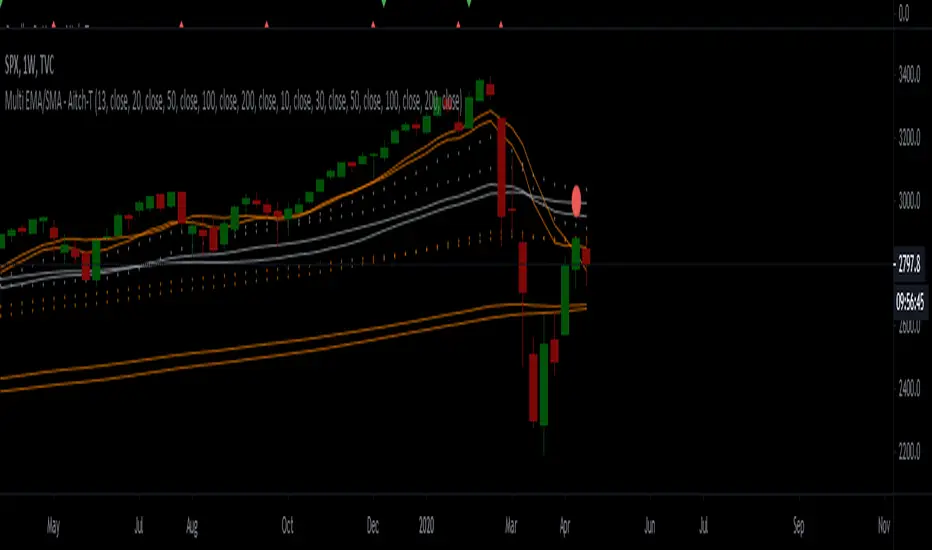
Rhaps SMAEMA Combo v1.1There's many versions of this sort of thing around the Tradingview library, but i guess we all like things to our own specifications.
So this is my take on the SMA and EMA version combined.
Bunch of SMA's & EMA's, with labels, and G&D Cross Labels and Alerts.
These values can of course be changed to any you may prefer.
Rhapsodyy's Combo SMAEMA's v1.1
SMA's with Painted Labels : 10/30/50/80/200
EMA's with Painted Labels : 21/50/89/200/377
50SMA / 200SMA Golden & Death Crosses on Current Timeframe & Alerts
Daily 50SMA / 200SMA Golden & Death Crosses overlayed onto Current Timeframe & Alerts
50EMA / 200EMA Golden & Death Crosses on Current Timeframe & Alerts
Daily 50EMA / 200EMA Golden & Death Crosses overlayed onto Current Timeframe & Alerts

Moving Average(MA) CollectionA simple collection of Simple Moving Averages and Exponential Moving Averages. 4 moving averages enabled by default from a total of 10.
Turn MAs on/off and edit the line style/colour via MA Collection settings.
Default Moving Averages and Default Line Styles
21 EMA (Thin, Purple)
50 SMA (Medium, Yellow)
100 EMA (Medium, Dove Gray)
200 SMA (Thick, Radical Red)
Other Optional Moving Averages and Default Line Styles
5 SMA (Thin, Gray)
8 EMA (Thin, Strkemaster)
13 EMA (Thin, Stiletto)
40 EMA (Medium, Rio Grande)
100 SMA (Medium, Silver)
314 EMA (Thick, Olive)

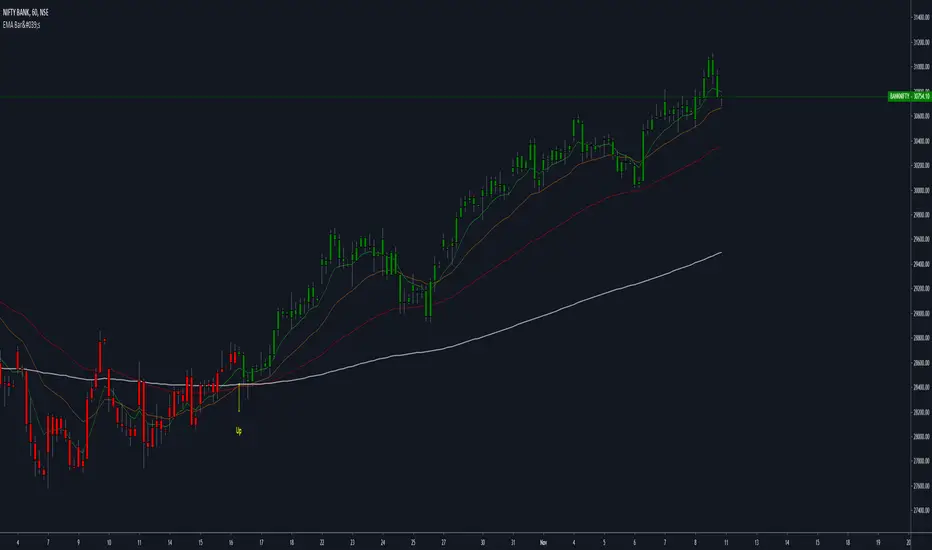
EMA Bar'sPlots the EMA's of 8,21,55 and 200.
when 21EMA crosses Up 55 EMA : Bar's Turn Green
when 21 EMA crosses down 55 EMA : Bar's Turn Red
Arrows are indicated at the crossovers.
Candles are colored to make an easy view of the trend.
[Vold] Multiple Moving AveragesThis script contains 15 highly customizable moving averages, the following options are currently available:
1. Activate Moving Average: Activate or deactivate moving average.
2. Use Resolution: Activate or deactivate resolution configuration.
3. Resolution: The resolution of the moving average (default: 4H).
3. Length: The length of periods of the moving average (default: 9).
4. Source: The source of the moving average (default: price close).
5. Type: The type of the moving average (Simple, Exponential, Weighted, Hull), (default: Simple).
6. Offset: The offset of the moving average (default: 0).

Multi-EMA | 5 EMAs in 1 ScriptAdd up to 5 EMAs to your charts with this script.
Fully Customizable.
----------------------------------------
Wanna try my other scripts?
Histogram with Divergence Finder:
Willams %R with 13 EMA and Divergence Finder:
More scripts here:
www.tradingview.com
EMA High-Low ChannelThe channel is of High and low using EMA, so it is easily to track and see higher high when prices is breaking above channel. same is vice-versa when price is breaking below channel.

8 EMA & 5 SMA ComboA combination of 8 EMA & 5 SMA to use with more advanced MA strategies and de-cluttering of indicator list.
To identify lines, Color combination should be somewhat warmer/lighter to cooler/darker colors.
EMA have a thicker line than the SMA. Color pairs have lighter/darker in cases where there are slight variations (when using one over another).

CBG Rainbow Moving AveragesHere's my Rainbow Moving Average indicator. There are 41 MAs. I also have cross over signals based on 2 separate MAs. I like to use 20 ahd 50 Hull MAs for the signals but you can set those up independently.

ATR/EMA/Pivots/Crossover/LabelsScript for ATR, EMA , Pivots , EMA crossover, and Buy/Sell Labels for EMA Crossover
ATR Channel plotted from open of candle
3 channels with configurable length
+/- .5
+/- 1
+/- 2
EMAx5
Preset to 10, 20, 50, 100, 200. Lengths are configurable
Standard Pivots
Pivot with S1, S2, S3, R1, R2, R3
EMA crossover with Buy/Sell Labels
EMAs lengths are configurable for crossover
(Ability to change colors and turn on/off all of the above. Pic is only showing +/-1 ATR channel, EMAs, Pivot Point with S1/R1, and Crossover with Buy Sell Labels)
Find this useful? Accepting tips. Message me.

ATR/EMA/PivotsScript for ATR, EMA , and Pivots
ATR Channel plotted from open of candle
3 channels with configurable length
+/- .5
+/- 1
+/- 2
EMAx5
Preset to 10, 20, 50, 100, 200. Lengths are configurable
Standard Pivots
Pivot with S1, S2, S3, R1, R2, R3
(Pic is only showing +/-1 ATR channel, EMAs, and Pivot Point with S1/R1)


DT-21 Moving AveragesI know a lot of people use the free version of TradingView, So I made a script to combine 5 Moving averages as 1 indicator.
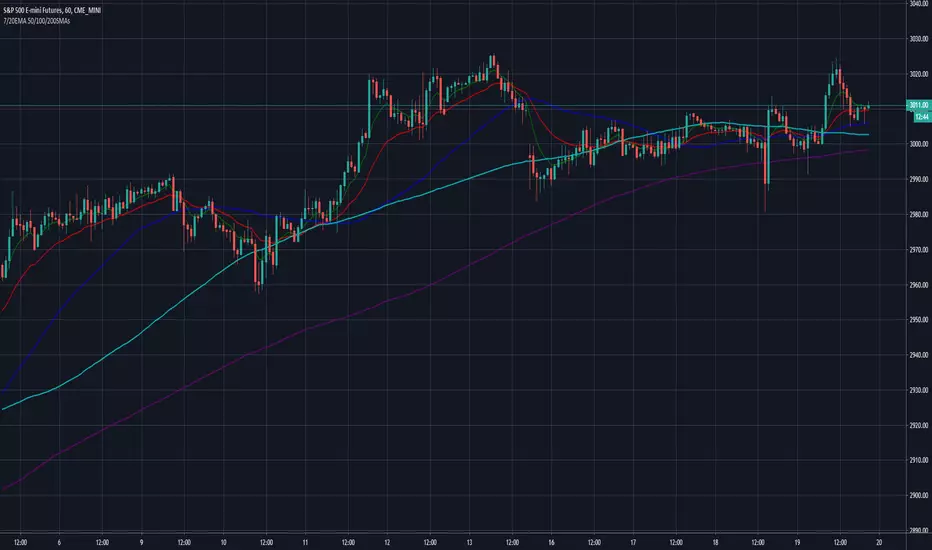
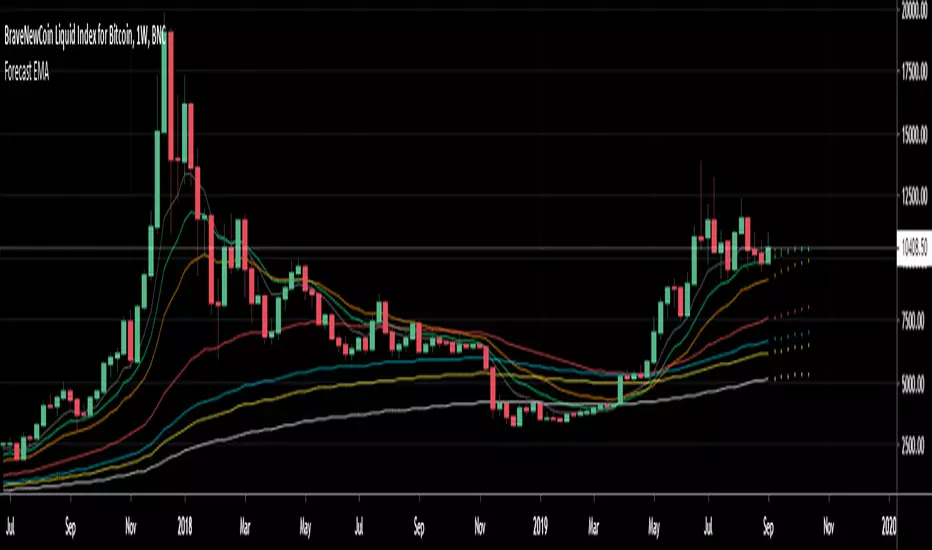
Forecast 7 EMA's 6 periodsForecast 7 EMA's 6 periods
This script is an upgrade of the existing Triple MA Forecast from Yatrader2
To allow the user to display 7 different EMAs and look 6 candles ahead
Default Value
8 ema
13 ema
21 ema
55 ema
100 ema
128 ema
200 ema
Note:
Best to use on high timeframe, if on low timeframe change the forecast maximum to lower
This was made to forecast the 21 ema on weekly timeframe on the upcomming Bitcoin price
EMA 21,13,8 - scalping3 EMAs will help identify and predict uptrends and downtrends
-If EMAs are all above the candles it a sign to sell & if the EMAs are below its a sign to buy
- If the Green-8 EMA crosses or touches red candle then flips under the other EMAs & candles then it's time to sell
-If the Green-8 EMA crosses or touches green candle then flips above the other EMAs & candles then it's time to buy
- how far is the EMAs from the candle it'll show how strong the trend. combine this strategy with the stochastic oscillator & RSI to get the maximum benefit


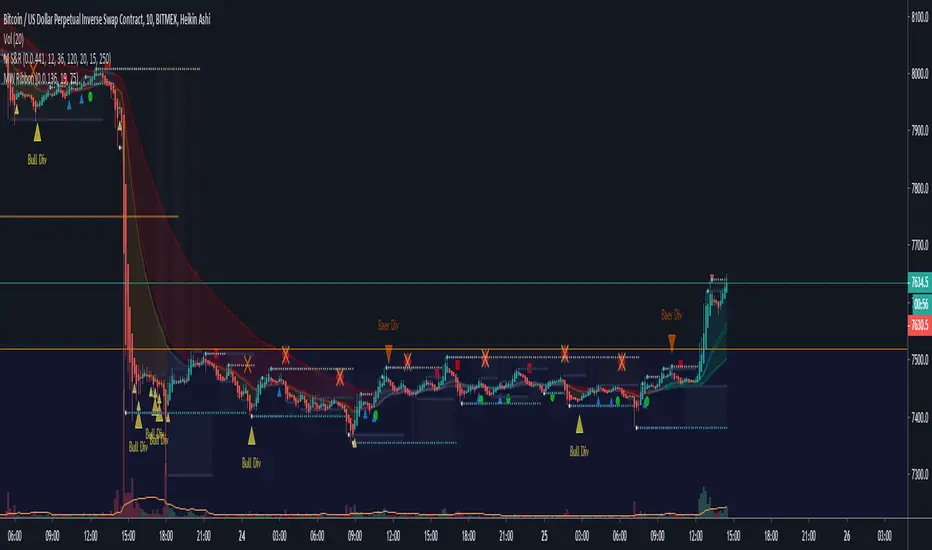
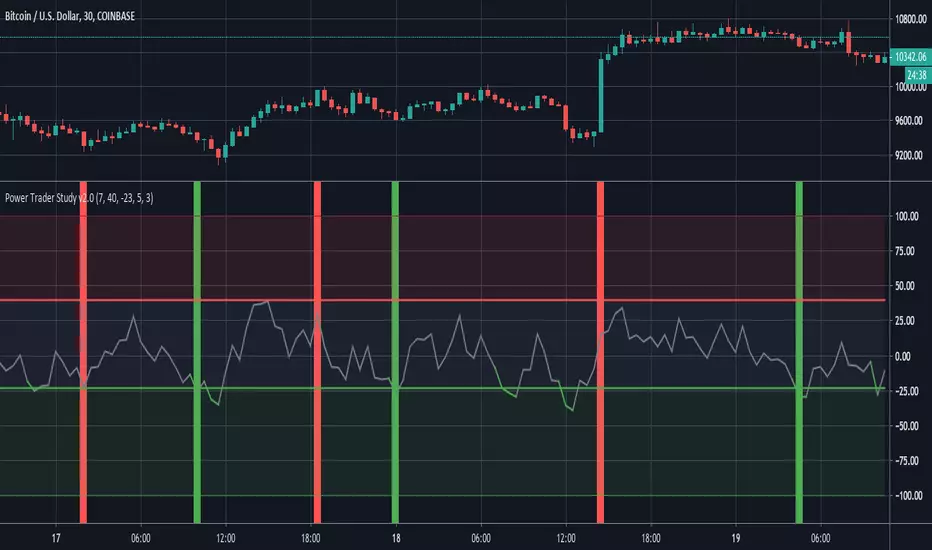
Power Trader Study The Power Trader is an indicator based around the Balance of Power Oscillator. Balance of Power is a price-based measurement that evaluates and compares the strength of buyers and sellers by assessing their respective abilities to push prices to extreme points(both extreme highs and extreme lows).
BoP values fluctuate between a maximum value of 100 and a minimum value of -100. When the BoP value is greater than 0, it indicates that buying pressure is greater than selling pressure. Conversely, negative BoP readings mean that selling pressure is greater than buying pressure.
The exponential moving average of Balance of Power values is displayed as a gray line on the chart. The upper red line represents the upper bound at which a security is considered overbought. The lower green line represents the threshold where we start to consider a security to be in an oversold state.
When the gray BoP EMA line crosses below the lower green line, it changes color to green then changes back to gray once it crosses back above that lower threshold. Similarly, the line turns red when it crosses above the upper red line.
When the EMA line is between the upper and lower bounds, it signifies that there is no significant difference between the power of buyers versus the power of sellers. The top red area indicates that the amount of buying pressure is relatively high. The lower green area means that selling pressure is abnormally high.
When the BoP line falls between the red and green areas, do not take action. When the BoP line turns green and is inside the green area, enter a long position. When the BoP line rises above the red line and into the upper red area, exit the long position.
Entry signals are displayed as vertical green lines that extend the length of the chart. Exit signals are represented by the same lines, except in red.
Users can decide the order of signals in the input option menu through the ‘allow repeat signals’ parameter. If this is set to false, the study will generate signals in the logical chronologic order of . If it is set to true, then signals will be generated as they come, regardless of whether the last signal was its inverse. This means that it could generate sequences like this for example .
Additionally, the stop and limit can also be set in the input menu through the ‘stop’ and ‘limit’ options. This input option accepts parameters of type float (ie: numbers that contain decimals).
The 'Upper Bound for BoP Values' and 'Lower Bound for BoP Values' input options gives traders the option to adjust the upper and lower thresholds for buy and sell signals. It is important to note that setting the upper bound higher or the lower bound lower will result in less frequent signals (and vice versa).
When it is time to enter a long position, an alert with the following message is sent “Power Trader - High Sell Pressure, Enter Long”.
When it is time to exit a long position, an alert with the following message is sent “Power Trader - High Buy Pressure, Exit Long”.
The Power Trader, along with all of our other invite-only scripts, can be found on our website:
profitprogrammers.com
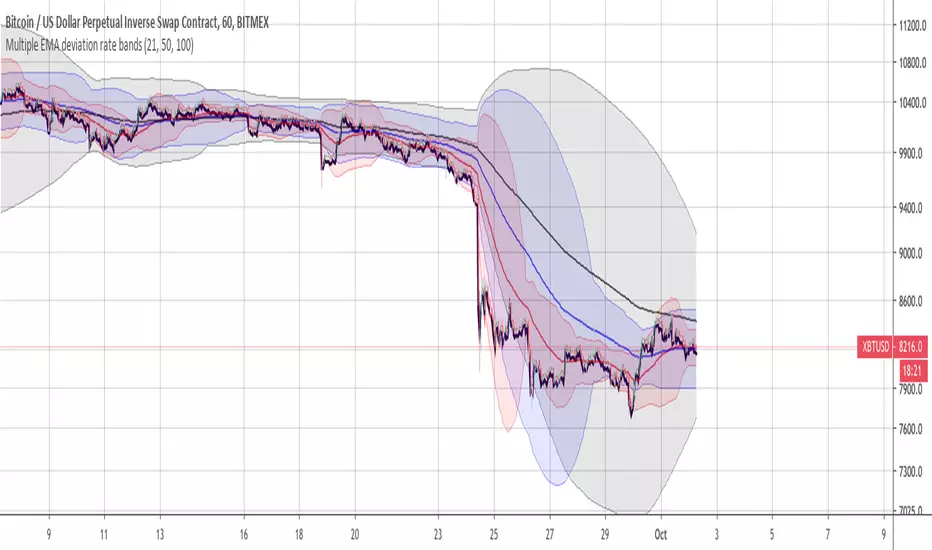
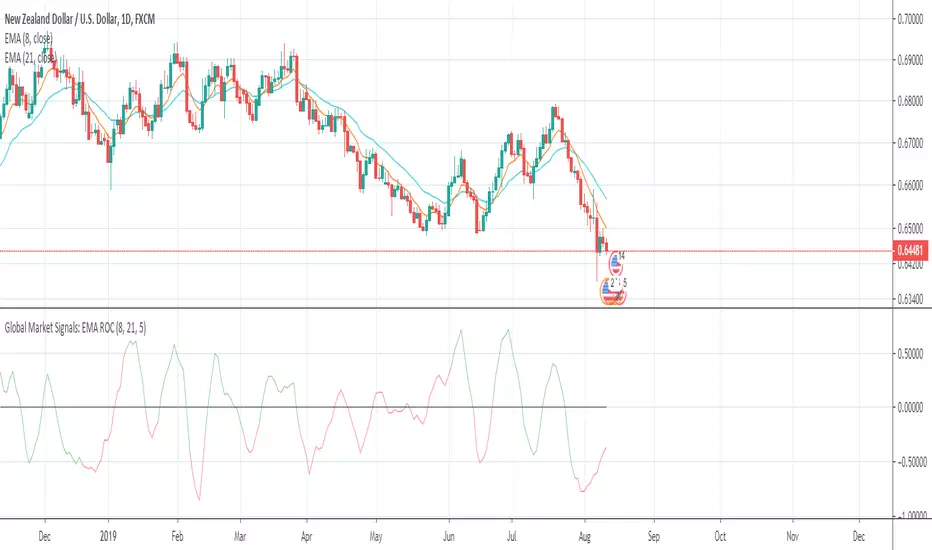
Global Market Signals: EMA ROCWelcome!
Thanks for checking out my indicator.
This is the difference in the rate of change between two exponential moving averages.
The colors are green and red:
- Green is when the fast EMA > slow EMA
- Red is when the fast EMA < slow EMA
When the indicator approaches it's upper or lower limits, it will indicate either sideways price movement or a reversal. When the color changes around it's upper or lower limits from green to red or vice-versa, an EMA crossover just occurred and a continuation of trend is possible before a pause or reversal in price.
I hope this helps!
Andre
Global Market Signals
4 Fibonacci EMAsAdd 4 Fibonacci EMAs to your charts with one indicator.
Configureable by value, so they don't necessarily have to use Fibonacci numbers, and by colors.
