Arjunology for Stocks IndicatorArjunology for Stocks Indicator is a unique trend-following and exit management system that combines the power of Exponential Moving Averages (EMA) and Average True Range (ATR) to capture market trends and manage trade exits dynamically. It is designed to help traders identify potential buy and sell points based on market trends while incorporating volatility adjustments to avoid false signals and provide more reliable trade entries and exits.
Key Features:
1. Exponential Moving Averages (EMAs):
• Two EMAs (Short EMA and Long EMA) are used to determine trend direction and potential crossover signals.
• Short EMA reacts quickly to price changes, giving an indication of shorter-term trends.
• Long EMA provides a more stable measure of the overall trend direction, helping filter out market noise.
• Bullish Crossovers: When the short EMA crosses above the long EMA, it signals a potential uptrend (buy condition).
• Bearish Crossovers: When the short EMA crosses below the long EMA, it signals a potential downtrend (sell condition).
2. Average True Range (ATR):
• ATR is used to assess market volatility and avoid false signals during low volatility periods.
• A trailing stop loss mechanism based on ATR ensures that the indicator adapts to the current market environment, with higher volatility allowing for wider stops and lower volatility leading to tighter stops.
• A flat ATR threshold is used to avoid signals during quiet periods, where price movement may be too insignificant to trade effectively.
3. Buy and Sell Visual Cues:
• Green Triangle at the bottom of the candle when a bullish crossover (buy) condition is met.
• Red Triangle at the top of the candle when a bearish crossover (sell) condition is met.
• These visual cues help traders quickly identify trade entry points based on the trend signals.
4. Dynamic Exit Management:
• The indicator provides an Blue candle background to highlight exit points, with an “EXIT” label at the bottom of the candle in blue. This visual exit signal ensures clarity when a trade should be exited based on the trend reversal.
Justification for Combining EMAs and ATR in This Script:
The Exponential Moving Averages (EMAs) and Average True Range (ATR) serve complementary purposes in this script, enhancing each other’s functionality to provide a more complete trading system:
1. Trend Identification with EMAs:
• The combination of short and long EMAs is a widely trusted method for determining the trend direction. The crossovers between these EMAs provide clear entry signals for buy or sell trades. However, relying solely on EMAs can lead to false signals during periods of low volatility or market consolidation.
2. ATR for Volatility and Stop Loss:
• To prevent false signals during low-volatility conditions, the script uses ATR as a filter. This ensures that trades are only taken when the market has enough momentum, reducing the risk of being caught in “choppy” conditions where price action may be flat and untradeable.
• Additionally, the ATR-based trailing stop provides dynamic trade management, adjusting stop-loss levels according to the current volatility. This makes the system adaptive and prevents tight stops in volatile conditions or unnecessarily wide stops in calm markets.
3. Why They Work Together:
• The EMAs handle the trend direction, which is the foundation of the trading system, while the ATR adjusts the trade management to account for changing volatility. This means that the trader is always entering trades that are likely to follow a strong trend, while avoiding stagnant markets and using volatility-adaptive exit points.
• Without ATR, EMAs might generate signals during low-volatility periods that are unreliable. On the other hand, ATR alone wouldn’t provide a clear direction for trend-following. Together, these indicators create a balanced approach where trades are not only timely but also carefully managed.
How to Use:
• Buy Entry: Enter when the green triangle appears, indicating a bullish EMA crossover.
• Sell Entry: Enter short when the red triangle appears, indicating a bearish EMA crossover.
• Exit: Follow the orange background and blue “EXIT” label as a visual cue to exit the trade.
The combination of these tools allows traders to identify meaningful trend reversals while also managing risk dynamically, making the Arjunology for Stocks Indicator both versatile and effective for various market conditions.
Üstel Hareketli Ortalama (EMA)
EMA CheatsheetEMA Clouds Indicator: A Comprehensive Guide for Traders
The Exponential Moving Average (EMA) Clouds indicator is a dynamic tool designed to provide traders with visual cues about the current trend and potential shifts in market momentum. The EMA is a type of moving average that gives more weight to recent price data, making it highly responsive to price changes compared to a Simple Moving Average (SMA). When used in the form of clouds, EMAs are layered on top of each other to form a visual representation of bullish and bearish trends.
Understanding EMA Clouds
EMA Clouds consist of two or more EMAs, typically a short-term EMA (e.g., 9-period) and a longer-term EMA (e.g., 21-period). When these two EMAs are plotted together, they create a "cloud" between them. The interaction between these EMAs gives traders critical insights into the market's trend:
Bullish Clouds: When the shorter-term EMA crosses above the longer-term EMA, the market is considered to be in a bullish trend. This creates a green (or lighter colored) cloud between the EMAs, signaling upward momentum. Bullish clouds suggest that buyers are in control, and the price is likely to continue higher.
Bearish Clouds: Conversely, when the shorter-term EMA crosses below the longer-term EMA, the market is considered to be in a bearish trend. This forms a red (or darker colored) cloud between the EMAs, indicating downward momentum. Bearish clouds imply that sellers are dominating the market, and the price is likely to decline.
Key Components of the EMA Clouds Indicator:
Short-Term EMA: This is the fast-moving average (e.g., 9-period EMA) and reacts quickly to recent price changes. It’s used to detect short-term shifts in momentum.
Long-Term EMA: This is the slower-moving average (e.g., 21-period EMA), which smooths out price data over a longer period and identifies the general trend direction.
Cloud: The area between the short-term and long-term EMAs. When this cloud is green (bullish), it indicates that the short-term trend is stronger than the long-term trend. When the cloud turns red (bearish), it suggests that the short-term trend is weaker than the long-term trend.
Cloud Thickness: The thickness of the cloud provides additional information about the strength of the trend. A thicker cloud suggests strong price divergence between short and long-term trends, which could indicate a robust trend. A thinner cloud, on the other hand, may signal trend weakness or consolidation.

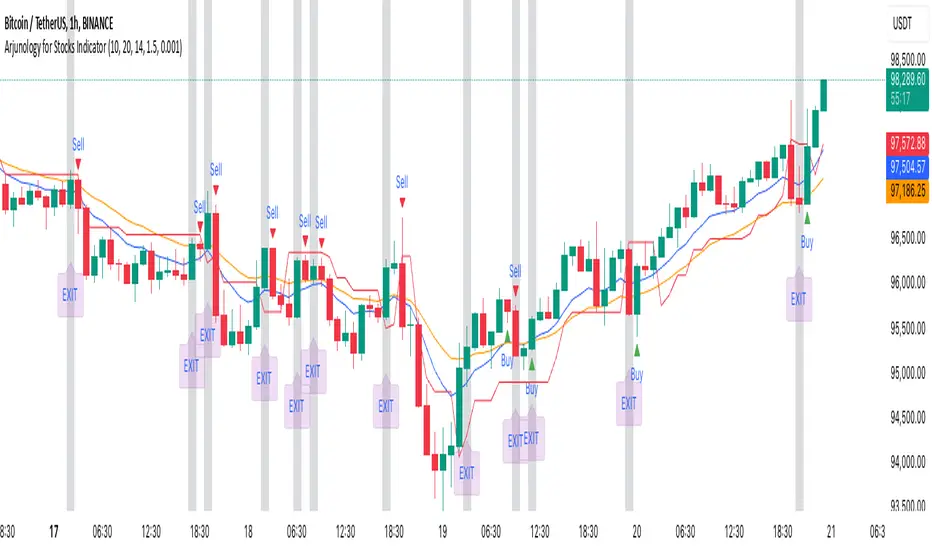
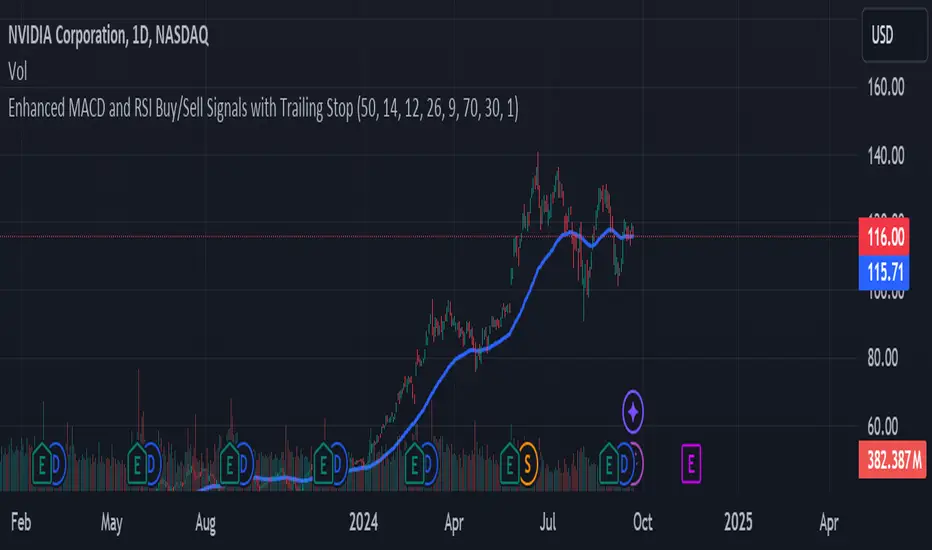
Enhanced MACD and RSI Buy/Sell Signals - Created by Marco NucupKey Features:
EMA Filter: Adds an Exponential Moving Average (EMA) to filter signals based on the trend. Buys are only considered when the price is above the EMA, and sells when below it.
Customizable Inputs: Users can adjust parameters for EMA, MACD, and RSI directly from the TradingView interface, allowing for more personalized strategies.
Alerts: The script includes alert conditions for both buy and sell signals, enabling users to receive notifications.
Signal Plotting: Visual indicators for buy and sell signals on the chart, along with the EMA line for trend reference.
TechniTrend: Average VolatilityTechniTrend: Average Volatility
Description:
The "Average Volatility" indicator provides a comprehensive measure of market volatility by offering three different types of volatility calculations: High to Low, Body, and Shadows. The indicator allows users to apply various types of moving averages (SMA, EMA, SMMA, WMA, and VWMA) on these volatility measures, enabling a more flexible approach to trend analysis and volatility tracking.
Key Features:
Customizable Volatility Types:
High to Low: Measures the range between the highest and lowest prices in the selected period.
Body: Measures the absolute difference between the opening and closing prices of each candle (just the body of the candle).
Shadows: Measures the difference between the wicks (shadows) of the candle.
Flexible Moving Averages:
Choose from five different types of moving averages to apply on the calculated volatility:
SMA (Simple Moving Average)
EMA (Exponential Moving Average)
SMMA (RMA) (Smoothed Moving Average)
WMA (Weighted Moving Average)
VWMA (Volume-Weighted Moving Average)
Custom Length:
Users can customize the period length for the moving averages through the Length input.
Visualization:
Three separate plots are displayed, each representing the average volatility of a different type:
Blue: High to Low volatility.
Green: Candle body volatility.
Red: Candle shadows volatility.
-------------------------------------------
This indicator offers a versatile and highly customizable tool for analyzing volatility across different components of price movement, and it can be adapted to different trading styles or market conditions.

Options Series - MTF 1 and 3 Minute
Objective:
The indicator is named "Options Series - MTF 1 and 3 Minute", suggesting it's designed to analyze options series with multiple time frames (MTF), particularly focusing on 1-minute and 3-minute intervals.
OHLC Values Of Candle:
The code fetches the Open, High, Low, and Close (OHLC) values of the current candle for the specified ticker and timeframes (current, 1 minute, and 3 minutes). Additionally, it calculates the 200-period Simple Moving Average (SMA) of the closing prices for each timeframe.
Bull vs. Bear Condition:
It defines conditions for Bullish and Bearish scenarios based on comparing the current close price with the previous 200-period SMA close price for both 1-minute and 3-minute timeframes. If the current close price is higher than the previous 200-period SMA close price, it's considered Bullish, and if it's lower, it's considered Bearish.
Final Color Condition and Plot:
It determines the color of the candlestick based on the Bullish or Bearish condition. If the conditions for a Bullish scenario are met, the candlestick color is set to green (GreenColorCandle). If the conditions for a Bearish scenario are met, the candlestick color is set to red (RedColorCandle). If neither condition is met (i.e., the candle is neither Bullish nor Bearish), the color remains gray.
The code then plots the 200-period SMA values for both 1-minute and 3-minute timeframes and colors them based on the candlestick color. It also colors the bars based on the candlestick color.
Insights:
This indicator focuses on comparing current close prices with the 200-period SMA close prices to determine market sentiment (Bullish or Bearish).
It utilizes multiple time frames (1 minute and 3 minutes) to provide a broader perspective on market movements.
The color-coded candlesticks and bars make it visually easy to identify Bullish and Bearish trends.
This indicator can be used as part trading based on the identified market sentiment.

Dynamic ConfluenceThe Dynamic MA Confluence Indicator is a powerful tool designed to simplify your trading experience by automatically identifying the most influential moving average (MA) lengths on your chart. Whether you're using Simple Moving Averages (SMA) or Exponential Moving Averages (EMA), this indicator helps you pinpoint the MA length that holds the greatest confluence, allowing you to make informed trading decisions with ease.
How It Works:
This indicator analyzes a wide range of moving averages, from short-term to long-term, to determine which ones are closest to each other. By setting a "Proximity Percentage," you can control how close these MAs need to be to be considered as having confluence. The indicator then calculates the average of these close MAs to establish a dynamic support or resistance level on your chart.
Why Use This Indicator?
Automatic Optimization: Unsure of which MA length to apply? The indicator automatically highlights the MA length with the most confluence, giving you a clear edge in identifying significant market levels.
Adaptability: Choose between SMA and EMA to suit your trading strategy and market conditions.
Enhanced Decision-Making: By focusing on the MA length with the greatest influence, you can better anticipate market movements and adjust your strategies accordingly.
Customizable Sensitivity: Adjust the Proximity Percentage to fine-tune the indicator's sensitivity, ensuring it aligns with your trading preferences.
Key Feature:
Current Key Confluence MA Length: Displayed in an optional table, this feature shows the MA length that currently has the most impact on the confluence level, providing you with actionable insights at a glance.
Whether you're a seasoned trader or just starting, the Dynamic MA Confluence Indicator offers a streamlined approach to understanding market dynamics, helping you trade smarter and with more confidence. This presentation text is designed to clearly communicate the purpose, functionality, and benefits of the indicator, making it easy for users to understand its value and how it can enhance their trading strategies.
The Dynamic MA Confluence Indicator is a tool designed to assist traders in analyzing market trends. It should not be considered as financial advice or a guarantee of future performance. Trading involves significant risk, and it is possible to lose more than your initial investment. Users should conduct their own research and consider their financial situation before making trading decisions. Always consult with a financial advisor if you are unsure about any trading strategies or decisions. This disclaimer is intended to remind users of the inherent risks in trading and the importance of conducting their own due diligence.

LRS-Strategy: 200-EMA Buffer & Long/Short Signals LRS-Strategy: 200-EMA Buffer & Long/Short Signals
This indicator is designed to help traders implement the Leveraged Return Strategy (LRS) using the 200-day Exponential Moving Average (EMA) as a key trend-following signal. The indicator offers clear long and short signals by analyzing the price movements relative to the 200-day EMA, enhanced by customizable buffer zones for increased precision.
Key Features:
200-Day EMA: The main trend indicator. When the price is above the 200-day EMA, the market is considered in an uptrend, and when it is below, it indicates a downtrend.
Customizable Buffer Zones: Users can define a percentage buffer around the 200-day EMA (default is 3%). The upper and lower buffer zones help filter out noise and prevent premature signals.
Precise Long/Short Signals:
Long Signal: Triggered when the price moves from below the lower buffer zone, crosses the 200-day EMA, and then breaks above the upper buffer zone.
Short Signal: Triggered when the price moves from above the upper buffer zone, crosses the 200-day EMA, and then breaks below the lower buffer zone.
Alternating Signals: Ensures that a new signal (long or short) is only generated after the opposite signal has been triggered, preventing multiple signals of the same type without a reversal.
Clear Visual Aids: The indicator displays the 200-day EMA and buffer zones on the chart, along with buy (long) and sell (short) signals. This makes it easy to track trends and time entries/exits.
How to Use:
Long Entry: Look for the price to move below the lower buffer, cross the 200-day EMA from below, and then break out of the upper buffer to confirm a long signal.
Short Entry: Look for the price to move above the upper buffer, cross below the 200-day EMA, and then break below the lower buffer to confirm a short signal.
This indicator is perfect for traders who prefer a structured, trend-following approach, using clear rules to minimize noise and identify meaningful long or short opportunities.

Ewma | viResearchEwma | viResearch
Conceptual Foundation and Innovation
The "Ewma" indicator from viResearch combines the benefits of the Exponentially Weighted Moving Average (EWMA) with the Weighted Moving Average (WMA) to offer traders a more responsive and precise method for trend-following. The EWMA applies greater weight to recent price data, allowing the indicator to adapt quickly to market changes while filtering out short-term fluctuations. By incorporating both EWMA and WMA, this script provides a smoother and more accurate representation of market trends, making it ideal for identifying potential trend shifts and improving trade timing.
This dual-layer smoothing process enables traders to follow market trends with greater accuracy and sensitivity, allowing them to respond quickly to price movements while minimizing the impact of market noise.
Technical Composition and Calculation
The "Ewma" script uses a combination of WMA and EWMA to smooth out price data. First, a WMA is applied to the selected source price over a user-defined length. This WMA is then used as the input for calculating the EWMA, further smoothing the trend and reducing lag. The EWMA is calculated over the same user-defined length, ensuring consistency between the two smoothing processes. This layered approach helps generate more reliable signals for trend changes, as it reduces the influence of short-term price volatility while maintaining responsiveness to significant price movements.
The script monitors whether the current EWMA value is higher or lower than the previous value, generating a trend signal based on this comparison. If the EWMA is higher than the previous bar, it signals a potential upward trend, while a lower EWMA indicates a possible downward trend.
Features and User Inputs
The "Ewma" script offers several customizable inputs, allowing traders to fine-tune the indicator to suit their trading strategies. The Length input controls the period over which both the WMA and EWMA are calculated, affecting how responsive or smooth the indicator is. Additionally, the script includes built-in alert conditions, notifying traders when a trend shift occurs, either to the upside or downside.
Practical Applications
The "Ewma" indicator is designed for traders who want to capture market trends more accurately while reducing the noise from short-term price fluctuations. The dual smoothing of the EWMA helps traders identify potential trend reversals with greater clarity, allowing for earlier and more informed trade entries and exits. By smoothing price data while maintaining responsiveness, the "Ewma" indicator enhances traditional trend-following methods, making it easier to stay aligned with longer-term market trends. The adjustable length setting allows traders to adapt the indicator to various market conditions, whether they prefer faster signals for short-term trading or slower, smoother signals for long-term trend analysis.
Advantages and Strategic Value
The "Ewma" script offers a significant advantage by combining the WMA with the EWMA, delivering a smoother and more responsive trend indicator. This combination helps traders reduce the impact of short-term volatility while maintaining the ability to react quickly to significant price changes. By offering an adaptable and reliable method for trend-following, the "Ewma" indicator helps traders optimize their market positioning and improve the accuracy of their trading strategies.
Alerts and Visual Cues
The script includes alert conditions that notify traders when a significant trend change occurs. The "Ewma Long" alert is triggered when the EWMA crosses above its previous value, indicating a potential upward trend. The "Ewma Short" alert signals a possible downward trend when the EWMA crosses below its previous value. Visual cues, such as changes in the EWMA line color, provide traders with clear and actionable information in real time.
Summary and Usage Tips
The "Ewma | viResearch" indicator provides traders with a powerful tool for trend analysis by combining the benefits of WMA and EWMA smoothing. By incorporating this script into your trading strategy, you can improve your ability to detect trend shifts, confirm trend direction, and reduce noise from short-term price fluctuations. Whether you’re focused on short-term market moves or long-term trends, the "Ewma" indicator offers a reliable and customizable solution for traders at all levels.
Note: Backtests are based on past results and are not indicative of future performance.

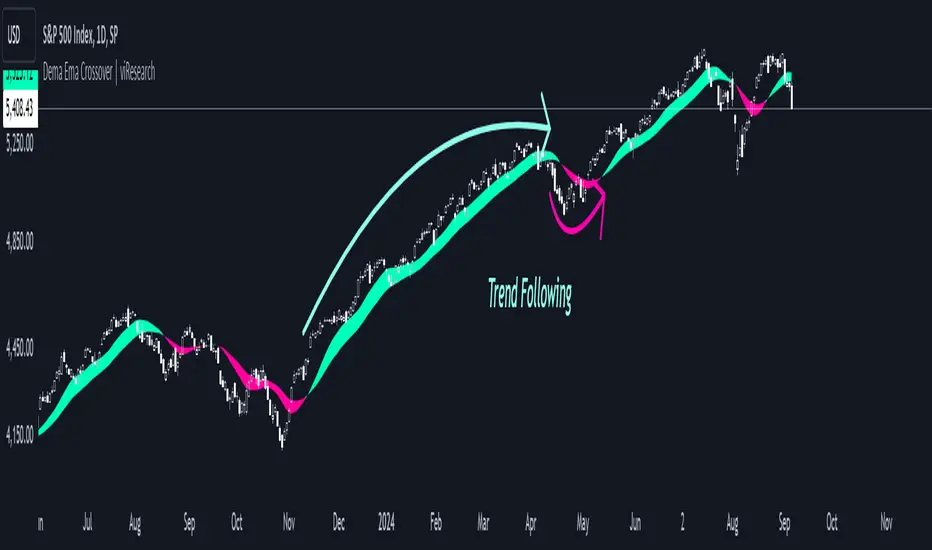
Dema Ema Crossover | viResearchDema Ema Crossover | viResearch
Conceptual Foundation and Innovation
The "Dema Ema Crossover" indicator combines the strengths of the Double Exponential Moving Average (DEMA) with an Exponential Moving Average (EMA) crossover strategy. The DEMA is well-known for its ability to reduce lag compared to standard moving averages, offering smoother trend-following signals. In this script, the DEMA is used as the foundation, with two EMAs applied on top of it to further refine the trend detection and crossover points. This combination provides traders with a robust tool for identifying trend shifts and potential entry or exit points.
By leveraging the faster responsiveness of the DEMA and using EMA crossovers, the "Dema Ema Crossover" indicator helps traders detect and act on trend reversals more efficiently, making it a powerful solution for capturing both short- and long-term market movements.
Technical Composition and Calculation
The "Dema Ema Crossover" script consists of three main components: the Double Exponential Moving Average (DEMA), the fast EMA, and the slow EMA. The DEMA is calculated based on the selected length and source price, providing a smooth representation of market trends. Two EMAs are then applied to the DEMA, with one being faster (shorter period) and the other slower (longer period). The crossover between these two EMAs generates the signals for trend changes.
For the DEMA, the calculation uses the ta.dema function, which reduces lag while maintaining smoothness in the moving average. The fast and slow EMAs are calculated using the ta.ema function, with the fast EMA responding more quickly to price changes, while the slow EMA captures broader trends. The crossover between these two EMAs is used to generate buy and sell signals based on the direction of the crossover.
Features and User Inputs
The "Dema Ema Crossover" script offers several customizable inputs that allow traders to tailor the indicator to their trading strategies. The DEMA Length controls how smooth the DEMA is, with a longer length creating a slower-moving average and a shorter length providing a more responsive one. The Fast EMA Length and Slow EMA Length are also customizable, allowing traders to adjust the sensitivity of the crossover signals based on their market outlook and preferred trading timeframe.
Practical Applications
The "Dema Ema Crossover" indicator is designed for traders looking for a reliable crossover strategy that combines the responsiveness of the DEMA with the precision of EMA crossovers. This tool is particularly effective for:
Identifying Trend Reversals: The crossover between the fast and slow EMAs applied to the DEMA provides early signals of potential trend reversals, allowing traders to position themselves in the market more effectively. Confirming Trend Direction: The combined effect of the DEMA and EMA crossovers helps confirm the strength of a trend, improving decision-making around trade entries and exits. Adapting to Different Market Conditions: The customizable parameters allow traders to adjust the sensitivity of the crossover signals, making the indicator suitable for both fast-moving markets and slower, trending environments.
Advantages and Strategic Value
The "Dema Ema Crossover" script offers a significant advantage by combining the smoothness of the DEMA with the accuracy of EMA crossovers. The DEMA’s ability to reduce lag while maintaining responsiveness makes it ideal for trend-following strategies, while the crossover between the fast and slow EMAs provides precise entry and exit points. This combination reduces false signals and helps traders adapt to changing market conditions, resulting in a more reliable and efficient trend-following system.
Alerts and Visual Cues
The script includes alert conditions to notify traders of key crossover events. The "Dema Ema Crossover Long" alert is triggered when the fast EMA crosses above the slow EMA, signaling a potential upward trend. Conversely, the "Dema Ema Crossover Short" alert signals a possible downward trend when the fast EMA crosses below the slow EMA. Visual cues such as colored fills between the two EMAs highlight these crossover points on the chart, helping traders quickly identify trend shifts.
Summary and Usage Tips
The "Dema Ema Crossover | viResearch" indicator provides traders with a powerful combination of the DEMA and EMA crossovers, offering a smooth yet responsive tool for detecting trend reversals and confirming trend direction. By incorporating this script into your trading strategy, you can improve your ability to capture trend changes with greater accuracy, reducing the impact of market noise. Whether you are focused on short-term market moves or long-term trends, the "Dema Ema Crossover" indicator offers a flexible and reliable solution for traders at all levels.
Note: Backtests are based on past results and are not indicative of future performance.
Austin's Range Filter with Trade SignalsAustin’s Range Filter with Trade Signals
Description:
Austin’s Range Filter with Trade Signals is a versatile indicator that combines a custom range filter with dynamic buy and sell signals based on EMA crossovers. This indicator is designed to help traders easily identify trend reversals and optimal trade entry/exit points.
Key Features:
• Range Filter Calculation: The indicator calculates the highest and lowest price over a user-defined period, then multiplies the difference by a customizable multiplier to establish a dynamic range. A combined middle band (average of the upper and lower bounds) is plotted for a clearer visual representation of the price trend.
• Exponential Moving Average (EMA): A user-configurable EMA is added, which acts as the primary signal line. You can adjust the length of the EMA to suit your trading style.
• Buy and Sell Signals:
• Buy Signal: Triggered when the price crosses above the EMA, indicating a potential upward trend.
• Sell Signal: Triggered when the price crosses below the EMA, indicating a potential downward trend.
• Alerts: Custom alert conditions for buy and sell signals allow you to set up real-time notifications when the signal changes, so you never miss an opportunity.
• Customizable Display: You can toggle the visibility of the combined band (purple) and the EMA (blue) for a cleaner chart.
How It Works:
• Buy when the price crosses above the EMA.
• Sell when the price crosses below the EMA.
• Background colors indicate whether the current price is above or below the calculated range, helping you visually identify bullish and bearish conditions.
Customization Options:
• Range Filter Length: The lookback period for the highest/lowest price calculation.
• Range Multiplier: Adjusts the size of the range.
• EMA Length: Set the length of the EMA to fine-tune the signal sensitivity.
• Toggle Lines: Show or hide the combined band and EMA for more flexibility.
This indicator is suitable for a variety of markets including stocks, forex, and crypto, and can be applied to any timeframe. Use it as part of your technical analysis to spot market trends and improve your decision-making process.
How to Use:
1. Apply the indicator to your chart and adjust the settings to suit your strategy.
2. Set up alerts for buy and sell signals to receive real-time notifications.
3. Monitor the price relative to the range and EMA to better time your trades.
This indicator is perfect for traders looking for an intuitive yet powerful tool to enhance their trading strategies with automatic signals and alerts.

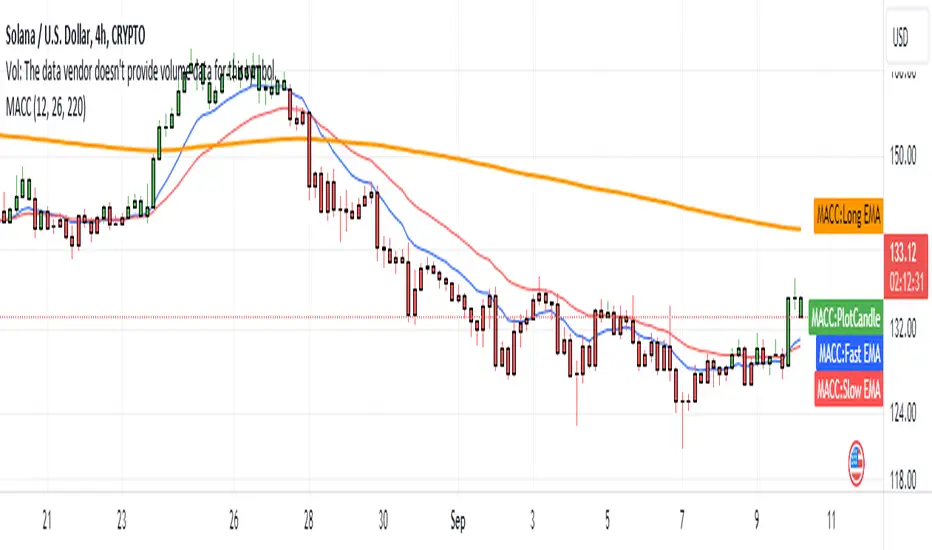
[MACC] Moving Average Candle ColorThe simplest trading framework is using moving average. This indicator is harnessing that very method.
What It Does:
This indicator helps you see market trends at a glance by changing the color of the candlesticks based on the relationship between two Exponential Moving Averages (EMAs). When the 9-period EMA is above the 21-period EMA, candlesticks turn green, suggesting a bullish trend. When the 9 EMA is below the 21 EMA, candlesticks turn red, indicating a bearish trend.
Why You'll Love It:
Easy Trend Visualization: Quickly spot trends and potential reversals with color-coded candlesticks.
Customizable Settings: Adjust the lengths of the EMAs to fit your trading style. Just change the values in the settings panel and watch the indicator update in real-time.
Optional EMA Lines: See the EMA lines plotted on your chart for added context and trend confirmation.
How to Use It:
Green Candlesticks: It’s a sign that the trend is likely upward.
Red Candlesticks: signaling a potential downward trend.
Customization:
EMA Lengths: You can set the lengths for the 9 EMA and 21 EMA to whatever fits your trading strategy best.
Colors: Adjust the colors if you want to match your chart’s theme.
Get Started: Add this indicator to your TradingView chart and tweak the settings to see how it helps you track market trends more effectively.
Cherio...
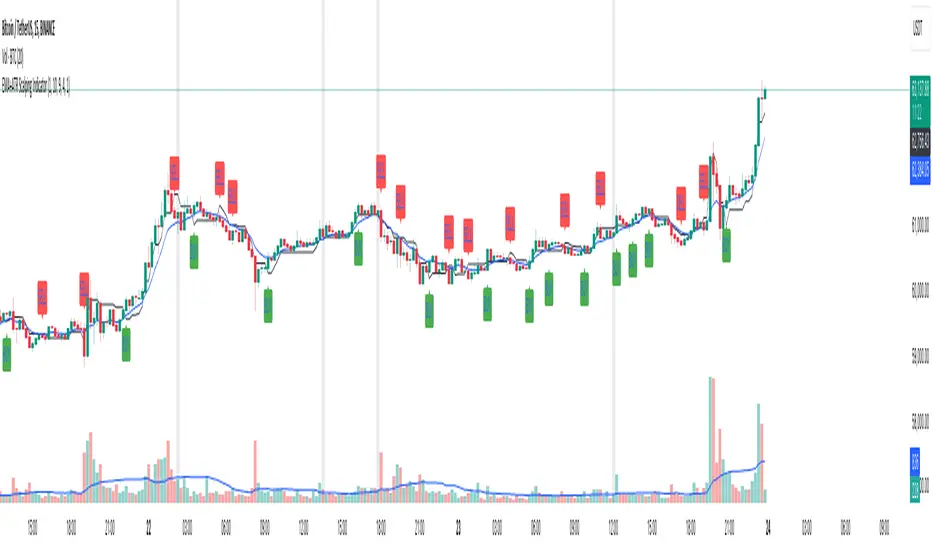
Uptrick: Volume-Weighted EMA Signal### **Uptrick: Volume-Weighted EMA Signal (UVES) Indicator - Comprehensive Description**
#### **Overview**
The **Uptrick: Volume-Weighted EMA Signal (UVES)** is an advanced, multifaceted trading indicator meticulously designed to provide traders with a holistic view of market trends by integrating Exponential Moving Averages (EMA) with volume analysis. This indicator not only identifies the direction of market trends through dynamic EMAs but also evaluates the underlying strength of these trends using real-time volume data. UVES is a versatile tool suitable for various trading styles and markets, offering a high degree of customization to meet the specific needs of individual traders.
#### **Purpose**
The UVES indicator aims to enhance traditional trend-following strategies by incorporating a critical yet often overlooked component: volume. Volume is a powerful indicator of market strength, providing insights into the conviction behind price movements. By merging EMA-based trend signals with detailed volume analysis, UVES offers a more nuanced and reliable approach to identifying trading opportunities. This dual-layer analysis allows traders to differentiate between strong trends supported by significant volume and weaker trends that may be prone to reversals.
#### **Key Features and Functions**
1. **Dynamic Exponential Moving Average (EMA):**
- The core of the UVES indicator is its dynamic EMA, calculated over a customizable period. The EMA is a widely used technical indicator that smooths price data to identify the underlying trend. In UVES, the EMA is dynamically colored—green when the current EMA value is above the previous value, indicating an uptrend, and red when below, signaling a downtrend. This visual cue helps traders quickly assess the trend direction without manually calculating or interpreting raw data.
2. **Comprehensive Moving Average Customization:**
- While the EMA is the default moving average in UVES, traders can select from various other moving average types, including Simple Moving Average (SMA), Smoothed Moving Average (SMMA), Weighted Moving Average (WMA), and Volume-Weighted Moving Average (VWMA). Each type offers unique characteristics:
- **SMA:** Provides a simple average of prices over a specified period, suitable for identifying long-term trends.
- **EMA:** Gives more weight to recent prices, making it more responsive to recent market movements.
- **SMMA (RMA):** A slower-moving average that reduces noise, ideal for capturing smoother trends.
- **WMA:** Weighs prices based on their order in the dataset, making recent prices more influential.
- **VWMA:** Integrates volume data, emphasizing price movements that occur with higher volume, making it particularly useful in volume-sensitive markets.
3. **Signal Line for Trend Confirmation:**
- UVES includes an optional signal line, which applies a secondary moving average to the primary EMA. This signal line can be used to smooth out the EMA and confirm trend changes. The signal line’s color changes based on its slope—green for an upward slope and red for a downward slope—providing a clear visual confirmation of trend direction. Traders can adjust the length and type of this signal line, allowing them to tailor the indicator’s responsiveness to their trading strategy.
4. **Buy and Sell Signal Generation:**
- UVES generates explicit buy and sell signals based on the interaction between the EMA and the signal line. A **buy signal** is triggered when the EMA transitions from a red (downtrend) to a green (uptrend), indicating a potential entry point. Conversely, a **sell signal** is triggered when the EMA shifts from green to red, suggesting an exit or shorting opportunity. These signals are displayed directly on the chart as upward or downward arrows, making them easily identifiable even during fast market conditions.
5. **Volume Analysis with Real-Time Buy/Sell Volume Table:**
- One of the standout features of UVES is its integration of volume analysis, which calculates and displays the volume attributed to buying and selling activities. This analysis includes:
- **Buy Volume:** The portion of the total volume associated with price increases (close higher than open).
- **Sell Volume:** The portion of the total volume associated with price decreases (close lower than open).
- **Buy/Sell Ratio:** A ratio of buy volume to sell volume, providing a quick snapshot of market sentiment.
- These metrics are presented in a real-time table positioned in the top-right corner of the chart, with customizable colors and formatting. The table updates with each new bar, offering continuous feedback on the strength and direction of the market trend based on volume data.
6. **Customizable Settings and User Control:**
- **EMA Length and Source:** Traders can specify the lookback period for the EMA, adjusting its sensitivity to price changes. The source for EMA calculations can also be customized, with options such as close, open, high, low, or other custom price series.
- **Signal Line Customization:** The signal line’s length, type, and width can be adjusted to suit different trading strategies, allowing traders to optimize the balance between trend detection and noise reduction.
- **Offset Adjustment:** The offset feature allows users to shift the EMA and signal line forward or backward on the chart. This can help align the indicator with specific price action or adjust for latency in decision-making processes.
- **Volume Table Positioning and Formatting:** The position, size, and color scheme of the volume table are fully customizable, enabling traders to integrate the table seamlessly into their chart setup without cluttering the visual workspace.
7. **Versatility Across Markets and Trading Styles:**
- UVES is designed to be effective across a wide range of financial markets, including Forex, stocks, cryptocurrencies, commodities, and indices. Its adaptability to different markets is supported by its comprehensive customization options and the inclusion of volume analysis, which is particularly valuable in markets where volume plays a crucial role in price movement.
#### **How Different Traders Can Benefit from UVES**
1. **Trend Followers:**
- Trend-following traders will find UVES particularly beneficial for identifying and riding trends. The dynamic EMA and signal line provide clear visual cues for trend direction, while the volume analysis helps confirm the strength of these trends. This combination allows trend followers to stay in profitable trades longer and exit when the trend shows signs of weakening.
2. **Volume-Based Traders:**
- Traders who focus on volume as a key indicator of market strength can leverage the UVES volume table to gain insights into the buying and selling pressure behind price movements. By monitoring the buy/sell ratio, these traders can identify periods of strong conviction (high buy volume) or potential reversals (high sell volume) with greater accuracy.
3. **Scalpers and Day Traders:**
- For traders operating on shorter time frames, UVES provides quick and reliable signals that are essential for making rapid trading decisions. The ability to customize the EMA length and type allows scalpers to fine-tune the indicator for responsiveness, while the volume analysis offers an additional layer of confirmation to avoid false signals.
4. **Swing Traders:**
- Swing traders, who typically hold positions for several days to weeks, can use UVES to identify medium-term trends and potential entry and exit points. The indicator’s ability to filter out market noise through the signal line and volume analysis makes it ideal for capturing significant price movements without being misled by short-term volatility.
5. **Position Traders and Long-Term Investors:**
- Even long-term investors can benefit from UVES by using it to identify major trend reversals or confirm the strength of long-term trends. The flexibility to adjust the EMA and signal line to longer periods ensures that the indicator remains relevant for detecting shifts in market sentiment over extended time frames.
#### **Optimal Settings for Different Markets**
- **Forex Markets:**
- **EMA Length:** 9 to 14 periods.
- **Signal Line:** Use VWMA or WMA for the signal line to incorporate volume data, which is crucial in the highly liquid Forex markets.
- **Best Use:** Short-term trend following, with an emphasis on identifying rapid changes in market sentiment.
- **Stock Markets:**
- **EMA Length:** 20 to 50 periods.
- **Signal Line:** SMA or EMA with a slightly longer length (e.g., 50 periods) to capture broader market trends.
- **Best Use:** Medium to long-term trend identification, with volume analysis confirming the strength of institutional buying or selling.
- **Cryptocurrency Markets:**
- **EMA Length:** 9 to 12 periods, due to the high volatility in crypto markets.
- **Signal Line:** SMMA or EMA for smoothing out extreme price fluctuations.
- **Best Use:** Identifying entry and exit points in volatile markets, with the volume table providing insights into market manipulation or sudden shifts in trader sentiment.
- **Commodity Markets:**
- **EMA Length:** 14 to 21 periods.
- **Signal Line:** WMA or VWMA, considering the impact of trading volume on commodity prices.
- **Best Use:** Capturing medium-term price movements and confirming trend strength with volume data.
#### **Customization for Advanced Users**
- **Advanced Offset Usage:** Traders can experiment with different offset values to see how shifting the EMA and signal line impacts the timing of buy/sell signals. This can be particularly useful in markets with known latency or for strategies that require a delayed confirmation of trend changes.
- **Volume Table Integration:** The position, size, and colors of the volume table can be adjusted to fit seamlessly into any trading setup. For example, a trader might choose to position the table in the bottom-right corner and use a smaller size to keep the focus on price action while still having access to volume data.
- **Signal Filtering:** By combining the signal line with the primary EMA, traders can filter out false signals during periods of low volatility or when the market is range-bound. Adjusting the length of the signal line allows for greater control over the sensitivity of the trend detection.
#### **Conclusion**
The **Uptrick: Volume-Weighted EMA Signal (UVES)** is a powerful and adaptable indicator designed for traders who demand more from their technical analysis tools. By integrating dynamic EMA trend signals with real-time volume analysis, UVES offers a comprehensive view of market conditions, making it an invaluable resource for identifying trends, confirming signals, and understanding market sentiment. Whether you are a day trader, swing trader, or long-term investor, UVES provides the versatility, precision, and customization needed to make more informed and profitable trading decisions. With its ability to adapt to various markets and trading styles, UVES is not just an indicator but a complete trend analysis solution.

EMA+ATR Scalping Indicator by TradeTechIndicator Description: “EMA+ATR Scalping Indicator by Tradetech”
The “EMA+ATR Scalping Indicator” is a powerful tool designed to help traders identify optimal entry and exit points in the market, focusing on high-probability scalping opportunities. This indicator combines the strength of the Exponential Moving Average (EMA) with the Average True Range (ATR) to generate precise signals, aiming to maximize profits while minimizing risk.
Key Features:
• Sensitivity Key Value: Allows customization of the ATR multiplier, fine-tuning the trailing stop level for different market conditions.
• ATR Calculation: Measures market volatility over a specified period, dynamically adjusting the trailing stop to capture significant price moves while reducing noise.
• EMA for Confirmation: The 20-period EMA is used as a trend filter, ensuring that trades are aligned with the prevailing market direction.
• Trade Cooldown Period: Prevents over-trading by enforcing a minimum number of bars between consecutive trades, reducing the likelihood of whipsaws.
• Flat ATR Threshold: Identifies periods of low volatility (flat ATR), during which trading is avoided to protect against false signals.
Trading Logic:
• Entry Signals: The indicator generates long signals when the price crosses above the ATR trailing stop or breaks out consecutively in an uptrend, with the EMA confirming the bullish trend. Short signals are generated when the price crosses below the ATR trailing stop or consecutively breaks out in a downtrend, with the EMA confirming the bearish trend.
• Exit Signals: The exit points are defined by the ATR trailing stop, which adjusts dynamically with market conditions, ensuring that profits are locked in as the trend evolves.
• No Trading Zone: When the ATR is flat, indicating low volatility, the indicator displays a “No Trading Zone” to prevent taking positions in uncertain market conditions.
Why Combine EMA + ATR?
The combination of EMA and ATR in this indicator is crucial for several reasons:
1. Trend Identification (EMA): The EMA acts as a reliable trend filter, ensuring that trades are taken in the direction of the prevailing trend. By doing so, the indicator avoids taking trades against the momentum, which could result in lower probability setups.
2. Volatility-Based Trailing Stop (ATR): The ATR provides a volatility-adjusted stop-loss level, which is essential in scalping strategies where market conditions can change rapidly. This allows the trailing stop to widen during periods of high volatility and tighten during low volatility, optimizing the trade management process.
3. Enhanced Accuracy: By combining the EMA and ATR, the indicator filters out noise and avoids entering trades during flat market conditions, where the probability of false signals is higher. This synergy between trend and volatility creates a more robust and accurate scalping tool.
4. Dynamic Trade Management: The use of ATR for setting trailing stops ensures that the trade exits are dynamic and adaptable to current market conditions, maximizing the potential for capturing significant moves while minimizing drawdowns.
Overall, the EMA + ATR combination within the “EMA+ATR Scalping Indicator” provides a well-rounded approach to scalping, balancing trend-following with volatility management for more consistent trading results.
Super RSI: Multi-Timeframe, Multi-RSI-MA, Multi Symbol [DucTri]█ Overview
RSI is a very popular indicator that almost every trader knows about. I created this indicator with the goal of helping you use RSI more conveniently and effectively.
█ Uses
Monitor the RSI of 10 currency pairs simultaneously.
The first column shows the RSI of the current currency pair.
RSI below 30 will have a Red background, and above 70 will have a Green background.
Display multiple RSI lines with different lengths (or timeframes).
Displays 3 RSI with 3 different lengths 7, 14 and 21
Displays two RSI lines with two different timeframes. The purple line shows RSI (14) for the 1H timeframe, and the blue line shows RSI (14) for the 4H timeframe.
Display MA and Bollinger Band lines for RSI.
Shows the RSI line along with two MA lines of the RSI: EMA (9) in blue and WMA (45) in red.
Identify RSI Divergence with custom settings
█ Input
- You can have up to three RSI lines, with customizable lengths and timeframes.
- You also have up to three RSI-MA lines, where you can customize the MA type and length.
- You can track RSI for up to 10 currency pairs at the same time.
- Additionally, you can change how the top (or bottom) is determined when identifying divergence.
█ Alerts
Send alerts when two RSI lines cross. For example, when the RSI 14 crosses above the RSI 21, or the RSI on the 1H timeframe crosses above the RSI on the 4H timeframe.*
Send alerts when RSI crosses above or below the RSI-MA line.
Send alerts when two RSI-MA lines cross. For example, when the RSI-EMA (9) crosses above the RSI-WMA (45).*
Send alerts when Divergence (Convergence) appears.
Send alerts when any currency pair in the monitored list shows an Overbought or Oversold signal.

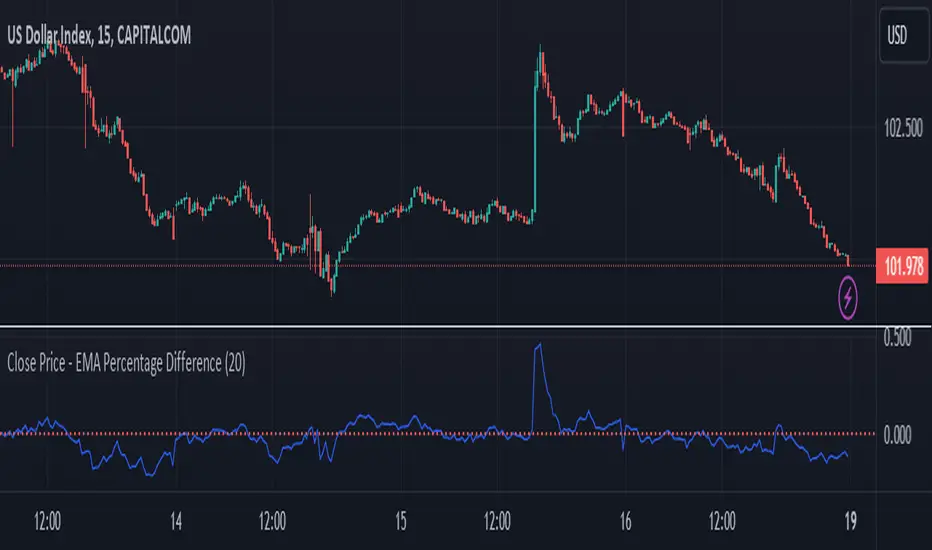
Close Price - EMA Percentage Difference
Title: Close Price - EMA Percentage Difference Indicator
Description:
The Close Price - EMA Percentage Difference Indicator is an essential tool designed to calculate and display the percentage difference between the closing price of a security and its Exponential Moving Average (EMA). This indicator is particularly useful for traders and analysts who want to understand how far the current price is from its EMA, providing insights into potential price trends and reversals.
Key Features:
Customizable EMA Period: Easily adjust the EMA period to match your trading strategy. Whether you're focusing on short-term trends with a 20-period EMA or analyzing long-term trends with a 200-period EMA, this indicator is flexible to suit your needs.
Percentage Difference Calculation: The indicator computes the percentage difference between the closing price and the selected EMA, allowing you to see how much the current price deviates from its moving average in percentage terms. This calculation helps in identifying potential buying or selling opportunities based on price movements relative to the EMA.
Zero Line Reference: A dotted red line at the zero level is included for quick visual reference. This line helps you instantly identify when the closing price is equal to the EMA, and whether the price is above or below the EMA.
Visual Representation: The percentage difference is plotted on a separate panel below the price chart, providing a clear and intuitive visualization that aids in decision-making.
How to Use:
Adjust the EMA period to fit your analysis or trading strategy.
Observe the percentage difference to understand the strength of the current price in relation to the EMA.
Use the zero line as a reference point to determine whether the price is above (positive values) or below (negative values) the EMA, which can help in identifying overbought or oversold conditions.
This indicator is suitable for all types of traders, from day traders to long-term investors, offering valuable insights into the price dynamics relative to the EMA.
Custom EMA Multi-Timeframe Indicator [Pineify]
This innovative indicator combines Exponential Moving Averages (EMAs) across multiple timeframes to provide traders with a comprehensive view of market trends and potential trading opportunities. By analyzing short, medium, and long-term EMAs simultaneously, this indicator offers valuable insights into market dynamics and helps identify high-probability entry and exit points.
Key Features
Multi-timeframe analysis using customizable EMAs
Visual representation of trend alignment across different timeframes
Customizable EMA lengths and sources for each timeframe
Buy and sell signals based on EMA crossovers
Alert functionality for real-time trade notifications
How It Works
The Custom EMA Multi-Timeframe Indicator calculates three separate EMAs:
1. Short-term EMA: Represents immediate market sentiment
2. Medium-term EMA: Captures intermediate trend direction
3. Long-term EMA: Reflects the overall market trend
These EMAs are plotted on the chart using different colors for easy identification. The indicator generates buy and sell signals based on the relative positions of these EMAs, providing traders with clear visual cues for potential trade entries and exits.
Trading Ideas and Insights
This indicator offers several powerful trading concepts:
Trend Alignment: When all three EMAs are aligned (short above medium above long), it indicates a strong trend. Traders can look for pullbacks to enter in the direction of the trend.
Trend Reversal: When the short-term EMA crosses above or below both the medium and long-term EMAs, it may signal a potential trend reversal. This can be used to exit existing positions or enter new trades in the opposite direction.
Range-bound Markets: When the EMAs are tightly grouped together, it suggests a consolidation phase. Traders can wait for a breakout or use range-trading strategies.
Momentum Confirmation: The speed at which the short-term EMA diverges from or converges with the longer-term EMAs can indicate the strength of the current move.
Unique Aspects
What sets this indicator apart is its ability to synthesize information from multiple timeframes into a single, easy-to-interpret visual display. Unlike traditional single-timeframe EMAs, this indicator provides a more holistic view of market trends, reducing false signals and improving trade timing.
The customizable nature of the indicator allows traders to adapt it to various trading styles and market conditions. By adjusting the EMA lengths and sources, traders can fine-tune the indicator to their specific needs and preferences.
How to Use
1. Apply the indicator to your chart
2. Customize the timeframes and EMA settings as desired
3. Look for buy signals when the short and medium EMAs cross above the long EMA
4. Look for sell signals when the short and medium EMAs cross below the long EMA
5. Use the relative positions of the EMAs to gauge overall trend strength and direction
6. Combine with other technical analysis tools for confirmation
Customization
The indicator offers extensive customization options:
Short, medium, and long timeframes can be adjusted
EMA lengths for each timeframe are customizable
EMA source (close, open, high, low, etc.) can be selected for each timeframe
Colors and line styles can be modified to suit personal preferences
Alert settings can be configured for automated trade notifications
Conclusion
The Custom EMA Multi-Timeframe Indicator is a powerful tool for traders seeking to gain a comprehensive understanding of market trends across different time horizons. By combining multiple EMAs and timeframes, it provides a unique perspective on market dynamics, helping traders make more informed decisions and potentially improve their trading results.
Whether you're a day trader looking for short-term opportunities or a swing trader focusing on longer-term trends, this indicator offers valuable insights that can enhance your trading strategy. Its flexibility and customization options make it suitable for a wide range of trading styles and market conditions.
Remember: While this indicator can be a valuable tool in your trading arsenal, it should not be used in isolation. Always combine it with other forms

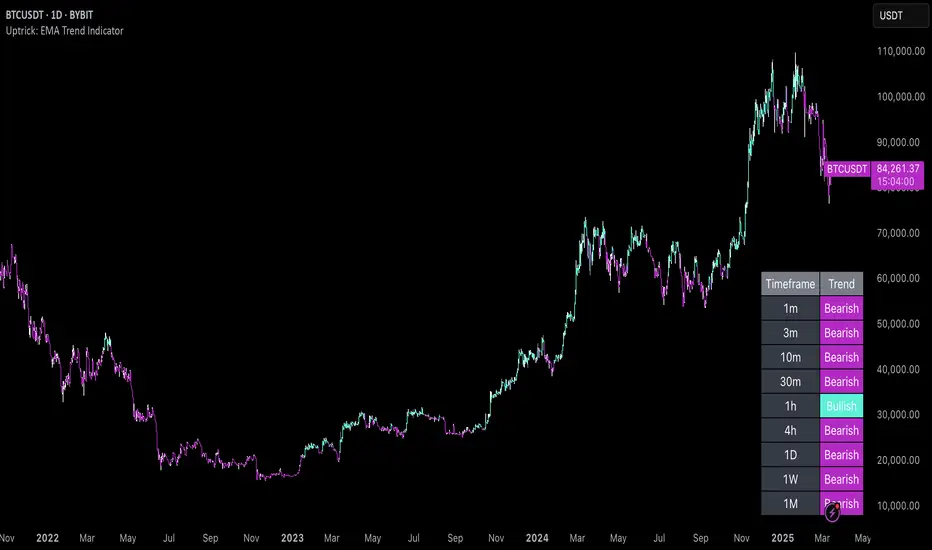
Uptrick: EMA Trend Indicator
### Overview
The goal of this script is to visually indicate on a trading chart whether all three Exponential Moving Averages (EMAs) are trending upwards (i.e., their slopes are positive). If all EMAs are trending upwards, the script will color the bars green. If not, the bars will be colored red.
### Key Concepts
1. **Exponential Moving Average (EMA)**: An EMA is a type of moving average that places more weight on recent data, making it more responsive to price changes compared to a simple moving average (SMA). In this script, we use three different EMAs with different lengths (20, 50, and 200 periods).
2. **Slope of an EMA**: The slope of an EMA refers to the direction in which the EMA is moving. If the current value of the EMA is higher than its value in the previous bar, the slope is positive (upward). Conversely, if the current value is lower than its previous value, the slope is negative (downward).
3. **Bar Color Coding**: The script changes the color of the bars on the chart to provide a visual cue:
- **Green Bars**: Indicate that all three EMAs are trending upwards.
- **Red Bars**: Indicate that one or more EMAs are not trending upwards.
### Detailed Breakdown
#### 1. Input Fields
- **EMA Lengths**: The script starts by allowing the user to input the lengths for the three EMAs. These lengths determine how many periods (e.g., days) are used to calculate each EMA.
- `ema20_length` is set to 20, meaning the first EMA uses the last 20 bars of data.
- `ema50_length` is set to 50, meaning the second EMA uses the last 50 bars of data.
- `ema200_length` is set to 200, meaning the third EMA uses the last 200 bars of data.
#### 2. EMA Calculation
- The script calculates the values of the three EMAs:
- **EMA 20**: This is calculated using the last 20 bars of closing prices.
- **EMA 50**: This is calculated using the last 50 bars of closing prices.
- **EMA 200**: This is calculated using the last 200 bars of closing prices.
These calculations result in three values for each bar on the chart, each representing the EMA value at that point in time.
#### 3. Determining EMA Slopes
- **EMA Slopes**: To understand the trend of each EMA, the script compares the current value of each EMA to its value in the previous bar:
- For the 20-period EMA, the script checks if today’s EMA value is higher than yesterday’s EMA value.
- This process is repeated for the 50-period and 200-period EMAs.
- If today’s EMA value is greater than yesterday’s value, the slope is positive (upward).
- If today’s EMA value is not greater (it is either equal to or less than yesterday’s value), the slope is not positive.
#### 4. Evaluating All Slopes
- **All Slopes Positive Condition**: The script combines the results of the individual slope checks into a single condition. It uses a logical "AND" operation:
- The condition will be `true` only if all three EMAs (20, 50, and 200) have positive slopes.
- If any one of the EMAs does not have a positive slope, the condition will be `false`.
#### 5. Coloring the Bars
- **Bar Coloring Logic**: Based on the above condition, the script decides the color of each bar on the chart:
- If all slopes are positive (condition is `true`), the bar is colored green.
- If any slope is not positive (condition is `false`), the bar is colored red.
- **Visual Cue**: This provides a quick, visual indication to traders:
- Green bars suggest that the market is in an upward trend across all three EMAs, which might indicate a strong bullish trend.
- Red bars suggest that the trend is not uniformly upward, which could be a sign of weakening momentum or a potential reversal.
#### 6. Alerts
- **Alert Conditions**: The script also allows for alert conditions to be set based on the slope analysis:
- An alert can be triggered when all EMA slopes are positive. This might be useful for traders who want to be notified when the market shows strong upward momentum.
### Summary
- The script essentially takes the market data and applies three different EMAs to it, each with a different time frame.
- It then checks the direction (slope) of each of these EMAs to determine if they are all trending upwards.
- If they are, the script colors the bar green, signaling a potentially strong bullish trend.
- If any of the EMAs is not trending upwards, it colors the bar red, indicating a potential issue with the strength of the trend.
This approach helps traders quickly assess market conditions based on multiple EMAs, providing a clearer picture of the overall trend across different time frames.
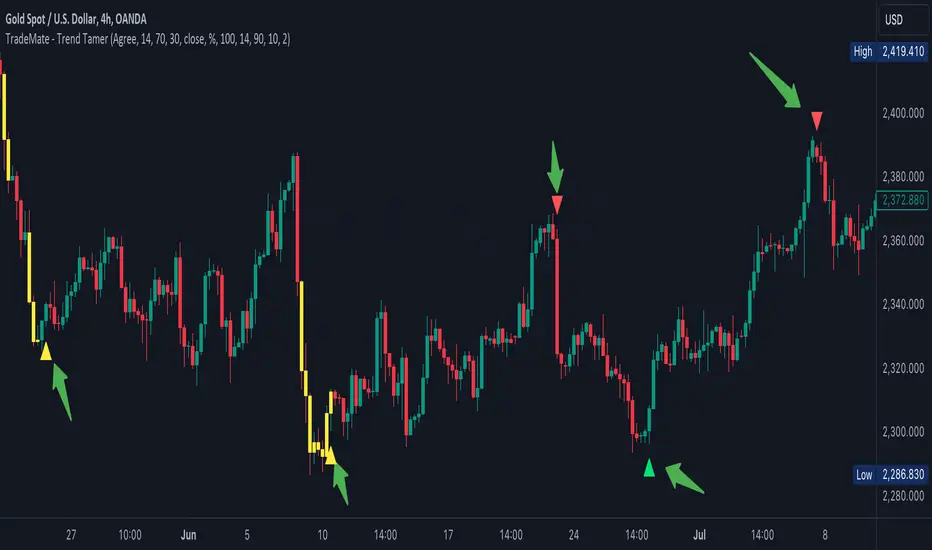
TradeMate - Trend TamerTradeMate Trend Tamer
The TradeMate Trend Tamer is designed to help traders identify potential trend reversals and navigate periods of high market volatility. This tool combines a custom EMA-based oscillator with a volatility detection mechanism, providing traders with actionable signals that are easy to interpret and apply.
🔶 Originality and Utility
The TradeMate Trend Tamer is not just a mashup of indicators but a well-integrated system that enhances the reliability of trend detection. The core of this indicator is a custom EMA calculation that identifies trend shifts based on price momentum and directional changes. This EMA is further enhanced by a volatility detection system that colors bars yellow during periods of high volatility, indicating potential market reversals.
The indicator is particularly useful for traders who are looking for clear and straightforward signals to identify buying and selling opportunities, especially in volatile markets where traditional indicators might produce false signals. By combining trend arrows with volatility signals, the TradeMate Trend Tamer helps traders confirm the strength of a signal and avoid getting caught in market noise.
🔶 Description and Underlying Logic
The TradeMate Trend Tamer uses a custom EMA calculation that smooths price movements to detect significant shifts in momentum. This EMA is plotted on the chart and is complemented by arrows indicating potential buy or sell signals:
Upward Arrows: These appear when the EMA indicates an upward momentum shift, suggesting a potential buying opportunity.
Downward Arrows: These indicate a downward momentum shift, signaling a potential selling opportunity.
The volatility detection mechanism works by analyzing the ATR (Average True Range) over a specified lookback period. The indicator identifies extreme volatility zones where the ATR exceeds a certain threshold, coloring the bars yellow to visually alert traders. This helps traders identify when the market is more likely to reverse, making the combination of trend arrows and volatility signals a powerful tool for decision-making.
🔶 Using the TradeMate Trend Tamer
Traders should use the trend arrows as an initial signal and confirm it with the yellow-colored volatility bars. For example:
High Volatility with Upward Arrow: Indicates a strong buy signal as the market is likely to reverse upwards.
High Volatility with Downward Arrow: Indicates a strong sell signal, suggesting a potential downward reversal.
By following these signals, traders can enhance their entry and exit strategies, especially in markets prone to sudden moves.
Multi-Timeframe EMA Distance & % Change TableDescription of Multi-Timeframe EMA Distance & % Change Table
The Multi-Timeframe EMA Distance & % Change Table indicator is designed to display the distance and percentage change between the current price and the Exponential Moving Averages (EMAs) on multiple timeframes. It creates a table to show these values, with customizable options for decimal precision .
Key Features:
Inputs:
- Timeframes (tf1, tf2, tf3, tf4): User-defined timeframes for EMA calculations (e.g., 1 minute, 15 minutes, daily, etc.).
- EMA Levels (emaLevel, emaLevel2, emaLevel3): User-defined periods for three different EMAs.
EMA Calculations:
- Computes EMAs for the specified levels (50, 100, 200) on each of the user-selected timeframes.
Plotting:
- Plots the EMAs on the chart with distinct colors: Orange, Teal, and Green for different EMAs.
Display Options:
- Checkbox (displayAsPercentage): Allows the user to toggle between displaying distances or percentage changes.
- Decimal Precision:
- decimalPlacesDistance: Specifies the number of decimal places for rounded distance values.
- decimalPlacesPercentage: Specifies the number of decimal places for rounded percentage values.
Table Creation:
- Location: Table is placed in the top-right corner of the chart.
- Headers: Includes columns for each timeframe and EMA distance/percentage.
Distance and Percentage Calculations:
- Distances: Calculated as the difference between the current price and the EMA values for each timeframe.
- Percentages: Calculated as the distance divided by the EMA value, converted to a percentage.
Decimal Rounding:
- Custom Rounding Function: Ensures that distance and percentage values are displayed with the user-specified number of decimal places.
Color Coding:
- Distance Values: Colored green if positive, red if negative.
- Table Entries: Display either the rounded distance or percentage, based on user selection.
Table Update:
- The table is dynamically updated with either distance or percentage values based on the user's choice and rounded to the specified number of decimal places.
This indicator provides a comprehensive overview of EMA distances and percentage changes across multiple timeframes, with detailed control over the precision of the displayed values.

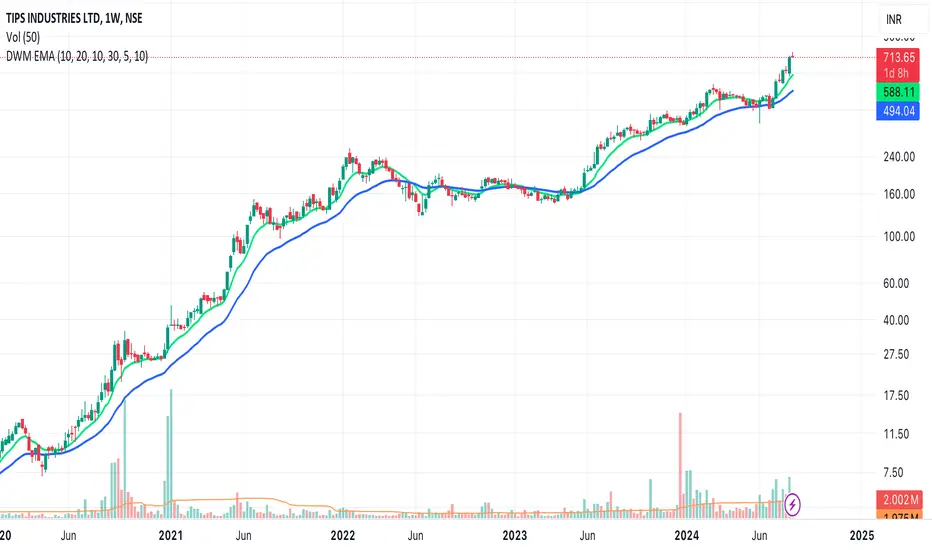
EMAs for D W M TimeframesEMAs for D W M Timeframes
Description:
The “EMAs for D W M Timeframes” indicator allows users to set specific Exponential Moving Averages (EMAs) for Daily, Weekly, and Monthly timeframes. The script utilizes these user-defined EMA settings based on the chart’s current timeframe, ensuring that the appropriate EMAs are always displayed.
Please note that for timeframes other than specified, it defaults to daily EMA values.
EMA : The Exponential Moving Average (EMA) is a type of moving average that places greater weight and significance on the most recent data points. This makes the EMA more responsive to recent price changes compared to a simple moving average (SMA), making it a popular tool for identifying trends in financial markets.
Features:
Daily and Default EMAs: Users can specify two EMAs for the Daily timeframe, which also act as the default EMAs for any unspecified timeframe. The default values are set to 10 and 20.
Weekly EMAs: For Weekly charts, the indicator plots two EMAs with default values of 10 and 30. These EMAs help in tracking medium-term trends.
Monthly EMAs: On Monthly charts, the indicator plots EMAs with default values of 5 and 10, providing insights into long-term trends.
Timeframe-Based Display: The indicator automatically uses the EMA settings corresponding to the current chart’s timeframe, whether it is Daily, Weekly, or Monthly.
If the chart is set to any other timeframe, the Daily EMA settings are used by default.
How to Use:
Inputs:
* Daily and Default EMA 1 & 2: Adjust the values for the short-term and long-term EMAs on the Daily chart, which are also used for any other unspecified timeframe.
* Weekly EMA 1 & 2: Set the values for the EMAs that will be shown on Weekly charts.
* Monthly EMA 1 & 2: Specify the values for the EMAs to be displayed on Monthly charts.
Visualization:
* Depending on the current chart timeframe, the script will automatically display the relevant EMAs.
Default Values:
* Daily and Default EMAs: 10 (EMA 1), 20 (EMA 2)
* Weekly EMAs: 10 (EMA 1), 30 (EMA 2)
* Monthly EMAs: 5 (EMA 1), 10 (EMA 2)
This indicator is designed for users who want to monitor EMAs across different timeframes, using specific settings for Daily, Weekly, and Monthly charts.
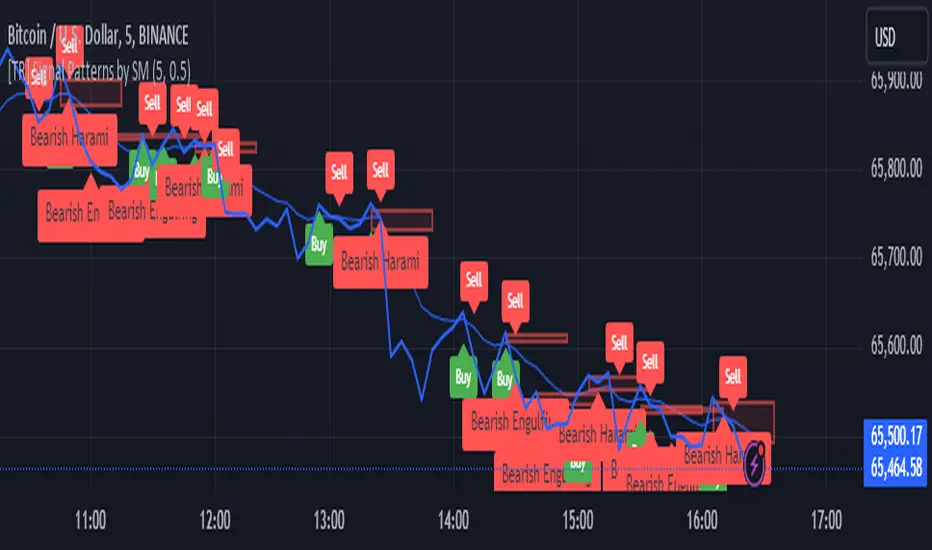
[TR] Engulf Patterns by SM
Engulf Pattern by SM
Overview:
The " Engulf Pattern by SM" script is designed to identify bullish and bearish engulfing candlestick patterns on TradingView charts. Engulfing patterns are significant in technical analysis as they often indicate potential reversals in market trends.
Features:
- Bullish Engulfing Pattern Detection: The script identifies bullish engulfing patterns, which occur when a larger bullish candle completely engulfs the body of the previous smaller bearish candle.
- Bearish Engulfing Pattern Detection: Similarly, it detects bearish engulfing patterns, where a larger bearish candle engulfs the body of the preceding smaller bullish candle.
- Body Size Filtering: The script includes a feature to filter patterns based on the size of the candle bodies, allowing for more precise marking of significant patterns.
- Visual Markers: The script plots visual markers on the chart to highlight the detected engulfing patterns, making it easy for traders to spot them.
How It Works:
1. Bullish Engulfing Pattern:
- The script checks for a smaller bearish candle followed by a larger bullish candle.
- The body of the bullish candle must completely cover the body of the bearish candle.
- The size of the bullish candle's body must meet a specified threshold to be considered significant.
2. Bearish Engulfing Pattern:
- The script looks for a smaller bullish candle followed by a larger bearish candle.
- The body of the bearish candle must completely engulf the body of the bullish candle.
- The size of the bearish candle's body must meet a specified threshold to be considered significant.
Usage:
- Add the Script: Apply the " Engulf Pattern by SM" script to your TradingView chart.
- Configure Settings: Customize the script settings to suit your trading strategy, including visual marker styles and body size thresholds.
- Monitor Visual Markers: Keep an eye on the visual markers to identify potential trading opportunities based on engulfing patterns.
Disclaimer:
This script is not intended to be used as a direct entry signal. It should be used as a confluence in your overall trading plan. Always conduct your own analysis and consider multiple factors before making any trading decisions.
Feel free to customize this writeup further to match your specific needs! If you have any other requests or need additional details, just let me know.
Three Anchored Moving Averages (VWAP / SMA / EMA)
This indicator allows users to anchor three types of moving averages (Simple Moving Average (SMA), Exponential Moving Average (EMA), and Volume Weighted Average Price (VWAP)) to specific points in time (anchor points)
Key Features:
Select from three Moving Average Types:
Simple Moving Average (SMA): Averages the closing prices over a specified period.
Exponential Moving Average (EMA): Gives more weight to recent prices, making it more responsive to new information.
Volume Weighted Average Price (VWAP): Averages the price weighted by volume, useful for understanding the average price at which the asset has traded over a period.
Up to Three Anchor Points:
Users can set up to three different anchor points to calculate the moving averages from specific dates and times. This allows for analysis of price action starting from significant points or specific events. For example, you can anchor to the low and high of a move to identify key levels or to points where the price takes off from a previous anchored MA.
Customisable Sentiment Options:
Each anchor point can be associated with a sentiment input (Auto, Bull, Bear, None), which influences if the MAs are displayed as lines or zones/bands:
Auto: Automatically determines the sentiment based on whether anchor points are on pivot highs and lows. If anchored to a pivot high, the system will assume a bearish sentiment and display a red band or zone between the MA OHLC4 and High. Anchoring to a pivot low will display a green band (OHLC4 - Low).
Bull: Forces a bullish sentiment (Green Band - OHLC4 to Low)
Bear: Forces a bearish sentiment (Red Band - OHLC4 to High)
None: Ignores sentiment and displays a single line (OHLC4)
Chart Matching:
The indicator includes an option to display the moving averages only if the chart symbol matches a specified ticker. This feature ensures that the indicator is relevant to the specific asset being analysed.
How to Use the Indicator:
1. Set Anchor Points: When added to your chart, select three anchor points by point and click. If you only wish to anchor to a single point, click on that point three times and disable the other two in settings once the indicator is applied.
2. Select Moving Average Type: Choose between SMA, EMA, or VWAP using the dropdown menu. EMAs are the most responsive.
3. Enable/Disable Anchor Points: Use the checkboxes to enable or disable each anchor point.
4. Select Sentiment Type: Choose between Auto, Bull, Bear, or None.
5. Chart Matching: Optionally, specify a chart symbol to restrict the indicator's display to that particular asset.
6. Interpret the Plots: The indicator plots the high, mid, and low values of the selected moving average type from each anchor point. The fills between these plots help identify potential support and resistance zones. These should be used as points of interest for pullback reversals or potential continuation if the price breaks through.
Practical Applications:
Trend Analysis: Identify the overall trend direction from specific historical points.
Support and Resistance: Determine key dynamic support and resistance levels based on anchored moving averages.
Event-Based Analysis: Anchor the moving averages to significant events (e.g., earnings releases, economic data) to study their impact on price trends.
Multi Timeframe Analysis: Higher Timeframe Anchors can be used to identify longer term trend analysis. Switching to a lower timeframe for execution triggers at these points wont distort the MA levels as they are anchored to a specific point in time
Intraday or Swing Trading: trend analysis using anchor points can be used for any style of trading (Intraday / Swing / Invest). Use anchored levels as points of interest and wait for hints in price action to try and catch the next move.

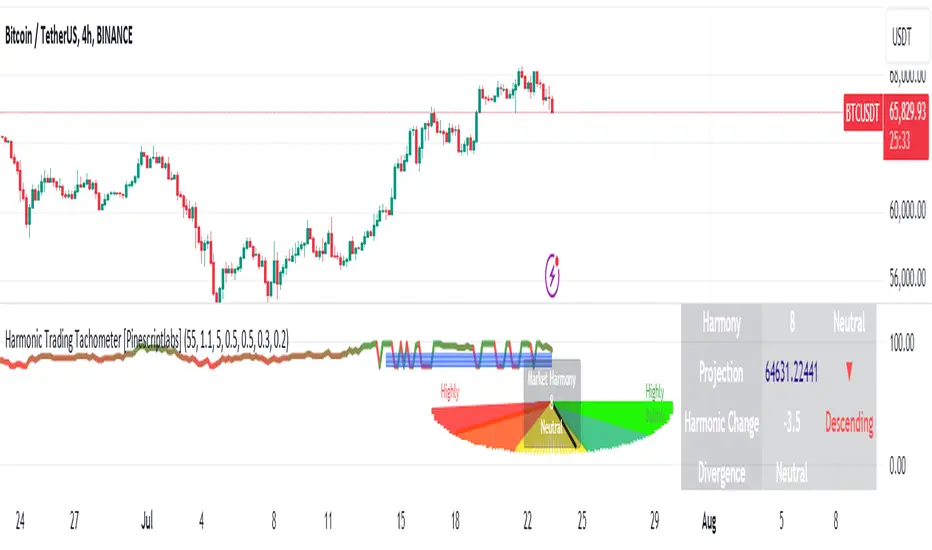
Harmonic Trading Tachometer [Pinescriptlabs]Key Features:
Visual Tachometer:
Represents market harmony through a speedometer on the chart.
The tachometer displays a range of harmony from "Highly Bearish" to "Highly Bullish."
Harmony Calculation:
Harmony Score: Based on ATR (Average True Range) range calculations for short, medium, and long periods. The harmony score is a weighted combination of these scores.
Interpretation: Harmony is translated into an interpretive category that can be "Highly Bearish," "Bearish," "Neutral," "Bullish," or "Highly Bullish."
Price Projection:
Estimates future price movement considering the current trend and the weight of each trend period (short, medium, and long).
Harmonic Change Detection:
Identifies significant changes in market harmony and adjusts sensitivity with predefined thresholds.
Confirmation and Divergence Signals:
Detects bullish or bearish confirmation signals as well as divergences, based on market harmony and price projection.
Additional Visualization:
Includes an optional market pentagram chart to visualize harmony on a broader scale.
Provides detailed information in a table about harmony, price projection, and harmonic changes.
How the Script Works:
Initial Calculations:
Ranges and Scores: Calculates ATR ranges for different periods (short, medium, and long). Then, evaluates the harmony score using the given formula.
Harmony: Obtained through the weighted combination of short, medium, and long-term scores.
Price Projection:
The projection is adjusted based on the difference between the current closing price and the exponential moving averages (EMAs) for different periods, weighted by the defined factors.
How to Use :
Tachometer Interpretation:
Observe the needle's position on the tachometer to assess the current market harmony.
Use the colors and labels to quickly interpret the market's state.
Projection and Changes:
Use the price projection to identify potential support or resistance levels.
Monitor harmonic changes and their strengths to adjust your trading strategies.
Confirmations and Divergences:
Pay attention to confirmation and divergence signals to decide on potential entries or exits.
Customization:
Adjust the indicator parameters, such as base length, harmony factor, change detection period, and trend weights, to fit your trading style and timeframe.
Español:
**Tacómetro Visual:
- Representa la armonía del mercado mediante un velocímetro en el gráfico.
- El tacómetro muestra un rango de armonía desde "Altamente Bajista" hasta "Altamente Alcista."
Cálculo de Armonía:
- Puntuación de Armonía:** Basada en los cálculos del rango ATR (Average True Range) para períodos cortos, medios y largos. La puntuación de armonía es una combinación ponderada de estas puntuaciones.
- Interpretación: La armonía se traduce en una categoría interpretativa que puede ser "Altamente Bajista," "Bajista," "Neutral," "Alcista," o "Altamente Alcista."
**Proyección de Precios:
- Estima el movimiento futuro de los precios considerando la tendencia actual y el peso de cada período de tendencia (corto, medio y largo).
**Detección de Cambios Armonicos:
- Identifica cambios significativos en la armonía del mercado y ajusta la sensibilidad con umbrales predefinidos.
**Señales de Confirmación y Divergencia:
- Detecta señales de confirmación alcista o bajista, así como divergencias, basadas en la armonía del mercado y la proyección de precios.
**Visualización Adicional:**
- Incluye un gráfico opcional de un pentagrama de mercado para visualizar la armonía en una escala más amplia.
- Proporciona información detallada en una tabla sobre la armonía, la proyección de precios y los cambios armónicos.
**Cómo Funciona el Script:**
Cálculos Iniciales:
- **Rangos y Puntuaciones:** Calcula los rangos del ATR para diferentes períodos (corto, medio y largo). Luego, evalúa la puntuación de armonía utilizando la fórmula dada.
- **Armonía:** Se obtiene a través de la combinación ponderada de las puntuaciones de corto, medio y largo plazo.
**Proyección de Precios:**
- La proyección se ajusta según la diferencia entre el precio de cierre actual y las medias móviles exponenciales (EMA) para diferentes períodos, ponderadas por los factores definidos.
**Cómo Usar:**
**Interpretación del Tacómetro:**
- Observa la posición de la aguja en el tacómetro para evaluar la armonía actual del mercado.
- Usa los colores y las etiquetas para interpretar rápidamente el estado del mercado.
**Proyección y Cambios:**
- Usa la proyección de precios para identificar posibles niveles de soporte o resistencia.
- Monitorea los cambios armónicos y sus fortalezas para ajustar tus estrategias de trading.
**Confirmaciones y Divergencias:**
- Presta atención a las señales de confirmación y divergencia para decidir posibles entradas o salidas.
**Personalización:**
- Ajusta los parámetros del indicador, como la longitud base, el factor de armonía, el período de detección de cambios y los pesos de tendencia, para adaptarlo a tu estilo de trading y marco de tiempo.