OB/OS adaptative v1.1# OB/OS Adaptative v1.1 - Multi-Timeframe Adaptive Overbought/Oversold Indicator
## Overview
The `tradingview_indicator_emas.pine` script is a sophisticated multi-timeframe indicator designed to identify dynamic overbought and oversold levels in financial markets. It combines EMA (Exponential Moving Average) crossovers and Bollinger Bands across monthly, weekly, and daily timeframes to create adaptive support and resistance levels that adjust to changing market conditions.
## Core Functionality
### Multi-Timeframe Analysis
The indicator analyzes three timeframes simultaneously:
- **Monthly (M)**: Long-term trend identification
- **Weekly (W)**: Intermediate-term trend identification
- **Daily (D)**: Short-term volatility measurement
### Technical Indicators Used
- **EMA 9 and EMA 20**: For trend identification and momentum assessment
- **Bollinger Bands (20-period)**: For volatility measurement and extreme level identification
- **Price action**: For confirmation of level validity and signal generation
## Key Features
### Adaptive Level Calculation
The indicator dynamically determines overbought and oversold levels based on market structure and trend bias:
#### Monthly Level Logic
- **Bullish Bias** (when monthly open > EMA20):
- Oversold = lower of EMA9 or EMA20
- Overbought = upper of EMA9 or Bollinger Upper Band
- **Bearish/Neutral Bias** (when monthly open ≤ EMA20):
- Oversold = Bollinger Lower Band
- Overbought = upper of EMA20 or EMA9
#### Weekly Level Logic
- **Bullish Bias** (when weekly open > EMA20):
- Oversold = lower of EMA9 or EMA20
- Overbought = Bollinger Upper Band
- **Bearish/Neutral Bias** (when weekly open ≤ EMA20):
- Oversold = Bollinger Lower Band
- Overbought = upper of EMA20 or EMA9
#### Daily Level Logic
- Simple Bollinger Bands:
- Oversold = Bollinger Lower Band
- Overbought = Bollinger Upper Band
### Final Level Determination
The indicator combines all three timeframes through a weighted averaging process:
1. Calculates initial values as the average of monthly, weekly, and daily levels
2. Ensures mathematical consistency by enforcing overbought_final ≥ oversold_final using min/max functions
3. Calculates a midpoint average level as the center of the range
### Visual Elements
- **Dynamic Lines**: Draws horizontal lines for current and previous period overbought, oversold, and average levels
- **Labels**: Places clear textual labels at the start of each period
- **Color Coding**:
- Red for overbought levels (resistance)
- Green for oversold levels (support)
- Blue for average levels (pivot point)
- **Transparency**: Previous period lines use semi-transparent colors to distinguish between current and historical levels
### Update Mechanism
- **Calculation Day**: User-defined day of the week (default: Monday)
- On the specified calculation day, the indicator:
- Updates all levels based on previous bar's data
- Draws new lines extending forward for a user-defined number of days
- Maintains previous period lines for comparison and trend analysis
- Automatically deletes and recreates lines to ensure clean visualization
### Proximity Detection
- Alerts when price approaches overbought/oversold levels (configurable distance in percentage)
- Helps identify potential reversal zones before actual crossovers occur
- Distance thresholds are user-configurable for both overbought and oversold conditions
### Alert Conditions
The indicator provides four distinct alert types:
1. **Cross below oversold**: Triggered when price crosses below the oversold level
2. **Cross above overbought**: Triggered when price crosses above the overbought level
3. **Near oversold**: Triggered when price approaches the oversold level within the configured distance
4. **Near overbought**: Triggered when price approaches the overbought level within the configured distance
### Debug Mode
When enabled, displays comprehensive debug information including:
- Current values for all levels (oversold, overbought, average)
- Timeframe-specific calculations and raw data points
- System status information (current day, calculation day, etc.)
- Lines existence and timing information
- Organized in multiple labels at different price levels to avoid overlap
## Configuration Parameters
| Parameter | Default Value | Description |
|---------|---------------|-------------|
| Short EMA (9) | 9 | Length for short-term EMA calculation |
| Long EMA (20) | 20 | Length for long-term EMA calculation |
| BB Length | 20 | Period for Bollinger Bands calculation |
| Std Dev | 2.0 | Standard deviation multiplier for Bollinger Bands |
| Distance to overbought (%) | 0.5 | Percentage threshold for "near overbought" alerts |
| Distance to oversold (%) | 0.5 | Percentage threshold for "near oversold" alerts |
| Calculation day | Monday | Day of week when levels are recalculated |
| Lookback days | 7 | Number of days to extend previous period lines backward |
| Forward days | 7 | Number of days to extend current period lines forward |
| Show Debug Labels | false | Toggle for comprehensive debug information display |
## Trading Applications
### Primary Use Cases
1. **Reversal Trading**: Identify potential reversal zones when price approaches overbought/oversold levels
2. **Trend Confirmation**: Use the adaptive nature of levels to confirm trend strength and direction
3. **Position Sizing**: Adjust position size based on distance from key levels
4. **Stop Placement**: Use opposite levels as dynamic stop-loss references
### Strategic Advantages
- **Adaptive Nature**: Levels adjust to changing market volatility and trend structure
- **Multi-Timeframe Confirmation**: Signals are validated across multiple timeframes
- **Visual Clarity**: Clear color-coded lines and labels enhance decision-making
- **Proactive Alerts**: "Near" conditions provide early warnings before crossovers
## Implementation Details
### Data Security
Uses `request.security()` function to fetch data from higher timeframes (monthly, weekly) while maintaining proper bar indexing with ` ` offset for open prices.
### Performance Optimization
- Uses `var` keyword to declare persistent variables that maintain state across bars
- Efficient line and label management with proper deletion before recreation
- Conditional execution of debug code to minimize performance impact
### Error Handling
- Comprehensive NA (not available) checks throughout the code
- Graceful degradation when data is unavailable for higher timeframes
- Mathematical safeguards to prevent invalid level calculations
## Conclusion
The OB/OS Adaptative v1.1 indicator represents a sophisticated approach to identifying market extremes by combining multiple technical analysis concepts. Its adaptive nature makes it particularly useful in trending markets where static levels may be less effective. The multi-timeframe approach provides a comprehensive view of market structure, while the visual elements and alert system enhance its practical utility for active traders.
Üstel Hareketli Ortalama (EMA)

Moving Average Exponential (Daily Frozen EMA)This script plots an Exponential Moving Average (EMA) based on the daily timeframe, but with a unique twist:
✅ The EMA value is frozen for the entire current daily session, only updating when a new daily candle begins.
🔍 How it works:
The EMA is calculated using the 1-day timeframe, regardless of the chart's current timeframe.
This EMA value remains fixed throughout the day — it doesn't fluctuate intrabar.
It updates only once the daily candle has closed, providing a stable and reliable reference point during the trading day.
The default is the 5 day EMA but can be changed to any EMA timeframe you desire such as 9, 21, 50, 100. 200, etc.
✨ Additional Features:
✅ Optional smoothing with various moving average types (SMA, EMA, WMA, SMMA, VWMA).
✅ Optional Bollinger Bands on top of the smoothed EMA.
✅ Adjustable settings for EMA length, smoothing type, Bollinger Band deviation, and display options.
🛠️ Use Cases:
Ideal for traders who want a non-reactive EMA during intraday trading.
Helps reduce signal noise by anchoring EMA to higher timeframe structure.
Useful for strategy development where EMA should represent confirmed daily bias only.
Hope this helps, happy trading!

MAD indicator buy and sellThe MAD (Moving Average Divergence) indicator is used in trading to identify potential buy and sell signals based on the divergence between moving averages.
**Buy Signal:**
- A buy signal is generated when the shorter-term moving average crosses above the longer-term moving average. This often indicates a potential upward momentum in the stock price.
**Sell Signal:**
- A sell signal occurs when the shorter-term moving average crosses below the longer-term moving average. This suggests that the stock may be losing momentum and could be headed for a decline.
Traders typically look for confirmation through additional signals or analysis to increase the reliability of these buy and sell points. Always remember to manage risk properly when making trading decisions!

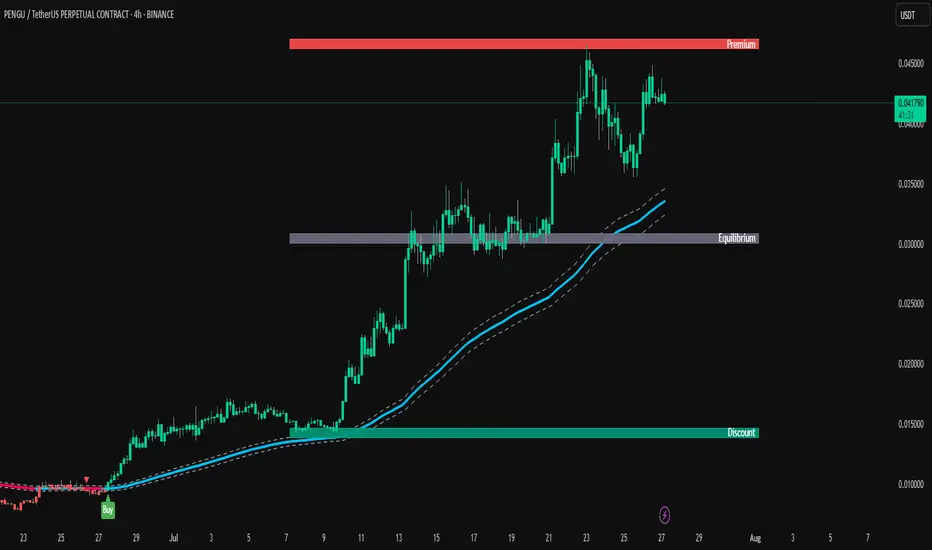
TrendPilot AI v2 — Smart ATR Indicator with ZonesTrendPilot AI v2 is a smart price-action and ATR-based trading system designed for swing and position traders. It combines trend-following logic with adaptive price zones to help users identify high-probability Buy and Sell opportunities — along with intelligent re-entry points, weak signal detection, and visual structure zones.
🔧 Core Features:
✅ ATR-based Buy/Sell signals with confirmation logic
✅ Dynamic 99 EMA Channel for trend context
✅ Re-entry triangles for stacking or retracing setups
✅ 150 EMA Weak Signal Detection for early trend warnings
✅ 🧭 Price Action Zones (Premium, Equilibrium, Discount)
✅ Visual alerts via triangles, labels, and color-coded logic
✅ Designed for 15m, 1H, and 4H charts — also useful on Daily
🧠 How It Works (Logic Breakdown)
1️⃣ Trend Direction — EMA Channel Logic
A 99 EMA Channel determines the dominant market bias.
If price is above the channel → trend is Bullish → Buy signals are valid
If price is below the channel → trend is Bearish → Sell signals are valid
2️⃣ Buy/Sell Signals — ATR Trailing Logic
The system uses custom ATR trailing logic to detect when price momentum shifts.
When a breakout aligns with trend direction, a Buy or Sell label appears.
These are designed to capture the main trend leg or reversal zone.
3️⃣ Re-Entry Signals — Triangle Visual Cues
During a confirmed trend, if price retraces to the EMA channel, a small triangle is shown:
🔼 Green triangle: Buy re-entry during bullish trend
🔽 Red triangle: Sell re-entry during bearish trend
These are not new signals but continuation cues for advanced traders.
4️⃣ Weak Signal Detection — 150 EMA Logic
A secondary 150 EMA helps detect possible trend exhaustion.
If price dips below 150 EMA during a bullish run, an orange triangle appears (⚠️ caution).
If price rises above 150 EMA during a bearish run, a blue triangle appears.
This signals potential weakening of the active trend.
5️⃣ Price Zones — Premium, Equilibrium, Discount
TrendPilot AI v2 draws 3 smart price zones based on ATR & market structure:
🟥 Premium Zone (Top) → Overbought area, caution for long trades
🟨 Equilibrium Zone (Middle) → Fair value, consolidation possible
🟩 Discount Zone (Bottom) → Oversold, better long entries
These zones help filter signals and avoid entries in risky areas.
Example: Avoid Buy signals inside Premium zone.
🧪 Suggested Use:
✅ Timeframes: 15m / 1H / 4H / 1D
✅ Combine signals with zone analysis for optimal entries
✅ Use re-entry triangles to add or confirm during pullbacks
✅ Use weak signal warnings to tighten stops or manage risk
✅ Works best in trending environments or breakout markets
⚠️ Note for Users:
This script is not repainting. All signals are plotted with stable logic.
Past performance does not guarantee future results — always backtest first.
Script does not contain financial advice — use at your own discretion.
MIGA Trader DNAMIGA Trader DNA is a composite indicator that integrates:
Trend Identification: Uses three exponential moving averages (fast, mid, slow) to determine market bias based on their order.
Momentum Filter: An adaptive RSI whose period automatically matches the fastest EMA highlights overbought or oversold conditions.
Entry Timing: A Stochastic %K crossover signals precise entry points when momentum aligns with trend direction.
Volatility Envelope: An optional, SuperTrend band adjusts dynamically to changing ATR-based volatility.
Visual Signals: Discrete “Buy” and “Sell” labels mark entry opportunities directly on the price chart when all conditions align.

EMA 8/21/50 + VWAP Crossover Alert IndicatorOverview of the Indicator
This is a custom Pine Script v5 indicator for TradingView titled "EMA 8/21/50 + VWAP Crossover Alert Indicator" (short title: "EMA+VWAP Cross Alert"). It's designed as an overlay indicator, meaning it plots directly on your price chart rather than in a separate pane. The primary purpose is to detect and alert on crossovers between the 8-period Exponential Moving Average (EMA) and the 21-period EMA, which can signal potential bullish or bearish momentum shifts. These are classic short-term trend reversal or continuation signals often used in trading strategies like momentum or swing trading.
To enhance analysis, it also includes:
A 50-period EMA for medium-term trend context (e.g., to confirm if the overall trend aligns with the crossover).
A Volume Weighted Average Price (VWAP) line, which provides a benchmark for the average price weighted by volume, useful for identifying intraday value areas or fair price levels.
The indicator works across all timeframes (e.g., Daily, 4H, 1H, 15M, 5M, 3M) because the calculations are based on the chart's current bars and adapt to volatility and data resolution. It's not a trading strategy (no entry/exit logic or backtesting), but an alert tool—signals are visual and can trigger notifications in TradingView. Always combine it with risk management, as crossovers can produce false signals in ranging or choppy markets.

EMA 8/21 Crossover Alert IndicatorOverview of the Indicator
This is a custom Pine Script v5 indicator for TradingView titled "EMA 8/21/50 + VWAP Crossover Alert Indicator" (short title: "EMA+VWAP Cross Alert"). It's designed as an overlay indicator, meaning it plots directly on your price chart rather than in a separate pane. The primary purpose is to detect and alert on crossovers between the 8-period Exponential Moving Average (EMA) and the 21-period EMA, which can signal potential bullish or bearish momentum shifts. These are classic short-term trend reversal or continuation signals often used in trading strategies like momentum or swing trading.
To enhance analysis, it also includes:
A 50-period EMA for medium-term trend context (e.g., to confirm if the overall trend aligns with the crossover).
A Volume Weighted Average Price (VWAP) line, which provides a benchmark for the average price weighted by volume, useful for identifying intraday value areas or fair price levels.
The indicator works across all timeframes (e.g., Daily, 4H, 1H, 15M, 5M, 3M) because the calculations are based on the chart's current bars and adapt to volatility and data resolution. It's not a trading strategy (no entry/exit logic or backtesting), but an alert tool—signals are visual and can trigger notifications in TradingView. Always combine it with risk management, as crossovers can produce false signals in ranging or choppy markets.
How It Behaves Across Timeframes
Higher Timeframes (e.g., Daily/4H): Fewer crossovers, focusing on major trends. EMAs smooth out noise; VWAP might represent session averages.
Lower Timeframes (e.g., 3M/5M): More frequent signals due to sensitivity, but higher risk of whipsaws. VWAP resets per session, making it great for intraday trading.
Adaptability: All components scale with bar data—no manual adjustments needed, though tweaking inputs can optimize for specific frames.
In TradingView, you can set up these alerts to notify via popup, sound, email, SMS, or webhook (e.g., to a trading bot). Go to the chart's "Alert" button, select this indicator, and choose conditions like "Bullish Cross" or use the script's built-in alerts.

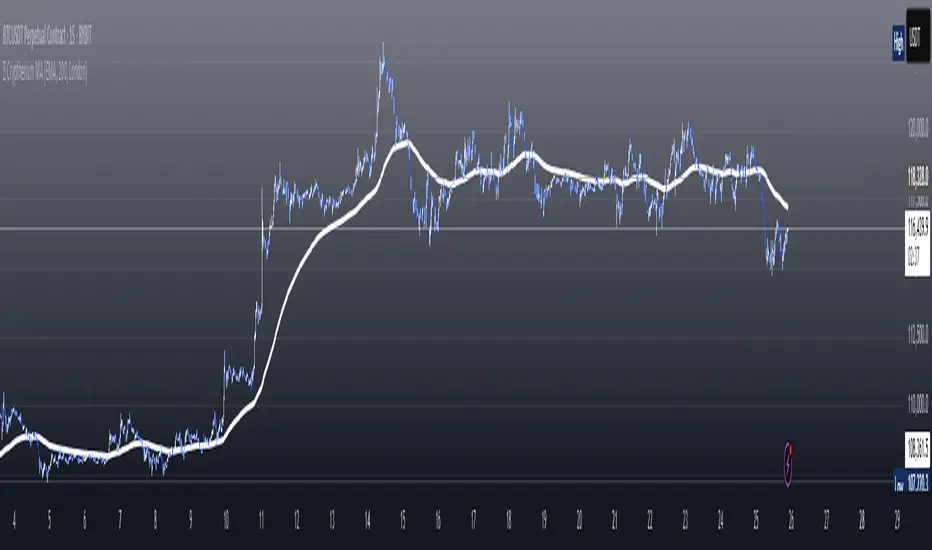
👑 Cryptherium MACryptherium MA is a powerful and flexible moving average indicator designed for serious traders who want full control over how moving averages are calculated and visualized — especially during major market sessions. This tool adapts to different global market hours and supports multiple MA types including EMA, VWAP, WMA, VMA, HMA, and custom session-aware calculations.
Features:
7 MA Options: Choose from EMA, VWAP, WMA, VMA, HMA, NAm (OHLC4-based), and SOAm (Session Open Average).
Session Awareness: Apply MA calculations only during selected sessions: New York, London, or Tokyo.
Volume-Weighted Modes: Includes session-based VWAP and VMA for liquidity-aware MA tracking.
Flexible Styling: White line with thickness for clarity across all chart types and backgrounds.
Use Cases:
Track institutional trend zones by applying VWAP or EMA only during New York or London session.
Compare trend signals between traditional and session-based moving averages.
Use custom logic like SOAm (EMA of session opens) or NAm (SMA of OHLC4) for advanced strategy development.
Integrate seamlessly with price action setups or other Cryptherium tools.
Best For:
Intraday traders using session timing advantage.
Trend followers who need adaptive MA visibility.
Quantitative strategy builders looking for modular MA calculations.
Daily Moving Average to Intraday ChartPlaces 200D, 100D, 50D SMAs as well as the 20D EMA onto intraday charts. (Script v6)

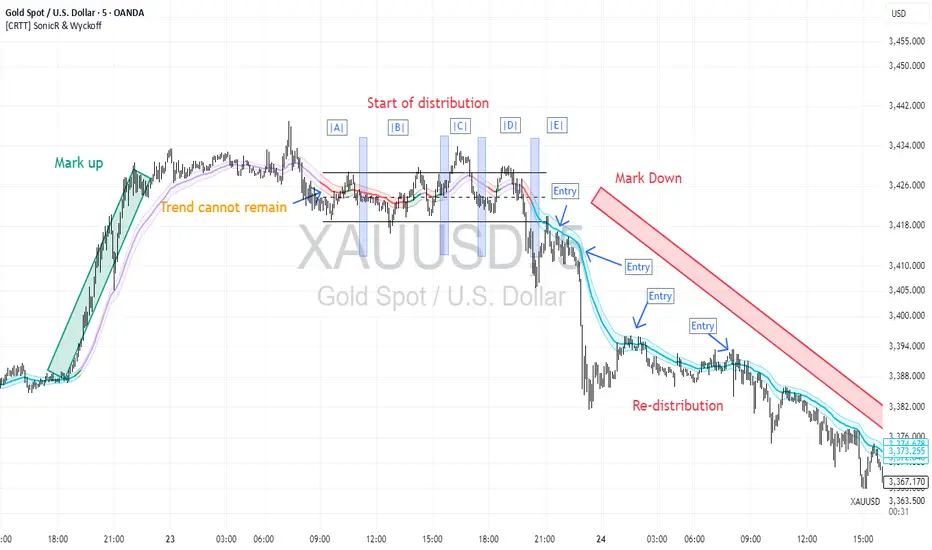
[CRTT] SonicR & Wyckoff phases detectionA trend detection based on Wyckoff method to identify phases as trend of the market and using SonicR system to find entries.
Based on Wyckoff theory, we have around 5 phases: A, B, C, D, E...and the colors of SonicR Dragon bands (EMA34) are used to detect the phases. Red and Blue are 2 colors for downtrend / Green and Purple are uptrend.
With the Red and Green colors, we are in phase |B| or |D|.
With the Purple and Blue colors, we are in phase |D| or |E|.
After trend detection, we will use SonicR system to get the entries.
Open Short positions when price retest Dragon band (EMA34) then go down (confirmation).
Open Long posotions when price retest Dragon band (EMA34) then go up (confirmation).
🟡🔵🟢🔴Beginner's Assistant by carljchapman🟡🔵🟢🔴
Overview
This indicator dynamically marks highs and lows of the premarket (4:00am-9:30amEST) and opening range. It displays Fair Value Gaps, 9 and 21 period Exponential Moving Averages (EMA) and the Volume Weighted Average Price (VWAP). To really help beginners, it marks suggested entry points on the chart with green or red triangles, when a reasonable trend appears.
Features
Automatically draws blue lines for Premarket High and Low values
Dynamically marks the opening Range region
Visual entry signals for long and short opportunities
Primarily used for stocks/funds , but works with forex and crypto
Quick configuration settings to tailor details for your experience level
Mobile friendly mode
Supports alerts
How To Use
Open your chart, and select a 1 or 2 minute timeframe.
Watch for green triangles and red triangles, hinting at entries for long or short positions. Pay particular attention to the price action as it approaches the bounds of the opening range and the premarket levels. I suggest also using a MACD indicator for confirmation of the trend.
For scalping 0dte Options, switch frequently between the 1 ,2 and 5 minute or higher timeframes. Do this so you will not miss an entry opportunity or be unaware of the overall trend.
As a beginner, until you have refined your strategy and develop risk management, take profits as low as 10%. A small profit can quickly become a much larger loss. With 0dte options, time will devour your profits even when the price doesn’t budge.
What makes this indicator so beginner friendly?
Charts with too many lines and colors are are a nightmare for beginners! And empty charts do not tell the whole story. Simple checkboxes in the configuration settings let you turn on and off features to match your comfort level. As you become more familiar you might try turning off the suggested entries to see if you would have selected the same or better ones yourself. Just one example of how you will learn and verify your knowledge. You will quickly spot Opening Range Breakouts and more.
Why are the triangle pointers not simply above or below the bars?
As a beginner, I like to review charts to see how much the price changed, then estimate how much a contract would move based on its delta. A mouthful, I know. But what price does an arrow pointing up below a bar reflect? Would I have entered at the open or close, low or high? This indicator helps by putting the marker close to the price when indicated. It can even display the actual price on the bar. This is helpful for you to make fast calculations without a measuring tool.
I am an experienced trader. Can this help me make winning trades?
Sure. It can also help you make losing ones! Profit is not guaranteed with any indicator or strategy. This indicator is designed to assist you as you learn and while you trade. You won't see the words BUY or SELL. This is not a signal bot! It is merely a tool to assist you. You can learn a lot by spending time observing price movement using this indicator without ever making a single trade.
🟡🔵🟢🔴

🟡🔵🟢🔴Beginner's Assistant by carljchapman🟡🔵🟢🔴
Overview
This indicator dynamically marks highs and lows of the premarket (4:00am-9:30amEST) and opening range. It displays Fair Value Gaps, 9 and 21 period Exponential Moving Averages (EMA) and the Volume Weighted Average Price (VWAP). To really help beginners, it marks suggested entry points on the chart with green or red triangles, when a reasonable trend appears.
Features
Automatically draws blue lines for Premarket High and Low values
Dynamically marks the opening Range region
Visual entry signals for long and short opportunities
Primarily used for stocks/funds , but works with forex and crypto
Quick configuration settings to tailor details for your experience level
Mobile friendly mode
Supports alerts
How To Use
Open your chart, and select a 1 or 2 minute timeframe.
Watch for green triangles and red triangles, hinting at entries for long or short positions. Pay particular attention to the price action as it approaches the bounds of the opening range and the premarket levels. As with any indicator, confirmation is helpful. I personally use MACD to confirm the direction of each probable trend.
For scalping 0dte contracts: You should switch very often between 1 and 2 min timeframes and look carefully for quality entry opportunities. TP (take profit) quickly with gains of 15% or more until you develop and refine your own strategy and risk management. Beginners like to see profit; just remember that a small profit is better than what could quickly become a large loss!
What makes this indicator so beginner friendly?
Charts with too many lines and colors are are a nightmare for beginners! And empty charts do not tell the whole story. Simple checkboxes in the configuration settings let you turn on and off features to match your comfort level. As you become more familiar you might try turning off the suggested entries to see if you would have selected the same or better ones yourself. Just one example of how you will learn and verify your knowledge. You will quickly spot Opening Range Breakouts and more.
Why are the triangle pointers not simply above or below the bars?
As a beginner, I like to review charts and see how much the price changed, to estimate how much a contract would move based on its delta. A mouthful, I know. But what price does an arrow pointing up below a bar reflect? Would I have entered at the open or close, low or high? This indicator helps by putting the marker close to the price when indicated. It can even display the actual price on the bar. This is helpful for you to make fast calculations without a measuring tool.
I am an experienced trader. Can this help me make winning trades?
Sure. It can also help you make losing trades! Profit is never guaranteed with any indicator or strategy. This indicator is designed to assist as you learn and trade. You won't see the words BUY or SELL. This is not a signal bot! It is merely a tool to assist you. You can learn a lot by just observing price movement while using this indicator without making a single trade.
🟡🔵🟢🔴

Daily EMAs (8, 21 & 50) with BandDescription:
This script plots the Daily EMAs (8, 21, and 50) on any intraday or higher timeframe chart. It provides a clear, multi-timeframe view of market trends by using daily exponential moving averages (EMAs) and a dynamic visual band. I use this on the major indexes to decide if I should be mostly longing or shorting assets.
-In addition to identifying the trend structure, the 8-Day EMA often serves as a key area where buyers or sellers may become active, depending on the market direction:
-In an uptrend, the 8 EMA can act as a dynamic support zone, where buyers tend to re-enter on pullbacks.
-In a downtrend, the same EMA may act as resistance, where sellers become more aggressive.
-The script also includes a colored band between the 8 and 21 EMAs to highlight the short-term trend bias:
-Green fill = 8 EMA is above the 21 EMA (bullish structure).
Blue fill = 8 EMA is below the 21 EMA (bearish structure).
The 50-Day EMA is included to give additional context for intermediate-term trend direction.
Features:
- Daily EMA levels (8, 21, and 50) calculated regardless of current chart timeframe.
- 8 EMA acts as a potential buyer/seller zone based on trend direction.
- Color-coded band between 8 and 21 EMAs:
- Green = Bullish short-term bias
- Blue = Bearish short-term bias
- Customizable price source and EMA offset.
- Suitable for trend trading, pullback entries, and higher-timeframe confirmation.
Use Cases:
Identify key dynamic support/resistance areas using the 8 EMA.
Assess short-, medium-, and intermediate-term trend structure at a glance.
Enhance confluence for entry/exit signals on lower timeframes.

EMA Curl Strength+EMA Curl Strength+
Description:
This indicator provides a statistically normalized view of EMA slope momentum using Z-score transformation. By evaluating the rate of change of an EMA and comparing it against its historical behavior, the script highlights momentum shifts in a dynamic, adaptive way.
⸻
How It Works:
• Calculates the slope (percentage change) of a chosen EMA.
• Normalizes the slope using Z-score over a custom lookback period.
• Smooths the resulting signal and computes two signal lines for comparison.
• Assigns dynamic colors based on user-defined Z-score thresholds for mild, moderate, and strong momentum in both directions.
⸻
Visual Features:
• Gradient fill between the Z Curl Line and Signal 1 to highlight slope acceleration.
• Histogram showing the difference between the Z Curl Line and its signal.
• Optional signal crossover shapes between configurable pairs (e.g., Z Curl vs. Signal).
• Background highlights when the Z Curl Line exceeds ±2, indicating strong trending behavior.
⸻
Customization:
• Adjustable EMA length, smoothing lengths, signal lengths, histogram smoothing, and Z-score lookback.
• Separate color controls for:
• Z-score strength bands (mild/moderate/strong up/down)
• Histogram bars
• Signal lines
• Background highlight zones
• Crossover shapes
⸻
Use Cases:
• Momentum Confirmation: Confirm strength when Z Curl exceeds ±2 with matching background highlights.
• Trend Entry Timing: Look for trades when Z Curl crosses above or below the 0-line.
• Scalping: Capture quick directional moves when momentum accelerates.
• Trend Following: Use strong Z Curl values to confirm trade direction and filter sideways action.
• Divergence Detection: Spot divergences between price and Z Curl movement to anticipate reversals.

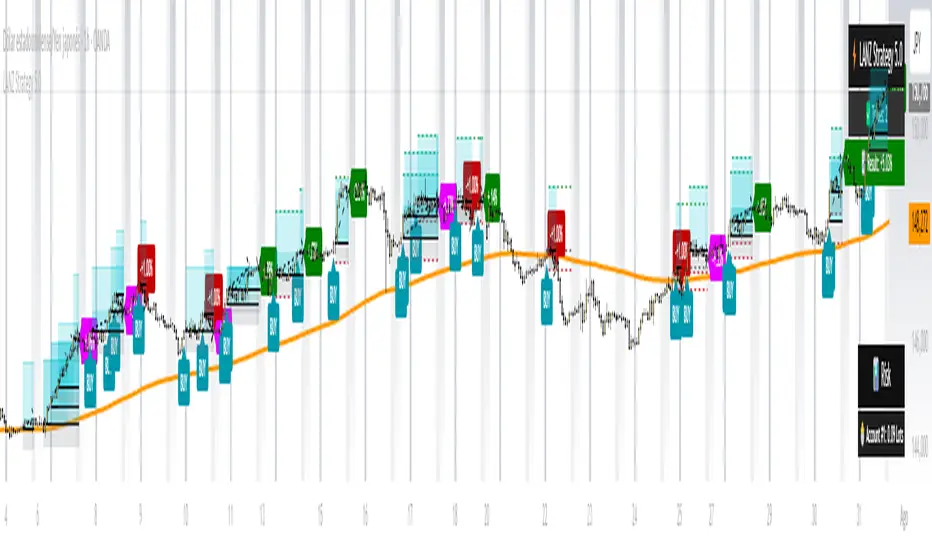
LANZ Strategy 5.0🔷 LANZ Strategy 5.0 — Intraday BUY Signals, Dynamic Lot Size per Account, Real-Time Dashboard and Smart Execution
LANZ Strategy 5.0 is a powerful intraday tool designed for traders who need a visual-first, data-backed BUY system, enhanced with risk-aware lot size calculation and a real-time performance dashboard. This indicator intelligently detects strong momentum setups and provides visual and statistical clarity throughout the session.
📌 This is an indicator, not a strategy — It does not place trades automatically but provides precise conditions, alerts, and visual guides to support execution.
🧠 Core Logic & Features
BUY Entry Conditions (Signal Engine)
A BUY signal is triggered when:
The current price is above the EMA200 (trend filter)
The last 3 candles are bullish (candle body close > open)
You are within the defined session window (NY time)
When all conditions are met and you haven’t reached the daily trade limit, a signal appears on the chart and an optional alert is triggered.
Operational Hours Filter (NY Time)
You define:
Start time (e.g., 01:15 NY)
End time (e.g., 16:00 NY)
The system only evaluates and executes signals within this period. If a BUY setup occurs outside the window, it’s ignored. The chart is also highlighted with a transparent teal background to visually show active trading hours.
Lot Size Panel with Per-Account Risk Management
Designed for traders managing multiple accounts or capital sources. You can enable up to 5 accounts, each with:
Its own capital
Its own risk percentage per trade
The system uses the defined SL in pips, plus the instrument’s pip value, to calculate the lot size per account. All values are shown in a dedicated panel at the bottom-right, automatically updating with each new trade.
The emojis (🐣🦊🦁🐲🐳) distinguish each account visually.
Trade Visualization with Customizable Lines
When a signal is triggered:
An Entry Point (EP) line is drawn at the candle’s close.
A Stop Loss (SL) line is placed X pips below the entry.
A Take Profit (TP) line is placed Y pips above the entry.
All three lines are fully customizable in style, color, and thickness. You define how many bars the lines should extend.
Outcome Tracking & Real-Time Dashboard
Each trade outcome is measured:
SL hit = –1.00%
TP hit = +3.00%
Manual close = calculated dynamically based on price at close time
Each result is labeled on the chart near its level, and stored.
The top-right dashboard updates in real time:
✅ Number of trades
📈 Cumulative % gain/loss of the day (color-coded)
Alerts You Can Trust:
You’ll get a Buy Alert when a valid signal is formed
You’ll get a Trade Executed Alert when the visual operation is plotted
You’ll get a SL/TP Hit Alert with price and result
You’ll get a Manual Close Alert if the configured time is reached and the trade is still active
⚙️ Step-by-Step Execution Flow
At every bar, the system checks:
Are we within the session time window?
Is price above EMA?
Are the last 3 candles bullish?
✅ If yes:
A BUY signal is plotted
Entry/SL/TP lines are drawn
Lot sizes are calculated and displayed
Trade is added to the daily count
🕐 At the configured Manual Close time (e.g., 16:00 NY):
If the trade is still open, it's closed
A label is added with the exact result in %
💡 Ideal For:
Intraday traders who operate within fixed time sessions
Traders managing multiple accounts or capital pools
Anyone who wants full visual clarity of every decision point
Traders who appreciate dynamic lot size calculation and clean execution tracking
👨💻 Credits:
💡 Developed by: LANZ
🧠 Strategy concept & execution model: LANZ
🧪 Tested on: 1H charts with visual-only execution
📈 Designed for: Clarity, adaptability, and full intraday control
Trend Band Oscillator📌 Trend Band Oscillator
📄 Description
Trend Band Oscillator is a momentum-based trend indicator that calculates the spread between two EMAs and overlays it with a volatility filter using a standard deviation band. It helps traders visualize not only the trend direction but also the strength and stability of the trend.
📌 Features
🔹 EMA Spread Calculation: Measures the difference between a fast and slow EMA to quantify short-term vs mid-term trend dynamics.
🔹 Volatility Band Overlay: Applies an EMA of standard deviation to the spread to filter noise and highlight valid momentum shifts.
🔹 Color-Based Visualization: Positive spread values are shown in lime (bullish), negative values in fuchsia (bearish) for quick directional insight.
🔹 Upper/Lower Bands: Help detect potential overbought/oversold conditions or strong trend continuation.
🔹 Zero Line Reference: A horizontal baseline at zero helps identify trend reversals and neutral zones.
🛠️ How to Use
✅ Spread > 0: Indicates a bullish trend. Consider maintaining or entering long positions.
✅ Spread < 0: Indicates a bearish trend. Consider maintaining or entering short positions.
⚠️ Spread exceeds bands: May signal overextension or strong momentum; consider using with additional confirmation indicators.
🔄 Band convergence: Suggests weakening trend and potential transition to a ranging market.
Recommended timeframes: 1H, 4H, Daily
Suggested complementary indicators: RSI, MACD, OBV, SuperTrend
✅ TradingView House Rules Compliance
This script is open-source and published under Pine Script v5.
It does not repaint, spam alerts, or cause performance issues.
It is designed as an analytical aid only and should not be considered financial advice.
All calculations are transparent, and no external data sources or insecure functions are used.
====================================================================
📌 Trend Band Oscillator
📄 설명 (Description)
Trend Band Oscillator는 두 개의 EMA 간 스프레드(차이)를 기반으로 한 모멘텀 중심의 추세 오실레이터입니다. 여기에 표준편차 기반의 변동성 밴드를 적용하여, 추세의 방향뿐 아니라 강도와 안정성까지 시각적으로 분석할 수 있도록 설계되었습니다.
📌 주요 특징 (Features)
🔹 EMA 기반 스프레드 계산: Fast EMA와 Slow EMA의 차이를 활용해 시장 추세를 정량적으로 표현합니다.
🔹 표준편차 필터링: Spread에 대해 EMA 및 표준편차 기반의 밴드를 적용해 노이즈를 줄이고 유효한 추세를 강조합니다.
🔹 컬러 기반 시각화: 오실레이터 값이 양수일 경우 초록색, 음수일 경우 마젠타 색으로 추세 방향을 직관적으로 파악할 수 있습니다.
🔹 밴드 범위 시각화: 상·하위 밴드를 통해 스프레드의 평균 편차 범위를 보여주며, 추세의 강약과 포화 여부를 진단할 수 있습니다.
🔹 제로 라인 표시: 추세 전환 가능 지점을 시각적으로 확인할 수 있도록 중심선(0선)을 제공합니다.
🛠️ 사용법 (How to Use)
✅ 오실레이터가 0 이상 유지: 상승 추세 구간이며, 롱 포지션 유지 또는 진입 검토
✅ 오실레이터가 0 이하 유지: 하락 추세 구간이며, 숏 포지션 유지 또는 진입 검토
⚠️ 상·하위 밴드를 이탈: 일시적인 과매수/과매도 혹은 강한 추세 발현 가능성 있음 → 다른 보조지표와 함께 필터링 권장
🔄 밴드 수렴: 추세가 약해지고 있음을 나타냄 → 변동성 하락 또는 방향성 상실 가능성 있음
권장 적용 시간대: 1시간봉, 4시간봉, 일봉
보조 적용 지표: RSI, MACD, OBV, SuperTrend 등과 함께 사용 시 신호 필터링에 유리
✅ 트레이딩뷰 하우스룰 준수사항 (TV House Rules Compliance)
이 지표는 **무료 공개용(Open-Source)**이며, Pine Script Version 5로 작성되어 있습니다.
과도한 리페인트, 비정상적 반복 경고(alert spam), 실시간 성능 저하 등의 요소는 포함되어 있지 않습니다.
사용자는 본 지표를 투자 결정의 참고용 보조 도구로 활용해야 하며, 독립적인 매매 판단이 필요합니다.
데이터 소스 및 계산 방식은 완전히 공개되어 있으며, 외부 API나 보안 취약점을 유발하는 구성 요소는 없습니다.

52SIGNAL RECIPE EMA Trend ═══ 52SIGNAL RECIPE EMA Trend ═══
◆ Overview
52SIGNAL RECIPE EMA Trend is a powerful visual tool that allows you to instantly grasp market trends without complex chart analysis. It represents the direction and strength of trends through an intuitive color-coding system based on the relative positions of three Exponential Moving Averages (EMAs).
─────────────────────────────────────
◆ Key Features
• Trend Direction and Strength Visualization: Instantly identify trend direction and strength through an intuitive color-coding system
• EMA Relationship Analysis: Analyze the relative positions of short-term, medium-term, and long-term EMAs to determine trend status
• Clean Separate Window Display: Provides clear visual representation in a window separate from the price chart
─────────────────────────────────────
◆ Technical Foundation
52SIGNAL RECIPE EMA Trend utilizes the following three EMAs:
• Short-term EMA (default: 9)
• Medium-term EMA (default: 20)
• Long-term EMA (default: 50)
By analyzing the relative positions of these three EMAs, it determines the following trend states:
■ Intuitive Color-Coding System
• Bullish Trend (Blue Zones)
▶ Bright Blue: Strong bullish trend - Short-term EMA > Medium-term EMA and Short-term EMA > Long-term EMA
▶ Dark Blue: Weak bullish trend - Short-term EMA > Medium-term EMA but Short-term EMA < Long-term EMA
• Bearish Trend (Red Zones)
▶ Bright Red: Strong bearish trend - Short-term EMA < Medium-term EMA and Short-term EMA < Long-term EMA
▶ Dark Red: Weak bearish trend - Short-term EMA < Medium-term EMA but Short-term EMA > Long-term EMA
─────────────────────────────────────
◆ Practical Applications
■ Trend Identification
• Bullish Trend: Blue zones indicate an ongoing bullish trend. Particularly, bright blue zones represent a strong bullish trend with all EMAs aligned.
• Bearish Trend: Red zones indicate an ongoing bearish trend. Bright red zones suggest strong bearish momentum.
• Trend Reversal: When the color changes from blue to red (or vice versa), it indicates that a trend reversal has occurred.
■ Trading Strategy Applications
• Consider Long Positions: When transitioning to blue zones, especially when changing from dark blue to bright blue, consider long positions.
• Consider Short Positions: When transitioning to red zones, especially when changing from dark red to bright red, consider short positions.
• Position Maintenance/Management: Maintain existing positions while the same color persists, and reassess risk management when color intensity changes.
■ Synergy with Other Indicators
52SIGNAL RECIPE EMA Trend is more effective when used alongside these indicators:
• RSI: Verify overbought/oversold conditions to optimize entry points within trends
• Volume Indicators: Validate trend strength through volume confirmation
• Support/Resistance Levels: Analyze with key price levels to determine entry/exit points
• Bollinger Bands: Identify volatility within trends and potential reversal points
─────────────────────────────────────
◆ Customization
You can adjust the following parameters as needed:
• Short-term EMA Length: Decrease for more sensitive reactions, increase for smoother signals
• Medium-term EMA Length: Adjust for medium-term trend perspective
• Long-term EMA Length: Adjust for long-term trend filtering strength
─────────────────────────────────────
◆ Conclusion
52SIGNAL RECIPE EMA Trend is a powerful visualization tool that enables intuitive understanding of market trends. It allows for immediate recognition of trend direction and strength without complex analysis, making it applicable to various trading styles from short-term traders to long-term investors.
This indicator is most effective when used as a tool to visualize trend conditions rather than as an independent trading signal generator. Always use it in conjunction with other technical/fundamental analysis tools to make more robust trading decisions.
─────────────────────────────────────
※ Disclaimer: Past performance does not guarantee future results. Always use appropriate risk management strategies.
═══ 52SIGNAL RECIPE EMA 트렌드 ═══
◆ 개요
52SIGNAL RECIPE EMA 트렌드는 복잡한 차트 분석 없이도 시장 트렌드를 즉시 파악할 수 있는 강력한 시각적 도구입니다. 세 가지 지수 이동 평균선(EMA)의 상대적 위치를 기반으로 한 직관적인 색상 코딩 시스템을 통해 트렌드의 방향과 강도를 표현합니다.
─────────────────────────────────────
◆ 주요 특징
• 트렌드 방향 및 강도 시각화: 직관적인 색상 코딩 시스템을 통해 트렌드 방향과 강도를 즉시 식별
• EMA 관계 분석: 단기, 중기, 장기 EMA의 상대적 위치를 분석하여 트렌드 상태 판단
• 깔끔한 별도 창 표시: 가격 차트와 별도의 창에서 명확한 시각적 표현 제공
─────────────────────────────────────
◆ 기술적 기반
52SIGNAL RECIPE EMA 트렌드는 다음 세 가지 EMA를 활용합니다:
• 단기 EMA (기본값: 9)
• 중기 EMA (기본값: 20)
• 장기 EMA (기본값: 50)
이 세 가지 EMA의 상대적 위치를 분석하여 다음과 같은 트렌드 상태를 결정합니다:
■ 직관적인 색상 코딩 시스템
• 강세 트렌드 (파란색 영역)
▶ 밝은 파란색: 강한 강세 트렌드 - 단기 EMA > 중기 EMA 그리고 단기 EMA > 장기 EMA
▶ 어두운 파란색: 약한 강세 트렌드 - 단기 EMA > 중기 EMA 하지만 단기 EMA < 장기 EMA
• 약세 트렌드 (빨간색 영역)
▶ 밝은 빨간색: 강한 약세 트렌드 - 단기 EMA < 중기 EMA 그리고 단기 EMA < 장기 EMA
▶ 어두운 빨간색: 약한 약세 트렌드 - 단기 EMA < 중기 EMA 하지만 단기 EMA > 장기 EMA
─────────────────────────────────────
◆ 실용적 응용
■ 트렌드 식별
• 강세 트렌드: 파란색 영역은 진행 중인 강세 트렌드를 나타냅니다. 특히 밝은 파란색 영역은 모든 EMA가 정렬된 강한 강세 트렌드를 나타냅니다.
• 약세 트렌드: 빨간색 영역은 진행 중인 약세 트렌드를 나타냅니다. 밝은 빨간색 영역은 강한 약세 모멘텀을 시사합니다.
• 트렌드 반전: 색상이 파란색에서 빨간색으로(또는 그 반대로) 변경되면 트렌드 반전이 발생했음을 나타냅니다.
■ 트레이딩 전략 응용
• 롱 포지션 고려: 파란색 영역으로 전환될 때, 특히 어두운 파란색에서 밝은 파란색으로 변경될 때 롱 포지션을 고려하세요.
• 숏 포지션 고려: 빨간색 영역으로 전환될 때, 특히 어두운 빨간색에서 밝은 빨간색으로 변경될 때 숏 포지션을 고려하세요.
• 포지션 유지/관리: 같은 색상이 지속되는 동안 기존 포지션을 유지하고, 색상 강도가 변경될 때 리스크 관리를 재평가하세요.
■ 다른 지표와의 시너지
52SIGNAL RECIPE EMA 트렌드는 다음 지표들과 함께 사용할 때 더 효과적입니다:
• RSI: 과매수/과매도 상태를 확인하여 트렌드 내 진입 시점 최적화
• 거래량 지표: 거래량 확인을 통한 트렌드 강도 검증
• 지지/저항 레벨: 주요 가격 레벨과 함께 분석하여 진입/퇴출 시점 결정
• 볼린저 밴드: 트렌드 내 변동성과 잠재적 반전 지점 식별
─────────────────────────────────────
◆ 커스터마이징
필요에 따라 다음 매개변수를 조정할 수 있습니다:
• 단기 EMA 길이: 더 민감한 반응을 위해 감소, 더 부드러운 신호를 위해 증가
• 중기 EMA 길이: 중기 트렌드 관점에 맞게 조정
• 장기 EMA 길이: 장기 트렌드 필터링 강도 조정
─────────────────────────────────────
◆ 결론
52SIGNAL RECIPE EMA 트렌드는 시장 트렌드를 직관적으로 이해할 수 있게 해주는 강력한 시각화 도구입니다. 복잡한 분석 없이 트렌드 방향과 강도를 즉시 인식할 수 있어, 단기 트레이더부터 장기 투자자까지 다양한 트레이딩 스타일에 적용할 수 있습니다.
이 지표는 독립적인 트레이딩 신호 생성기보다는 트렌드 상태를 시각화하는 도구로 사용할 때 가장 효과적입니다. 항상 다른 기술적/기본적 분석 도구와 함께 사용하여 더 견고한 트레이딩 결정을 내리세요.
─────────────────────────────────────
※ 면책 조항: 과거 성과가 미래 결과를 보장하지 않습니다. 항상 적절한 리스크 관리 전략을 사용하세요.
Super Neema!🟧 Super Neema! — Multi-Timeframe EMA-9 Overlay
🔍 What is "Neema"?
The term "Neema" has recently emerged among traders such as Jeff Holden—a top proprietary trading firm trader—whose colleagues colloquially use "Neema" as shorthand for the 9-period Exponential Moving Average (EMA). Due to its increasing popularity and reliability, the phrase caught on quickly as traders needed a quick, memorable name for such an essential tool.
📚 Why the 9-EMA?
Scalping around the 9-EMA is now one of the most widely used intraday trading techniques. Traders of various experience levels frequently rely on it because it effectively highlights short-term momentum shifts.
But there's a crucial nuance: traders across different assets or market periods don't always agree on which timeframe’s 9-EMA to follow. Depending on who's currently active in the market, the dominant "Neema" could be the 1-minute, 2-minute, 3-minute, or 5-minute 9-EMA. This variation arises naturally due to differences in trader populations, risk tolerance, style, and current market conditions.
👥 Social Convention & Normative Social Influence
Trading is fundamentally a social activity, and normative social influence plays a critical role in market behavior. Traders don’t operate in isolation; they follow patterns, respond to cues, and rely on shared conventions. The popularity of any given indicator—like the 9-EMA—is not just technical, but deeply social. Traders adapt to what's socially accepted, recognizable, and effective.
Over time, these conventions shift. What once was "the standard" timeframe can subtly evolve as dominant traders or institutions shift their preferred style or timeframe, creating "variants" of established trends. Understanding this dynamic is essential for market participants because recognizing where the majority of traders currently focus gives a critical edge.
📈 Why Does This Matter? (Market Evolution & Trader Adaptability)
Market trends aren't just technical—they're social constructs. As markets evolve, participants adapt their methods to fit new norms. Traders who recognize and adapt quickly to these evolving norms gain a decisive advantage.
By clearly visualizing multiple Neemas (9-EMAs across timeframes) simultaneously, you don't merely see EMA levels—you visually sense the current social convention of the market. This heightened awareness helps you stay adaptive and flexible, aligning your strategy dynamically with the broader community of traders.
🎨 Transparency Scheme (Visual Identification):
5-minute Neema: Most opaque, brightest line (slowest, most significant trend)
3-minute Neema: Slightly more transparent
2-minute Neema: Even more transparent
1-minute Neema: Most transparent, subtle background hint (fastest, quickest reaction)
This deliberate visual hierarchy makes it intuitive to identify immediately which timeframe is currently dominant, and therefore, which timeframe other traders are using most actively.
✅ Works on:
Any timeframe, any chart. Automatically plots the 1m–5m EMA-9 lines regardless of your current chart.
🧠 Key Insight:
Markets are driven by social trends and normative influence.
Identifying the currently dominant timeframe (the Neema most respected by traders at that moment) is a powerful, socially-informed edge.
Trader adaptability isn't just technical—it's social awareness in action.
Enjoy your trading, and welcome to Super Neema! ⚡

[CRTT] Dragon TrendModified Sonic R system based on Wyckoff logic to indicate current trend phase and strength based on the Dragon (EMA34) color.
1. Red : downtrend but the trend strength is weak and can be consider as phase |B| or |D|. Open positions in this color is risk, we should wait more.
2. Green : uptrend but the trend strength is weak and can be consider as phase |B| or |D|. Open positions in this color is risk, we should wait more.
3. Purple : uptrend and the strength of trend is strongly bullish that can be considered as phase |D| or |E| in accumulation phase. This is where we place our Long positions because the trend is strongly bullish and price could continue to run upward.
4. Blue : downtrend and the strength of trend is strongly bearish that can be considered as phase |D| or |E| in distribution phase. This is where we place our Short positions because the trend is strongly bearish and price could continue to run downward.

Auto-Length Anchored Multiple EMA (Hour-Based)# Auto-Length Anchored Multiple EMA (Hour-Based)
## Overview
This advanced EMA indicator automatically calculates Exponential Moving Average lengths based on the time elapsed since user-defined anchor dates. Unlike traditional fixed-length EMAs, this indicator dynamically adjusts EMA periods based on actual trading hours, making it ideal for event-based analysis and time-sensitive trading strategies.
## Key Features
### 🎯 **Dual Mode Operation**
- **Auto Mode**: EMA length automatically calculated from anchor date to current time
- **Manual Mode**: Traditional fixed-length EMA calculation
- Switch between modes independently for each EMA
### 📊 **Multiple EMA Support**
- Up to 4 independent EMAs with individual configurations
- Each EMA can have its own anchor date and settings
- Individual enable/disable controls for each EMA
### ⏰ **Smart Time Calculation**
- Accounts for actual trading hours (customizable)
- Weekend exclusion with Saturday trading option (for markets like NSE/BSE)
- Hour multiplier for fine-tuning EMA sensitivity
- Minimum EMA length protection to prevent calculation errors
### 🎨 **Visual Enhancements**
- **Dynamic Fill Colors**: Fill between EMA1 and EMA3 changes color based on price position
- **Customizable Colors**: Individual color settings for each EMA
- **Anchor Visualization**: Optional vertical lines and labels at anchor dates
- **Real-time Table**: Shows current EMA lengths, modes, and values
## Configuration Options
### Trading Session Settings
- **Trading Hours Per Day**: Set your market's trading hours (1-24)
- **Trading Days Per Week**: Configure for different markets (5 for Mon-Fri, 6 for Mon-Sat)
- **Include Saturday**: Enable for markets that trade on Saturday
- **Hour Multiplier**: Fine-tune EMA sensitivity (0.1x to 10x)
### EMA Configuration
- **Anchor Dates**: Set specific start dates for each EMA calculation
- **Manual Lengths**: Override with traditional fixed periods when needed
- **Enable/Disable**: Individual control for each EMA
- **Color Customization**: Personalize appearance for each EMA
### Visual Options
- **Fill Settings**: Toggle and customize fill colors between EMAs
- **Anchor Lines**: Show vertical lines at anchor dates
- **Anchor Labels**: Display formatted anchor date information
- **Length Table**: Real-time display of current EMA parameters
## Use Cases
### 📈 **Event-Based Analysis**
- Anchor EMAs to earnings announcements, policy decisions, or market events
- Track price behavior relative to specific time periods
- Analyze momentum changes from key market catalysts
### 🕐 **Time-Sensitive Trading**
- Perfect for intraday strategies where timing is crucial
- Automatically adjusts to market hours and trading sessions
- Eliminates manual EMA length recalculation
### 🌍 **Multi-Market Support**
- Configurable for different global markets
- Saturday trading support for Asian markets
- Flexible trading hour settings
## Technical Details
### Calculation Method
The indicator calculates trading bars elapsed since anchor date using:
```
Total Trading Bars = (Days Since Anchor × Trading Days Per Week ÷ 7) × Trading Hours Per Day × Hour Multiplier
```
### EMA Formula
Uses standard EMA calculation with dynamically calculated alpha:
```
Alpha = 2 ÷ (Current Length + 1)
EMA = Alpha × Current Price + (1 - Alpha) × Previous EMA
```
### Weekend Handling
- Automatically excludes weekends from calculation
- Optional Saturday inclusion for specific markets
- Accurate trading day counting
## Installation & Setup
1. **Add to Chart**: Apply the indicator to your desired timeframe
2. **Set Anchor Dates**: Configure anchor dates for each EMA you want to use
3. **Adjust Trading Hours**: Set your market's trading session parameters
4. **Customize Appearance**: Choose colors and visual options
5. **Enable Features**: Turn on fills, anchor lines, and information table as needed
## Best Practices
- **Anchor Selection**: Choose significant market events or technical breakouts as anchor points
- **Multiple Timeframes**: Use different anchor dates for short, medium, and long-term analysis
- **Hour Multiplier**: Start with 1.0 and adjust based on market volatility and your trading style
- **Visual Clarity**: Use contrasting colors for different EMAs to improve readability
## Compatibility
- **Pine Script Version**: v6
- **Chart Types**: All chart types supported
- **Timeframes**: Works on all timeframes (optimal on intraday charts)
- **Markets**: Suitable for stocks, forex, crypto, and commodities
## Notes
- Indicator starts calculation from the anchor date forward
- Minimum EMA length prevents calculation errors with very recent anchor dates
- Table display updates in real-time showing current EMA parameters
- Fill colors dynamically change based on price position relative to EMA1
---
*This indicator is perfect for traders who want to combine the power of EMAs with event-driven analysis and precise time-based calculations.*

Price Extension from 8 EMAOverview
This indicator can be used to see how far away the price is from the 8 EMA. It compares this to the Average Daily Range % to see if the stock may be overextended. The "Extension Multiplier" represents how far the stock is extended away from the 8 EMA.
Core Concept
This indicator is best used for breakout trades that are trying to make sure they are not chasing the stock.
How to Use This Indicator
This tool is primarily intended for analyzing daily charts of individual stocks and is often used by breakout traders to evaluate potential entry areas.
If the stock is far away from the 8 EMA, it is likely not ready to break out. If it is close to the 8ema, it could be ready to move higher.
This indicator can also be used in the opposite way. For example, shorting or puts.
Understanding the colors
Green (Not Extended): Indicates the price is close to the 8 EMA. This often corresponds to periods of consolidation.
Yellow (Slightly Extended): The price is beginning to move away from the 8 EMA.
Orange (Extended): The price has moved a considerable distance from the 8 EMA.
Red (Very Extended): The price is at an extreme distance from the 8 EMA, historically increasing the likelihood of a pullback or consolidation.
Settings
Info Row Position: Adjusts the vertical position of the display table on the chart. Useful when using other indicators.
ADR Length: Sets the lookback period for calculating the Average Daily Range. Or the average range % for different timeframes.
Timeframe: Determines the timeframe for the EMA and ADR calculation (the default is Daily).

EMA Trend Dashboard
Trend Indicator using 3 custom EMA lines. Displays a table with 5 rows(position configurable)
-First line shows relative position of EMA lines to each other and outputs Bull, Weak Bull, Flat, Weak Bear, or Bear. EMA line1 should be less than EMA line2 and EMA line 2 should be less than EMA line3. Default is 9,21,50.
-Second through fourth line shows the slant of each EMA line. Up, Down, or Flat. Threshold for what is considered a slant is configurable. Also added a "steep" threshold configuration for steep slants.
-Fifth line shows exhaustion and is a simple, configurable calculation of the distance between EMA line1 and EMA line2.
--Lines one and five change depending on its value but ALL other colors are able to be changed.
--Default is somewhat set to work well with Micro E-mini Futures but this indicator can be changed to work on anything. I created it to help get a quick overview of short-term trend on futures. I used ChatGPT to help but I am still not sure if it actually took longer because of it.

Normalized EMA Cycle (NEC)Normalized EMA Cycle (NEC)
The Normalized EMA Cycle (NEC) is a versatile momentum and trend reversal tool designed to detect high-probability turning points and gauge the strength of price cycles.
It combines fast and slow Exponential Moving Averages (EMAs), dynamic normalization, and adaptive transparency to create clear, intuitive reversal signals on the chart.
🔹 How It Works
EMA Differencing
The NEC calculates the difference between a fast EMA and a slower EMA:
Fast EMA Length (default 6) captures short-term momentum.
Slow EMA Length (default 16) tracks broader trends.
The slope of this difference identifies accelerating or decelerating momentum.
Normalization to 0–100 Scale
The raw EMA difference is scaled relative to the recent Alpha Period range (default 6 bars).
This transforms the value into a normalized oscillator ranging between 0 and 100.
A 3-period Hull Moving Average (HMA) smooths this series to reduce noise.
Overbought and Oversold Thresholds
By default:
Overbought Level: 75
Oversold Level: 25
Crossovers of these levels are used to detect potential reversals.
Adaptive Alpha Adjustment
The normalized value is transformed into an “Alpha Schaff” line, dynamically shifting between price and normalized cycles.
This helps the model adjust to different volatility regimes.
Trend Reversal Logic
Bullish Reversal:
Normalized oscillator crosses above the Oversold Level.
EMA difference slope is positive.
Bearish Reversal:
Normalized oscillator crosses below the Overbought Level.
EMA difference slope is negative.
Additional confirmation comes when price crosses the Alpha Schaff line in the direction of momentum.
Dynamic Confidence Visualization
The indicator calculates a trend confidence score based on the normalized separation of the EMAs.
The transparency of reversal markers dynamically adjusts:
Strong trends = more opaque signals
Weak trends = more transparent signals
🔹 How to Use
✅ Entries
Long Signal: Aqua upward label appears below a bar.
Conditions:
Bullish reversal or price crossing above Alpha Schaff
Normalized slope is rising
Short Signal: Fuchsia downward label appears above a bar.
Conditions:
Bearish reversal or price crossing below Alpha Schaff
Normalized slope is falling
✅ Trend Strength
The less transparent the signal marker, the more significant the trend.
✅ Customization
Use the inputs to fine-tune sensitivity:
Shorter EMAs: Faster signals
Longer EMAs: Smoother trends
Alpha Period: Adjusts the lookback range for normalization
🟢 Best Practices
NEC is best used in combination with other trend confirmation tools (e.g., price structure, volume, or higher timeframe EMAs).
Avoid relying on signals in extremely low-volume or choppy ranges.
⚠️ Disclaimer
This script is intended for educational purposes only and does not constitute financial advice. Trading involves substantial risk, and you should consult your financial advisor before making any investment decisions.
