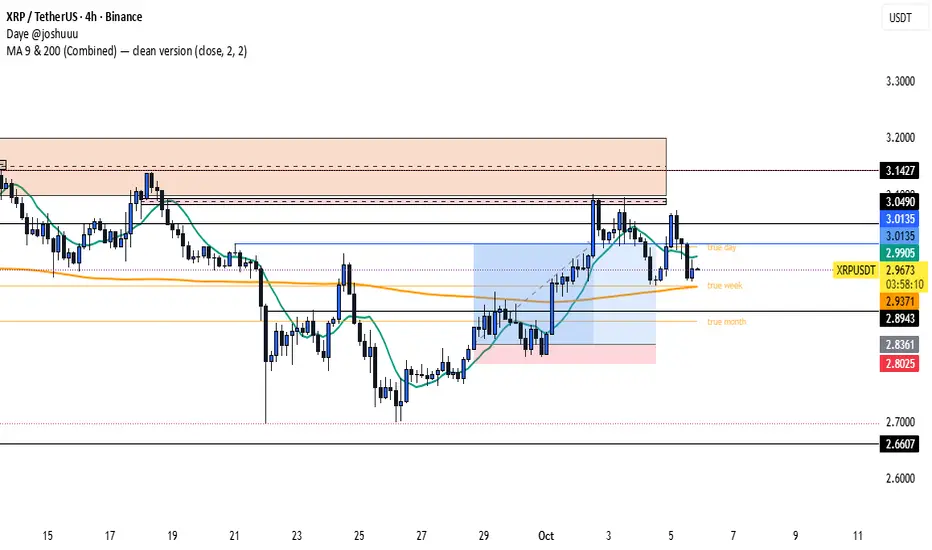
elipli5648 , MA 9 & 200 (Combined) — clean versionThis indicator displays two moving averages on the same chart — the 9-period and 200-period simple moving averages (SMA).
Both lines are customizable in color and line width directly from the settings menu.
Useful for identifying short-term vs long-term trend direction.
Üstel Hareketli Ortalama (EMA)
RED RICHI EMA 34&55This indicator displays two exponential moving averages (EMA 34 & EMA 55) to identify mid-term trend direction.
It also marks crossover points with green and red circles for bullish and bearish trend shifts.

Reversal Wick with Volume, S/R, LogReg Channel & EMAsThis uses a Log Regression channel and tries to identify potential reversals based on price action

Multiple EMA/SMA v6This indicator plots up to eight Exponential Moving Averages (EMAs) and six Simple Moving Averages (SMAs) on the same chart.
Each moving average can be individually customized or disabled by setting its length to 0.
It’s designed for traders who want to visually compare multiple EMAs and SMAs with consistent styling and color-coding.
Key features:
Displays up to 14 customizable EMAs/SMAs.
Adjustable line width and source (e.g., close, open, hlc3).
Simple and performance-optimized structure.
Clean color scheme for quick trend identification.
Usage:
Set any moving average length to 0 to hide it, or adjust lengths and colors to match your strategy.
Ideal for identifying short-, mid-, and long-term trend alignments.

12/21 x 50-100-200 MA - [RZ]👁️ - 12/21 x 50-100-200 MA
A comprehensive moving average overlay indicator designed to identify trend direction and key support/resistance levels using a dual fast/slow MA crossover system combined with three major moving averages.
⛓️ - FEATURES
Dual MA Crossover System: Configurable short (default 12) and long (default 21) period moving averages that change color based on trend direction
Triple Major MAs: 50, 100, and 200 period moving averages displayed in blue, yellow, and red respectively for identifying key market structure levels
Multiple MA Types: Choose from SMA, EMA, DEMA, TEMA, LSMA, WMA, or HMA for all calculations
Customizable Source: Apply the indicator to any price source (close, open, high, low)
Optional Bar Coloring: Visualize trend direction directly on price bars
Built-in Alerts: Automated alerts for trend reversals (Trend Up/Trend Down)
🎮 - HOW TO USE
Bullish Signal: When the short MA crosses above the long MA, both MAs turn green
Bearish Signal: When the short MA crosses below the long MA, both MAs turn red
The 50/100/200 MAs serve as dynamic support/resistance levels and help confirm overall market trend
Use bar coloring for quick visual identification of current trend state
🧰 - OPTIONS
Adjustable lengths for all moving averages
Color customization for bullish/bearish trends
Toggle bar coloring on/off
Select preferred MA calculation method
⚠️ - DISCLAIMER
This indicator is provided for educational and informational purposes only and should not be considered financial advice.
Trading and investing in financial markets involves substantial risk of loss and is not suitable for every investor.
Past performance is not indicative of future results.
The signals and information generated by this indicator do not guarantee profits and may result in losses.
Users should conduct their own research and due diligence, and consult with a qualified financial advisor before making any investment decisions.
The creator of this indicator assumes no responsibility for any financial losses incurred through the use of this tool.
By using this indicator, you acknowledge that you are solely responsible for your trading decisions and their outcomes.
👑 - CREDITS
@profmichaelg for Michael's EMA indicator

BanditExperimental %R and Moving Average Bands. This is just for fun :)
Comment below if you spot a good pattern to trade.

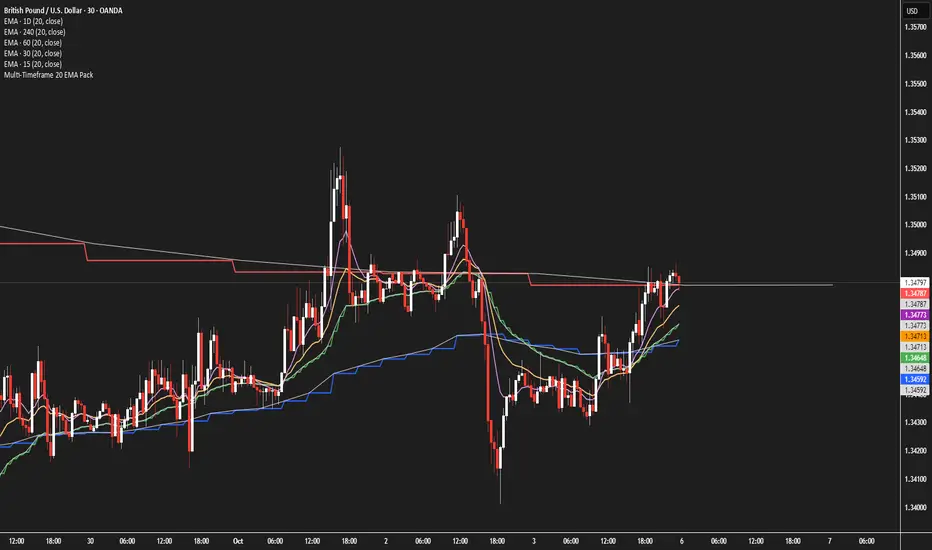
Multi-Timeframe 20 EMA PackMultiple 20 EMA's, each for a different time frame but all on the same chart.
This will help you make sure that the 20EMA has been crossed on all time frames before taking action.
Syed Shams - PSX Dashboard v2.0A compact dashboard that summarizes trend/strength context for Pakistan stocks and indices. It normalizes signals from widely-used tools into a single table so you can triage symbols quickly—no alerts, no buy/sell calls.
What’s inside (columns):
------------------------------
- Scrip / Price / Δ%: Symbol, last price, and percent change vs the previous bar close on the active timeframe (e.g., on 1D it’s vs prior daily close).
- LMH / LML / LWH / LWL: Last Month/Week High & Low. Optional setting to use closed prior M/W bars.
- EMAs 5/9/21/44/100/200: Six mini-squares. Green = price ≥ that EMA, Red = below.
- RS5 / RS21 (vs KSE100): Arrows show out/under-performance over two user-set return windows.
- RSI: Text = RSI value with slope arrow; Blue fill when RSI > its EMA (bullish bias), Red fill when below.
- OBV: Blue/Red fill for OBV vs its EMA; slope arrow uses the global Slope Lookback.
- MACD (M A C D): 4 tiny histogram bars colored by quadrant/acceleration for quick trend read.
- ADX / DMI: ADX value (color-coded: >50 red, 25–50 green, 20–25 orange, <20 red) + slope arrow. +DI / −DI arrows with neutral/green/red fill when +DI dominates/equals/−DI dominates.
- ST 5,1 / ST 8,2: Green/Red dots for SuperTrend state.
- Ichimoku: Cell fill for price vs cloud (above/inside/below). “Laser” dash appears on fresh HH/LL checks.
- BB Zone: Uses BB(20,1/2/3).
• price ≥ U2 → “BB3” (Dark Blue text, Light Blue fill)
• U1 < price < U2 → “BB2” (Dark Blue / Light Blue)
• L1 ≤ price ≤ U1 → “BB1” (Dark Green / Light Green)
• L2 < price < L1 → “BB2” (Dark Red / Light Red)
• price ≤ L2 → “BB3” (Dark Red / Light Red)
Also shows BB3 upper-band slope using the global lookback: “+” widening, “−” contracting, “=” flat.
- Grade (A/B/C/D): Optional composite score; rows sort by score when enabled.
Grade scoring:
------------------
Price ≥ each EMA +1 (max +6) · RS5>idx +2, RS21>idx +1 · OBV>EMA +2, OBV-EMA↑ +1 · RSI>50 +2, RSI>EMA +1, RSI slope↑ +2 / ↓ −2 · MACD hist: ≥0&rising +2, ≥0&falling +1, <0&falling −2, <0&rising −1 · +DI>−DI +1, +DI slope↑ +1 · ADX: >50 −2, 25–50 +2, 20–25 +1, ADX slope↑ +1 · ST(5,1) +1, ST(8,2) +1 · Ichimoku: above cloud +1, below −1, HH “laser” +2 / LL −2 · BB zone: inside BB1 +1; above BB1 +2; BB3 widening +2; shrinking −2; flat 0.
Controls & workflow:
-------------------------
- Universe selector (incl. sector lists and Custom Watchlist).
- Show KSE index rows (off by default).
- Slope Lookback (arrows): one control for RSI/ADX/DMI/OBV/BB3 slope checks.
- Closed bars for LM/LW H/L (off by default).
- Dark Mode (off by default): optimized table contrast for black charts.
- Show Grades toggle.
How to use:
---------------
1) Pick your universe and timeframe.
2) Adjust Slope Lookback (default 1) if you want a stricter/looser slope test.
3) Sort by Grade (on) to find leaders/laggards, then open charts for entries/exits using your own process.
Notes:
--------
- Timeframe-aware: all calculations—including Δ% and RS windows—use the active chart TF.
- Educational research tool. Not investment advice. No alerts.

Aziz — Triple EMA (Golden Entry Retest Boxes)Buy and Sell indicator with Three EMA (21,50,200) + Channel trend
When the 21 EMA crosses Below the 200 EMA and the Channel is down trend it's a SELL
When the 21 EMA crosses Above the 200 EMA and the Channel is Up trend it's a BUY
Work Best for 3 Min Timeframe
Best To use 1:1.5 ratio
Dynamic Supply & Demand with 20,50 & 200 EMADynamic Supply & Demand with 20, 50 & 200 EMA is an intraday trend-following indicator designed for traders who want to identify key support and resistance levels along with trend direction.
Features:
Plots 20, 50, and 200 EMAs to indicate short, medium, and long-term trends.
Calculates supply (resistance) and demand (support) zones dynamically based on recent price action and ATR for better accuracy.
Highlights bullish and bearish conditions using EMA alignment and RSI filter.
Includes a fixed bottom-right watermark to display author identity (@solomonselvam).
Fully compatible with Pine Script v5 and optimized for intraday charts.
How to use:
Use EMA alignment (20 > 50 > 200) and RSI > 55 for bullish setups.
Use EMA alignment (20 < 50 < 200) and RSI < 45 for bearish setups.
Look for price interaction with supply/demand zones for potential entries or exits.
Note: This indicator is best used in combination with proper risk management and price action confirmation.

EMA 20 TirangaEMA 20 high, low and close strategy for intraday. Candles closing above EMAs for bullish moves and candles closing below EMAs for bearish moves. EMA 500 to check overall trend.

MA Dist% Screener [Pineify]MA Distance Screener: Multi-Asset Market Scanner for TradingView
Screen multiple symbols and multiple timeframes on TradingView with the MA Distance Screener. Compare asset prices to flexible moving average types. Visual table view, custom assets, timeframes, and MA types. Supercharge your TradingView screener, optimize your workflow, and catch opportunities across assets in real time.
Key Features
Screen up to 10 custom symbols simultaneously across four configurable timeframes.
Choose from multiple Moving Average types: EMA, SMA, WMA, HMA, RMA, VWMA for flexible market context.
Visualize real-time % distance between price and moving average per asset/timeframe in a clean, color-coded table.
Highly customizable: Set your own symbol list, timeframes, MA length and type.
Alerts for symbol/MA deviations—instantly see overbought/oversold status with intuitive background coloring.
Optimized for crypto, FX, and traditional assets – all asset types supported.
How It Works
The MA Distance Screener acts as a dynamic multi-symbol, multi-timeframe scanner. For each selected symbol and timeframe, it calculates the percentage distance between the latest close price and the selected type of moving average (EMA/SMA/etc.). This is achieved by making secure `request.security` calls per asset/timeframe combination, retrieving updated values for each matrix cell. The computed distance (%) is displayed in a color-coded table: a positive value signals price above the MA (potential trend strength), while negatives indicate price below the MA (potential weakness or retracement). Custom colors highlight extreme overbought/oversold readings for quick visual cues.
Trading Ideas and Insights
Quickly spot assets showing the largest deviation from their moving averages – ideal for mean reversion or trend-following entries.
Identify clusters of assets and timeframes lining up in overbought or oversold states; optimize entries with multi-timeframe confirmation.
Scan the market in one glance—reduce chart-hopping and never miss an opportunity when multiple assets align for signals.
The ability to scan distance-to-MA across assets and periods gives traders a statistical edge, surfacing hidden pivots, breakouts, and mean-reversion trades that single-chart analysis may miss.
How Multiple Indicators Work Together
At its core, this screener allows the trader to configure what gets scanned—pick your top 10 assets and favorite 4 timeframes. With each matrix cell, the selected MA (e.g., 14-period EMA) is recalculated, and the current price's distance (%) from that value is computed. By offering six distinct moving average algorithms (EMA, SMA, RMA, HMA, WMA, VWMA), traders can choose their preferred method, adapting the screener for trend, swing, or mean-reversion style. All values are visualized in a single table, creating a true "market dashboard" effect for real-time cross-asset assessment.
Unique Aspects
True cross-asset, cross-timeframe screening in a unified table—rare for Pine Script indicators.
Full flexibility—customizable list of assets, timeframes, and MA parameters to suit any market/trading plan.
Intuitive color-coding and table display eliminates guesswork, enabling “at-a-glance” screening and rapid decision-making.
Efficient, optimized Pine v6 codebase—minimal lag even with 40+ concurrent streams.
How to Use
Add the indicator to your TradingView chart (overlay: off, use a clean chart).
In the settings panel, enter up to 10 symbols (tickers) you want to screen—crypto, stocks, FX, or indices.
Set the 4 timeframes to scan (e.g., 1m, 5m, 15m, 1h), plus your preferred moving average length and type.
Review the results in the pop-up table, where each cell shows "% Distance" from MA for each symbol/timeframe.
Monitor table background/text color for overbought vs. oversold cues.
Customization
Symbol List: Track any asset by typing its TradingView ticker.
Timeframes: Full freedom to select 4 timeframes per scan, from 1min to monthly.
MA Config: Choose period length and MA algorithm (classic or exotic types).
Color Themes: Easily spot signals with dynamic color backgrounds and customizable thresholds.
Conclusion
The MA Distance Screener is a must-have tool for systematic traders, portfolio managers, and retail chartists seeking a true multi-asset edge. With real-time cross-checking against multiple moving averages and timeframes, it empowers faster, more confident decision-making, while reducing chart fatigue and missed setups.
Unlock new insights, catch broad and hidden opportunities, and optimize your market workflow—all in a single TradingView panel.

Howard Intraday Edge (JH Edge) - (VWAP + EMA9/EMA21 + RSI)Howard Intraday Edge (JH Edge)
A disciplined intraday trading system by J. Howard.
Uses VWAP, EMA 9/21, RSI, and Optional EMA 200 to confirm trends and momentum.
Automatically plots Clean stop-loss and take profit levels. Built for SPY 0DTE-5DTE options, but works on other liquid tickers.
Focus: 1-3 high probability trades/day with tight risk control.
Best used on 1 or 3 minute timeframes.

Multi-Timeframe Multi-EMA StatusMultiple changeable EMAs and Timeframes to tell you if the stock price is above or below them. Can be used on any ticker where EMAs can be used.

Trade PullBack - EMA Pullback System with Auto Risk-Reward# Trade Pull Back - Professional Pullback Trading System
## 📊 Overview
**Trade Pull Back** is a comprehensive pullback trading system that combines trend-following principles with precise entry timing using candlestick pattern confirmation. This indicator is designed for traders who want to enter trending markets at optimal retracement levels with pre-calculated risk-reward ratios.
---
## 🎯 Core Methodology
### Why This System Works
Most traders struggle with two key challenges:
1. **Entering too early** - jumping into trades before the pullback completes
2. **Entering too late** - missing the momentum after the pullback reverses
This system solves both problems by using a **3-Phase Confirmation Process**:
**Phase 1: Trend Identification** → **Phase 2: Pullback Detection** → **Phase 3: Reversal Confirmation**
---
## 🔧 How It Works
### 1. Triple EMA Framework (The Foundation)
Unlike traditional single EMA systems, this indicator uses **3 separate EMAs** with different purposes:
- **EMA Trend (default: 50)** - Determines the overall market direction
- Source: HL/2 for balanced trend reading
- Acts as the primary filter - we only trade in its direction
- **EMA High (default: 20)** - Dynamic resistance in uptrends
- Source: High prices for accurate resistance mapping
- Entry trigger for bullish setups when price closes above it
- **EMA Low (default: 20)** - Dynamic support in downtrends
- Source: Low prices for accurate support mapping
- Entry trigger for bearish setups when price closes below it
**Why 3 EMAs?**
- Single EMA can't distinguish between trend and pullback zones
- Two EMAs (like MACD) don't provide clear entry/exit levels
- Three EMAs create a **channel system** that identifies both trend direction AND optimal entry zones
### 2. Pattern Recognition Engine
The system detects two high-probability reversal patterns:
#### Engulfing Patterns
- **Bullish Engulfing**: Previous bearish candle completely engulfed by bullish candle
- **Bearish Engulfing**: Previous bullish candle completely engulfed by bearish candle
- Validates: Strong momentum reversal with volume confirmation
#### Pin Bar Patterns
- **Bullish Pin Bar (Hammer)**: Long lower wick (60%+ of total range) rejecting lower prices
- **Bearish Pin Bar (Inverted Hammer)**: Long upper wick (60%+ of total range) rejecting higher prices
- Validates: Institutional rejection at support/resistance levels
**Pattern Quality Filter:**
- Body-to-wick ratio must meet minimum standards
- Checks previous candle momentum
- Requires trend alignment before signaling
### 3. Pullback Confirmation System
The system includes **5 mandatory conditions** before generating a signal:
#### For Bullish Signals (BUY):
1. ✅ Close > EMA Trend (uptrend confirmed)
2. ✅ EMA High > EMA Trend AND EMA Low > EMA Trend (healthy trend structure)
3. ✅ Bullish Engulfing OR Bullish Pin Bar (pattern detected)
4. ✅ Close > EMA High (breakout confirmation)
5. ✅ Optional: Low < EMA High (pullback occurred)
#### For Bearish Signals (SELL):
1. ✅ Close < EMA Trend (downtrend confirmed)
2. ✅ EMA High < EMA Trend AND EMA Low < EMA Trend (healthy trend structure)
3. ✅ Bearish Engulfing OR Bearish Pin Bar (pattern detected)
4. ✅ Close < EMA Low (breakdown confirmation)
5. ✅ Optional: High > EMA Low (pullback occurred)
**Additional Filters:**
- **Consecutive Bars Check**: Ensures pullback had momentum (1-5 bearish/bullish bars)
- **Signal Spacing**: Minimum 4 bars between signals to avoid noise
- **Confirmation Delay**: Signal appears only AFTER bar closes (no repainting)
---
## 💰 Automatic Risk-Reward Calculator
### Smart Position Sizing
When a signal triggers, the system automatically calculates:
**For Long Positions:**
- **Entry**: High of signal candle
- **Stop Loss**: Lower of last 2 candle lows (protects against false breakouts)
- **Target 1 (1R)**: Entry + 1x Risk
- **Target 2 (2R)**: Entry + 2x Risk
- **Target 3 (3R)**: Entry + 3x Risk
**For Short Positions:**
- **Entry**: Low of signal candle
- **Stop Loss**: Higher of last 2 candle highs
- **Targets**: Calculated based on risk multiple
### Auto-Remove Feature
Lines and labels automatically disappear when:
- Price hits Stop Loss (trade invalidated)
- Price reaches 3R target (trade complete)
This keeps your chart clean and focuses only on active trades.
---
## 📈 Multi-Timeframe Trend Analysis
### Confluence Trading
The built-in MTF trend box shows trend status across 7 timeframes simultaneously:
- M1, M5, M15, M30, H1, H4, D1
**Color Coding:**
- 🟢 **Green**: Uptrend (Price > EMA Trend AND EMAs aligned bullish)
- 🔴 **Red**: Downtrend (Price < EMA Trend AND EMAs aligned bearish)
- ⚪ **Gray**: No clear trend
**Why This Matters:**
- Trade with higher timeframe trends for better win rate
- Avoid counter-trend trades when all timeframes show same direction
- Identify divergences between timeframes for reversal opportunities
---
## 🎨 Customization Options
### EMA Settings
- Adjust periods for different trading styles (scalping vs swing trading)
- Choose price sources (HL/2, Close, HLC/3) for sensitivity tuning
### Pattern Selection
- Enable/disable Engulfing patterns
- Enable/disable Pin Bar patterns
- Trade only your preferred pattern type
### Signal Filters
- **Require Pullback**: Force pullback condition (stricter entries)
- **Consecutive Bars**: Set momentum requirement (1-5 bars)
### Display Options
- Show/hide EMA lines
- Show/hide signals
- Enable/disable alerts
- Customize Risk-Reward line styles and extensions
---
## 📋 How to Use This Indicator
### Step 1: Identify the Trend
- Wait for price to establish clear direction relative to EMA Trend (50)
- Check MTF box to confirm higher timeframe alignment
### Step 2: Wait for Pullback
- In uptrend: Watch for price to pull back toward EMA High
- In downtrend: Watch for price to pull back toward EMA Low
### Step 3: Pattern Confirmation
- Look for Engulfing or Pin Bar pattern (triangle/diamond markers)
- Ensure pattern forms at or near the EMA High/Low zone
### Step 4: Entry & Risk Management
- Enter when signal appears (after bar closes)
- Use displayed Stop Loss and Take Profit levels
- Consider partial profits at 1R and 2R, let remainder run to 3R
### Step 5: Trade Management
- If price hits SL, lines disappear automatically (trade invalidated)
- If price reaches 3R, lines disappear (trade complete)
- Consider trailing stop after 1R is reached
---
## ⚙️ Recommended Settings
### For Scalping (M1-M5)
- EMA Trend: 20-30
- EMA High/Low: 10-15
- Require Pullback: OFF
- Consecutive Bars: 1
### For Day Trading (M15-H1)
- EMA Trend: 50 (default)
- EMA High/Low: 20 (default)
- Require Pullback: ON
- Consecutive Bars: 2-3
### For Swing Trading (H4-D1)
- EMA Trend: 100-200
- EMA High/Low: 50
- Require Pullback: ON
- Consecutive Bars: 3-5
---
## ✅ What Makes This Script Original
### 1. Systematic Approach
This isn't just a collection of indicators. It's a **complete trading system** with:
- Defined entry rules (5-point confirmation checklist)
- Automatic risk management (SL/TP calculation)
- Trade validation (consecutive bars, signal spacing)
### 2. Smart EMA Framework
The 3-EMA system creates a **dynamic channel** that adapts to market conditions:
- Trend EMA = Direction filter
- High/Low EMAs = Entry/Exit zones
- Together they form a "trade zone" that standard EMAs can't provide
### 3. Pattern Quality Control
Not all Engulfing or Pin Bar patterns are equal. This system:
- Validates body-to-wick ratios
- Checks previous candle momentum
- Requires trend alignment before signaling
### 4. Auto Risk-Reward Management
Most indicators just show signals. This one:
- Calculates exact entry prices
- Places stop loss at optimal location (lower of 2 lows)
- Projects 3 profit targets based on risk
- Auto-removes when trade is complete/invalidated
### 5. No Repainting
- All signals appear AFTER bar closes
- No future data leaking
- What you see in backtest = what you get in real-time
---
## 🚨 Alerts
Built-in alerts notify you when:
- Bullish signal confirmed
- Bearish signal confirmed
Alerts fire once per bar (no spam) and only after bar closes (no false alerts).
---
## 📊 Best Practices
### ✅ DO:
- Trade in direction of higher timeframe trends
- Wait for full confirmation (all 5 conditions met)
- Use proper position sizing (1-2% risk per trade)
- Let winners run to at least 2R
### ❌ DON'T:
- Trade against major trend on MTF box
- Enter before signal bar closes
- Ignore the Stop Loss level
- Overtrade - respect the 4-bar minimum spacing
---
## 🔍 Limitations
This indicator is a **tool**, not a crystal ball:
- No indicator wins 100% of the time
- False signals occur in choppy/ranging markets
- Best results in trending conditions
- Requires proper risk management
- Should be combined with fundamental analysis and market context
---
## 📚 Educational Value
This script teaches:
- How to combine trend following with mean reversion
- Pattern recognition and validation
- Risk-reward ratio calculation
- Multi-timeframe analysis
- Proper trade entry timing
---
## 🎓 Credits & Disclaimer
**Original Work**: All code written from scratch
**Methodology**: Based on classical technical analysis principles (EMA crossovers, candlestick patterns, support/resistance)
**Disclaimer**: This indicator is for educational purposes. Past performance does not guarantee future results. Always practice proper risk management.
---
## 📞 Support
If you find this indicator helpful:
- Leave a review
- Share with fellow traders
- Provide feedback for improvements
**Note**: This is a closed-source script to protect the proprietary signal logic and filtering algorithms. The description above provides comprehensive understanding of the methodology without revealing exact implementation details.
---
**Version**: 1.0
**Pine Script Version**: 5
**Type**: Indicator (Overlay)
**Category**: Trend Following + Pattern Recognition
---
*Happy Trading! 🚀*
# 🇹🇭 คู่มือภาษาไทย / Thai Guide
# Trade Pull Back - คู่มือภาษาไทย
## 📊 ภาพรวม
**Trade Pull Back** เป็นระบบเทรด Pullback ที่ผสมผสานการเทรดตามเทรนด์กับการจับจังหวะเข้าออเดอร์ด้วย Candlestick Pattern พร้อมคำนวณ Risk-Reward อัตโนมัติ
---
## 🎯 หลักการทำงาน
### ทำไมระบบนี้ได้ผล?
แก้ปัญหา 2 ข้อหลักของเทรดเดอร์:
1. **เข้าเร็วเกินไป** - เข้าก่อน Pullback เสร็จ
2. **เข้าช้าเกินไป** - พลาดโมเมนตัมหลังกลับตัว
**วิธีแก้**: ใช้กระบวนการยืนยัน 3 ขั้นตอน
- **ขั้น 1**: ระบุเทรนด์ → **ขั้น 2**: ตรวจจับ Pullback → **ขั้น 3**: ยืนยันการกลับตัว
---
## 🔧 ส่วนประกอบหลัก
### 1. ระบบ EMA 3 เส้น
ต่างจาก EMA ทั่วไป ระบบนี้ใช้ 3 เส้นที่มีหน้าที่แยกกัน:
- **EMA Trend (50)** - กำหนดทิศทางเทรนด์หลัก
- **EMA High (20)** - แนวต้านไดนามิก (สำหรับ Buy)
- **EMA Low (20)** - แนวรับไดนามิก (สำหรับ Sell)
**ทำไมต้อง 3 เส้น?**
- 1 เส้น = แยกเทรนด์กับ Pullback ไม่ได้
- 2 เส้น = ไม่มีจุด Entry/Exit ชัดเจน
- 3 เส้น = สร้าง Channel ที่บอกทั้งเทรนด์และโซนเข้าออเดอร์
### 2. ตรวจจับ Pattern
ระบบตรวจจับ 2 Pattern หลัก:
**Engulfing (แท่งกลืน)**
- Bullish: แท่งเขียวกลืนแท่งแดงทั้งหมด
- Bearish: แท่งแดงกลืนแท่งเขียวทั้งหมด
**Pin Bar (แท่งหาง)**
- Bullish: หางล่างยาว 60%+ ของช่วงทั้งหมด
- Bearish: หางบนยาว 60%+ ของช่วงทั้งหมด
### 3. เงื่อนไขยืนยันสัญญาณ (5 ข้อ)
**สัญญาณ Buy:**
1. ✅ ราคาปิด > EMA Trend (เทรนด์ขาขึ้น)
2. ✅ EMA High และ Low เหนือ EMA Trend (โครงสร้างดี)
3. ✅ เกิด Bullish Engulfing หรือ Pin Bar
4. ✅ ราคาปิด > EMA High (ยืนยัน Breakout)
5. ✅ ตัวเลือก: มี Pullback มาแตะ EMA High
**สัญญาณ Sell:**
1. ✅ ราคาปิด < EMA Trend (เทรนด์ขาลง)
2. ✅ EMA High และ Low ใต้ EMA Trend (โครงสร้างดี)
3. ✅ เกิด Bearish Engulfing หรือ Pin Bar
4. ✅ ราคาปิด < EMA Low (ยืนยัน Breakdown)
5. ✅ ตัวเลือก: มี Pullback มาแตะ EMA Low
**ตัวกรองเพิ่มเติม:**
- ต้องมีแท่งติดกัน 1-5 แท่ง (กำหนดได้)
- ห่างสัญญาณก่อนหน้าอย่างน้อย 4 แท่ง
- สัญญาณปรากฏหลังแท่งปิดเท่านั้น (ไม่ Repaint)
---
## 💰 คำนวณ Risk-Reward อัตโนมัติ
เมื่อสัญญาณเกิด ระบบคำนวณให้อัตโนมัติ:
**Long Position:**
- Entry = High ของแท่งสัญญาณ
- Stop Loss = Low ที่ต่ำกว่าของ 2 แท่งล่าสุด
- Target = 1R, 2R, 3R
**Short Position:**
- Entry = Low ของแท่งสัญญาณ
- Stop Loss = High ที่สูงกว่าของ 2 แท่งล่าสุด
- Target = 1R, 2R, 3R
**ลบอัตโนมัติ:** เส้นหายเมื่อราคาชน SL หรือถึง 3R
---
## 📈 กล่องเทรนด์หลาย Timeframe
แสดงเทรนด์พร้อมกัน 7 Timeframe:
- M1, M5, M15, M30, H1, H4, D1
**สีแสดงผล:**
- 🟢 เขียว = Uptrend
- 🔴 แดง = Downtrend
- ⚪ เทา = ไม่มีเทรนด์
**ประโยชน์:** เทรดตาม Timeframe ใหญ่เพื่อเพิ่ม Win Rate
---
## 📋 วิธีใช้งาน (5 ขั้นตอน)
1. **ระบุเทรนด์** - เช็คราคาเทียบกับ EMA Trend และกล่อง MTF
2. **รอ Pullback** - เฝ้าราคา Pullback มาที่ EMA High/Low
3. **เช็ค Pattern** - มองหาลูกศรสามเหลี่ยม (Engulfing) หรือเพชร (Pin Bar)
4. **เข้าออเดอร์** - เข้าเมื่อสัญญาณปรากฏ ใช้ SL/TP ที่แสดง
5. **จัดการเทรด** - เส้นจะหายเองเมื่อชน SL หรือถึง 3R
---
## ⚙️ การตั้งค่าแนะนำ
**Scalping (M1-M5)**
- EMA Trend: 20-30
- EMA High/Low: 10-15
- Require Pullback: ปิด
**Day Trading (M15-H1)**
- EMA Trend: 50 (ค่าเริ่มต้น)
- EMA High/Low: 20 (ค่าเริ่มต้น)
- Require Pullback: เปิด
**Swing Trading (H4-D1)**
- EMA Trend: 100-200
- EMA High/Low: 50
- Require Pullback: เปิด
---
## ✅ จุดเด่นที่แตกต่าง
1. **เป็นระบบสมบูรณ์** - ไม่ใช่แค่รวม Indicator
2. **EMA 3 เส้นสร้าง Channel** - บอกทั้งเทรนด์และโซนเข้า
3. **ตรวจสอบคุณภาพ Pattern** - ไม่ใช่ทุก Pattern ที่ให้สัญญาณ
4. **คำนวณ RR อัตโนมัติ** - วาง SL/TP ให้เลย
5. **ไม่ Repaint** - สัญญาณปรากฏหลังแท่งปิดเท่านั้น
---
## 📊 ควรทำ / ไม่ควรทำ
### ✅ ควรทำ:
- เทรดตามเทรนด์ Timeframe ใหญ่
- รอยืนยันครบ 5 เงื่อนไข
- เสี่ยง 1-2% ต่อเทรด
- ปล่อยกำไรไปอย่างน้อย 2R
### ❌ ไม่ควรทำ:
- เทรดทวนเทรนด์ในกล่อง MTF
- เข้าก่อนแท่งปิด
- ละเลย Stop Loss
- เทรดบ่อยเกินไป
---
## 🔍 ข้อจำกัด
- ไม่มี Indicator ไหนชนะ 100%
- สัญญาณผิดพลาดเกิดในตลาด Sideways
- ผลดีสุดในตลาดที่มีเทรนด์ชัด
- ต้องใช้ Money Management
- ควรดูปัจจัยพื้นฐานประกอบ
---
## 🎓 คำเตือน
**Disclaimer**: อินดิเคเตอร์นี้สำหรับการศึกษา ผลในอดีตไม่รับประกันอนาคต ใช้ Risk Management ที่เหมาะสมเสมอ
---
**เวอร์ชั่น**: 1.0
**Pine Script**: v5
**ประเภท**: Indicator (Overlay)
*Happy Trading! 🚀*
## Screenshots
**Bearish Signals with Risk-Reward:**
! (drive.google.com)
**Bullish Signal with Risk-Reward:**
! (drive.google.com)
**Multi-Timeframe Trend Box:**
! (drive.google.com)
**Settings Panel:**
! (drive.google.com)

FibPulse144 [CHE] FibPulse144 — ADX-gated 13/21 crossover with 144-trend regime and closed-bar labels
Summary
FibPulse144 combines a fast moving-average crossover with a 144-period trend regime and an ADX strength gate. Signals are confirmed on closed bars only and drawn as labels on the price chart, while an ADX line in a separate pane provides context. Color gradients are derived from normalized ADX, so visual intensity reflects trend strength without changing the underlying logic. The approach reduces false flips during weak conditions and keeps entries aligned with the dominant trend.
Motivation: Why this design?
Traditional crossover signals can flip repeatedly during sideways phases and often trigger against the higher-time regime. By requiring alignment with a slower trend proxy and by gating entries through a rising ADX condition, FibPulse144 favors structurally cleaner transitions. Gradient coloring communicates strength visually, helping users temper aggressiveness without additional indicators.
What’s different vs. standard approaches?
Baseline: Classic dual-MA crossover with unconditional signals.
Architecture differences:
Two-bar regime confirmation against a 144-period trend average.
Pending-signal logic that waits for regime and optional ADX approval.
ADX strength gate using the prior reading relative to a user threshold and earlier value.
Gradient colors scaled by an ADX window with gamma controls.
Price-chart labels enforced via overlay on an otherwise pane-based indicator.
Practical effect: Fewer signals during weak or choppy conditions, labels that appear only after a bar closes, and color intensity that mirrors trend quality.
How it works (technical)
The script computes fast and slow moving averages using the selected method and lengths. A separate 144-length average defines the regime using a two-bar confirmation above or below it. Crossovers are observed on the previous bar to avoid intrabar ambiguity; once a prior crossover is detected, it is stored as pending. A pending long requires regime alignment and, if enabled, an ADX condition based on the previous reading being above the threshold and greater than an earlier reading. The state machine holds neutral, long, or short until an exit condition or ADX reset is met. ADX is normalized within a user window, scaled with gamma, and mapped to up and down color palettes to render gradients. Labels on the price panel are forced to overlay, while the ADX line and threshold guide remain in a separate pane.
Parameter Guide
Source — Input data for all calculations. Default: close. Tip: keep consistent with your chart.
MA Type — EMA or SMA. Default: EMA. EMA reacts faster; SMA is smoother.
Fast / Slow — Fast and slow lengths for crossover. Defaults: 13 and 21. Shorter reacts earlier; longer reduces noise.
Trend — Regime average length. Default: 144. Larger values stabilize regime; smaller values increase sensitivity.
Use 144 as trend filter — Enables regime gating. Default: true. Disable to allow raw crossovers.
Use ADX filter — Requires ADX strength. Default: true. Disable to allow signals regardless of strength.
ADX Len — DI and ADX smoothing length. Default: 14. Higher values smooth strength; lower values react faster.
ADX Thresh — Minimum strength for signals. Default: 25. Raise to reduce flips; lower to capture earlier moves.
Entry/Exit labels (price) — Price-panel labels on state changes. Default: true.
Signal labels in ADX pane — Small markers at the ADX value on entries. Default: true.
Label size — tiny, small, normal, large. Default: normal.
Enable barcolor — Optional candle tint by regime and gradient. Default: false.
Enable gradient — Turns on ADX-driven color blending. Default: true.
Window — Bars used to normalize ADX for colors. Default: 100; minimum: 5.
Gamma bars / Gamma plots — Nonlinear scaling for bar and line intensities. Default: 0.80; between 0.30 and 2.00.
Gradient transp (0–90) — Transparency for gradient colors. Default: 0.
MA fill transparency (0–100) — Fill opacity between fast and slow lines. Default: 65.
Palette colors (Up/Down) — Dark and neon endpoints for up and down gradients. Defaults as in the code.
Reading & Interpretation
Fast/Slow lines: When the fast line is above the slow line, the line and fill use the long palette; when below, the short palette is used.
Trend MA (144): Neutral gray line indicating the regime boundary.
Labels on price: “LONG” appears when the state turns long; “SHORT” when it turns short. Labels appear only after the bar closes and conditions are satisfied.
ADX pane: The ADX line shows current strength. The dotted threshold line is the user level for gating. Optional small markers indicate entries at the ADX value.
Bar colors (optional): Candle tint intensity reflects normalized ADX. Higher intensity implies stronger conditions.
Practical Workflows & Combinations
Trend following: Use long entries when fast crosses above slow and price has held above the trend average for two bars, with ADX above threshold. Mirror this for shorts below the trend average.
Exits and stops: Consider reducing exposure when price closes on the opposite side of the trend average for two consecutive bars or when ADX fades below the threshold if the ADX filter is enabled.
Structure confirmation: Combine with higher-timeframe structure such as swing highs and lows or a simple market structure overlay for confirmation.
Multi-asset/Multi-TF: Works across liquid assets. For lower timeframes, consider a slightly lower ADX threshold; for higher timeframes, maintain or raise the threshold to avoid unnecessary flips.
Behavior, Constraints & Performance
Repaint/confirmation: Signals are based on previous-bar crossovers and are confirmed on bar close. No higher-timeframe or security calls are used. Intrabar markers are not relied upon.
Resources: The script declares `max_bars_back` of 2000, uses no loops or arrays, and employs persistent variables for pending signals and state.
Known limits: Crossover systems can lag after sudden reversals. During tight ranges, disabling the ADX filter may increase flips; keeping it enabled may skip early transitions.
Sensible Defaults & Quick Tuning
Starting point: EMA, 13/21/144, ADX length 14, ADX threshold 25, gradients on, barcolor off.
Too many flips: Increase ADX threshold or length; increase trend length; consider SMA instead of EMA.
Too sluggish: Lower ADX threshold slightly; shorten fast and slow lengths; reduce the trend length.
Colors overpowering: Increase gradient transparency or reduce gamma values toward one.
What this indicator is—and isn’t
This is a visualization and signal layer that combines crossover, regime, and strength gating. It does not predict future movements, manage risk, or execute trades. Use it alongside clear structure, risk controls, and a defined position management plan.
Disclaimer
The content provided, including all code and materials, is strictly for educational and informational purposes only. It is not intended as, and should not be interpreted as, financial advice, a recommendation to buy or sell any financial instrument, or an offer of any financial product or service. All strategies, tools, and examples discussed are provided for illustrative purposes to demonstrate coding techniques and the functionality of Pine Script within a trading context.
Any results from strategies or tools provided are hypothetical, and past performance is not indicative of future results. Trading and investing involve high risk, including the potential loss of principal, and may not be suitable for all individuals. Before making any trading decisions, please consult with a qualified financial professional to understand the risks involved.
By using this script, you acknowledge and agree that any trading decisions are made solely at your discretion and risk.
Do not use this indicator on Heikin-Ashi, Renko, Kagi, Point-and-Figure, or Range charts, as these chart types can produce unrealistic results for signal markers and alerts.
Best regards and happy trading
Chervolino

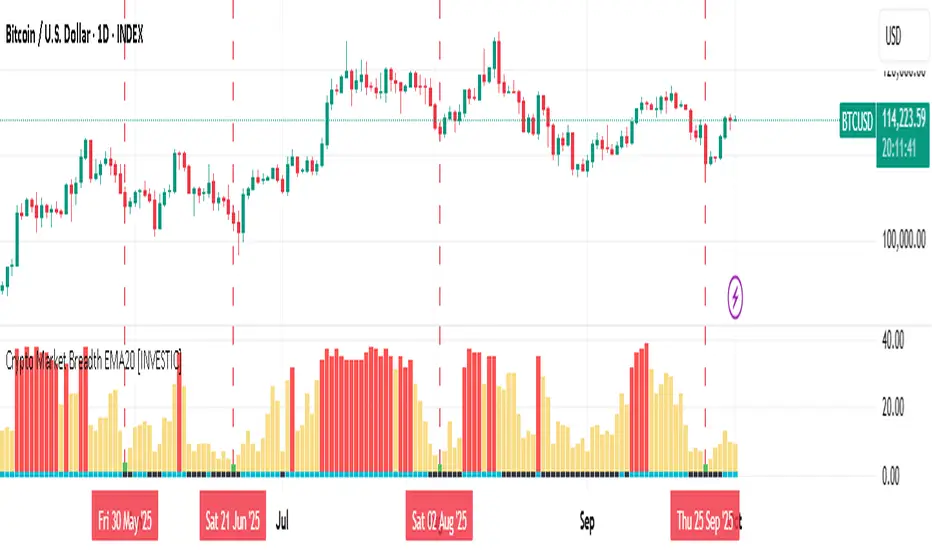
Crypto Market Breadth EMA20 [INVESTIC]This indicator is designed to provide a broad overview of the cryptocurrency market’s health by measuring how many of the top 40 crypto assets are trading above a user-selected moving average (MA). Instead of focusing on just Bitcoin, it evaluates the market as a whole, making it useful for spotting market extremes such as panic-driven selloffs or overheated rallies.
The concept is inspired by Market Breadth Analysis often used in stock markets, but here it is specifically adapted to the crypto space, offering traders a unique perspective on overall sentiment and strength.
How to Interpret the Indicator
The indicator consists of two main components:
Main Histogram (Market Breadth)
Bottom Line (Bitcoin’s Position)
1. Main Histogram (Market Breadth)
🟢 Green Bars: Triggered when fewer than 5 cryptocurrencies are trading above their MA. This often reflects a Panic Sell situation, where extreme fear dominates the market. Such capitulation zones historically provide higher probabilities of price rebounds in both Bitcoin and altcoins.
🔴 Red Bars: Triggered when 32 or more cryptocurrencies trade above their MA. This suggests the market is becoming overheated, with most assets already in strong rallies. While this may confirm a strong bullish trend, it can also indicate a potential market top and serves as a cautionary signal.
🟡 Yellow Bars: Represent neutral or consolidating market conditions.
2. Bottom Line (Bitcoin’s Position)
🔵 Aqua: Bitcoin is above the selected MA.
⚫️ Black: Bitcoin is below the selected MA.
This additional layer helps traders align Bitcoin’s individual trend with the broader crypto market condition.
Customization and Settings
This indicator is fully customizable to suit different trading strategies:
Timeframe: Can be applied to any timeframe, from intraday to long-term charts.
Moving Average (MA): Users can select the type (EMA, SMA, WMA) and adjust the length.
For beginners, the default setting of EMA 20 is recommended as a baseline. More experienced traders are encouraged to experiment with different MA types and lengths to better match their personal strategies.
Key Advantages and Uniqueness
Unlike standard trend indicators, this tool focuses on breadth across multiple assets rather than a single price.
Adaptation of stock market breadth techniques specifically for cryptocurrencies.
Helps identify extreme conditions (capitulation or overheated rallies) that are often hidden when only looking at Bitcoin or a single indicator.
Disclaimer
This indicator is for educational and research purposes only. It does not constitute financial advice. Always perform your own analysis and risk management before making trading or investment decisions.
EMA 50/200/100 [NevoxCore]⯁ OVERVIEW
EMA 50/200/100 is a clean EMA trio for trend mapping.
It highlights the classic 50/200 bias, keeps a constant EMA-100 anchor in white, plots cross dots, and can mark the first pullback back to a target EMA within an ATR tolerance.
Solid bias bar coloring (Nevox pink/orange or classic green/red) and compact visuals make it fast and reliable with no repainting.
⯁ HOW IT WORKS
Calculates Fast EMA 50, Slow EMA 200, and an always-on EMA 100 (white).
Bias = Fast vs. Slow: Fast > Slow → long regime; Fast < Slow → short regime.
Cross dots appear at confirmed 50/200 crosses (once per bar close).
First Pullback: after a cross, the script arms a window and marks the first return to the chosen EMA (100 or Fast) within ATR × tolerance.
Bar coloring is solid by regime (pink/orange by default, classic green/red when enabled).
No lookahead; signals confirm on bar close.
⯁ KEY FEATURES
• EMA 50/200 with EMA-100 anchor (always visible, white)
• Cross Up/Down dots (style-configurable)
• First Pullback marker (toggle) with ATR tolerance & window
• Solid bias bar coloring (Nevox or classic)
• Optional bias fill between Fast/Slow
• Minimal 1-cell HUD (OFF by default)
• Ready-made alerts with clean prefixes
⯁ SETTINGS (quick)
Visual: Classic colors toggle; Bias Fill (ON); Fill Transparency (85); Bar Color (solid, ON; auto-disabled when Classic is ON).
Core: Source = Close; EMA Fast = 50; EMA Slow = 200.
Pullback: Show marker (ON); Target EMA = EMA 100; Tolerance × ATR = 0.5; Max Bars After Cross = 40; ATR Length = 14.
HUD: Mini HUD OFF; Position selector.
Status Line: OFF by default (optional EMA values).
⯁ ALERTS (built-in)
• Cross Up (Fast above Slow) — confirmed at bar close
• Cross Down (Fast below Slow) — confirmed at bar close
• First Pullback LONG — first return to target after long cross
• First Pullback SHORT — first return to target after short cross
Prefix: EMA and message includes {{ticker}} {{interval}} @ {{close}}.
Suggested: set TradingView alerts to Once Per Bar Close.
⯁ HOW TO USE
• Read trend quickly: 50 above 200 with a rising 100 = healthy long bias.
• Use the First Pullback to time entries after a cross (default target = EMA 100).
• Tune Tolerance × ATR by symbol/TF; 0.3–0.7 is a good start.
• Keep charts clean: bias fill + barcolor ON; switch to Classic for green/red if preferred.
⯁ WHY IT’S DIFFERENT
It preserves the classic 50/200 logic but adds a consistent EMA-100 anchor, a single, one-shot pullback detector, and clean bias bars — all in a lightweight overlay with no repaint tricks.
⯁ DISCLAIMER
Backtest and paper-trade before using live. Not financial advice. Performance depends on market, timeframe, and parameters.

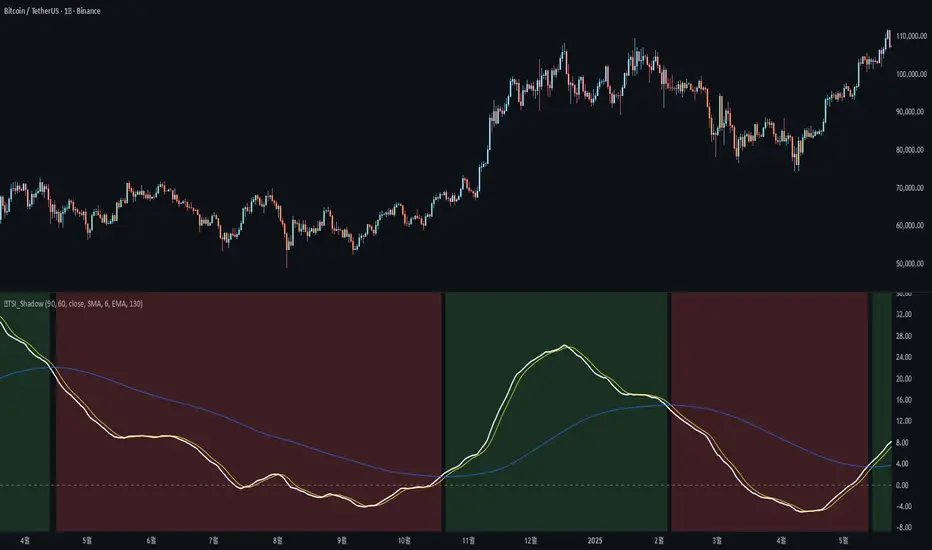
🐬TSI_ShadowAdded the following features to the original TSI Shadow indicator by Daveatt
- Candle color on/off
=> Displays the current trend status by coloring the chart candles.
- Background color on/off
=> Displays the current trend status by coloring the chart background.
- Conservative signal processing based on the zero line on/off
=> When calculating the trend with the TSI, a bullish trend is only confirmed above the zero line, and a bearish trend is only confirmed below the zero line.
- Conservative signal processing based on full signal alignment on/off
=> This enhances the original trend calculation (bullish when TSI and Fast MA are above Slow MA). With this option, the trend is determined by the specific alignment of all three lines: TSI, Fast MA, and Slow MA.
기존 Daveatt 유저가 개발한 TSI Shadow 에서 아래 기능을 추가 하였습니다.
- 캔들 색상 on/off
=> 캔들에 추세의 상태를 색상으로 나타냅니다.
- 배경 색상 on/off
=> 배경에 추세의 상태를 색상으로 나타냅니다.
- 0선 기준으로 신호 발생 보수적 처리 on/off
=> TSI로 추세를 계산할 때 0선 위에서는 매수추세, 0선 아래서는 매도추세를 계산합니다.
- 전체 배열 신호 발생 보수적 처리 on/off
=> TSI선과, FastMA 선이 SlowMA 위에 있을때 상승추세, 반대면 하락추세를 나타내 주던 계산식에서 TSI-FastMA-SlowMA 세가지 선의 배열 상태로 추세를 나타냅니다.
34 EMA Cross Alert (Once per sequence)This script is used when 5-12 EMA is above 34-50 EMA and if price corrects to 34-50 cloud and bounces i.e. price crosses below 34 EMA and then cross above 34 EMA, it will trigger alert.
3MA/EMA Alerts指标名称(中文/英文)
中文名:多均线趋势指标(带上穿与金叉提醒)
英文名:Multi MA/EMA Trend Indicator (with Price & Golden Cross Alerts)
指标功能介绍(中文)
多均线趋势指标(带上穿与金叉提醒) 是一个可自定义的均线工具,适用于趋势分析和交易信号提醒。
核心功能:
多均线显示
默认显示 EMA20,EMA80/200 可选择显示
每条均线可独立选择 EMA 或 SMA
自定义颜色和线宽
价格上穿均线提醒
当价格向上突破任意开启的均线时触发提醒
可用于捕捉短线趋势启动点
金叉提醒
当短期均线向上穿过中长期均线时触发提醒
可用于捕捉潜在的趋势反转或加速
中文 UI
参数和提醒信息均为中文,便于快速理解和使用
适用场景
趋势确认
趋势反转捕捉
短线入场和长期持仓参考
Indicator Description (English)
Multi MA/EMA Trend Indicator (with Price & Golden Cross Alerts) is a customizable moving average tool for trend analysis and trading alerts.
Key Features:
Multiple Moving Averages
Default display: EMA20; EMA80/200 optional
Each MA can be set as EMA or SMA individually
Customizable colors and line widths
Price Cross Alerts
Alerts when price crosses above any active MA
Helps identify short-term trend initiation points
Golden Cross Alerts
Alerts when a short-term MA crosses above a mid/long-term MA
Useful for detecting trend acceleration or reversal signals
User-Friendly Interface
Parameters and alerts are labeled in Chinese (can be translated)
Applications
Trend confirmation
Trend reversal detection
Short-term entries and long-term position guidance

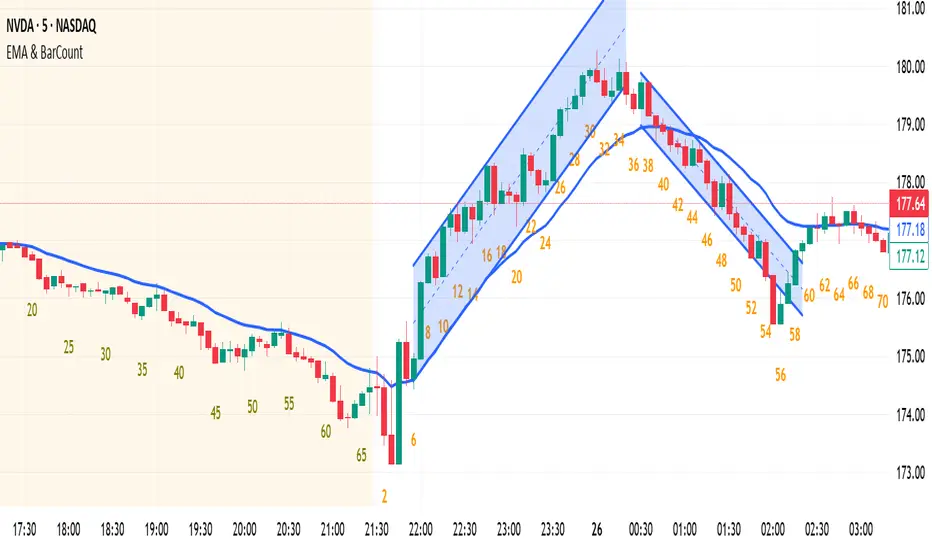
EMA & BarCountNothing. EMA & Bar Count
Nothing. EMA & Bar Count
Nothing. EMA & Bar Count
Nothing. EMA & Bar Count
Nothing. EMA & Bar Count
Thanks .
Bollinger Bands with 4 Moving AveragesCombines Bollinger Bands (BB) with up to four optional Moving Averages (MA) to read volatility, trend direction, and dynamic support–resistance in one overlay.
How It Works
BB: basis = MA(length, type) with standard deviation mult. upper = basis + dev, lower = basis − dev.
MA1–MA4: additional averages you can toggle (default only MA4/200 enabled).
Key Features
Flexible basis MA type for BB: SMA / EMA / RMA (Wilder) / WMA / VWMA.
Four optional MAs with independent length, color, and width (defaults: 7, 25, 99, 200; only 200 on by default).
Offset to shift BB for visual testing.
Overlay on price with shaded band between Upper–Lower.
Inputs & Defaults
BB Length = 20, StdDev = 2.0, Source = close.
Basis MA Type = SMA.
MA4 active (200), MA1–MA3 off (7/25/99 ready).
Offset = 0.
Practical Use
Use BB for volatility context: squeeze → potential breakout; expansion → strong trend.
Treat Basis / Upper / Lower as dynamic levels:
Pullbacks to Basis often become decision zones in trends.
Upper/Lower touches = relative extremes.
Add MA4(200) for primary bias; enable MA1–MA3 for finer timing.
Typical behavior:
Price > MA200 and rising basis → bullish bias; watch pullbacks to basis/MA25-like zones.
Price < MA200 and falling basis → bearish bias; watch rejections at basis/MAs.
Common Signals (not financial advice)
Breakout + BB expansion confirms momentum.
Squeeze + basis break can preface volatility expansion.
Confluence: Lower touch + fast MA in uptrends → mean-reversion setups; inverse for downtrends.
Notes
MA1–MA4 are SMA in the code; BB basis follows the selected MA type.
Test across timeframes; tune length and mult to the asset.
Disclaimer
Visual tool only. Combine with risk management, multi-timeframe confirmation, and a tested plan.
