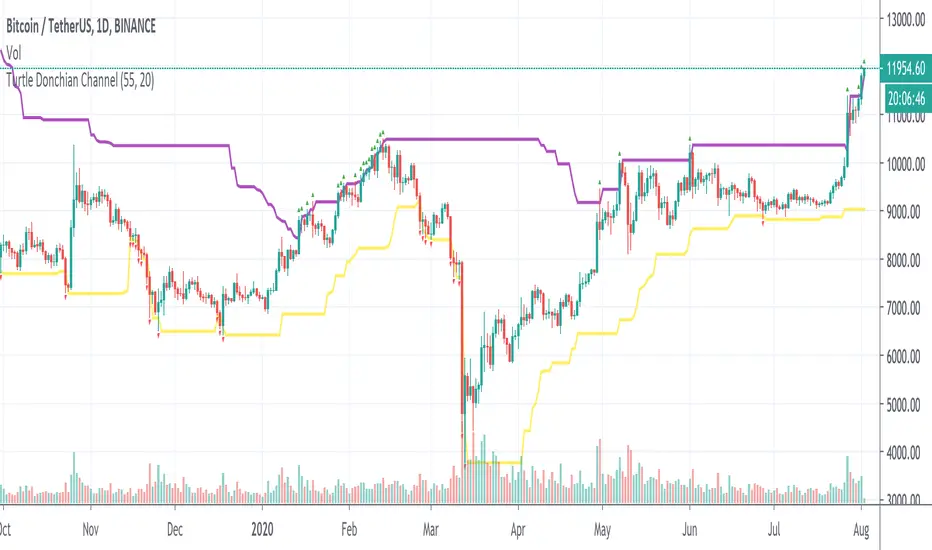
Turtle Donchian ChannelDonchian channel with Turtle trading style: buy long when price is higher than high 20 candles (green up arrow), and sell short when price is lower than low 10 candles (red down arrow).
Donchian Kanalları (DC)
[RS]Standardized Trend Mapnothing excessively new here..
a map of standardized trend over multiple lengths, extra parameter for smoothing the input source(close) will remove noise.

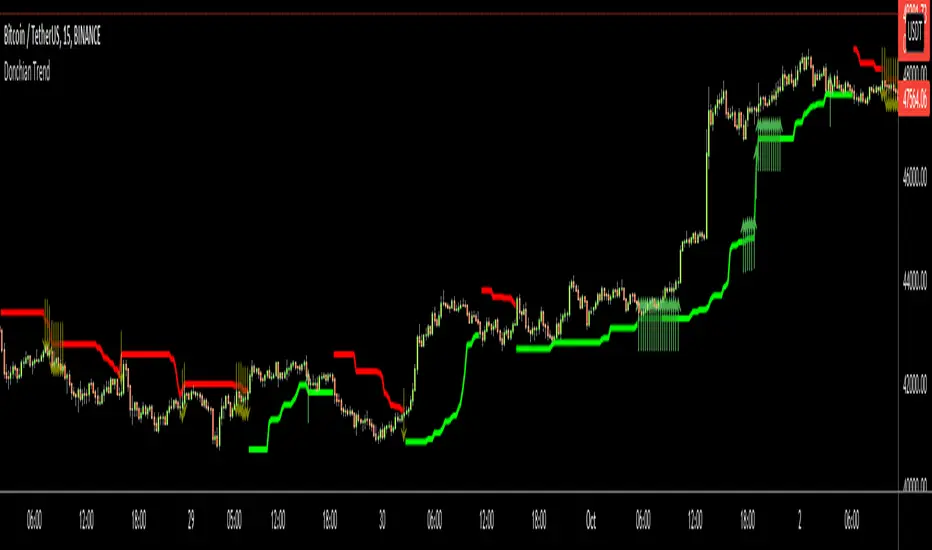
Donchian Trend RibbonHello Traders,
I think you all know Donchian Channels. so I am not going to write about it.
With this indicator I tried to create Donchian Trend Ribbon by using Donchian Channels.
How it works ?
- it calculates main trend direction by using the length that is user-defined. so you can change it as you wish
- then it calculates trend direction for each 9 lower lengths. if you set the length = 20 then the lengths are 19, 18,...11
- and it checks if the trend directions that came from lower lengths is same or not with main trend direction.
- it changes the trend color of the ribbon.
-
Warning: Entry points may also represents trend reversal. So you should use stoploss line if you decide to take buy/sell positions.
P.S. I didn't backtest it, it's non-repainting, it should be used educational purposes only.
Published by user request. You may want to see following one:
Enjoy!

Donchian TrendHello All,
I think all of you knows Donchian Channels . so I am not going to write about it.
With this indicator I tried to create Trend Lines by using Donchian Channel upper/lower bands. I tried add possible entry levels as well.
How it works ?
- it calculates main trend direction by using the length that is user-defined. so you can change it as you wish
- then it calculates trend direction for 9 lower lengths. if you set the length = 20 then the lengths are 19, 18,...11
- and it checks if the trend directions that came from lower lengths is same or not with main trend direction.
- it changes the trendline color. lighter trend line means stonger trend, darker trend lines means entry points or possible trend reversal.
- it puts entry points by using trend directions that were created by using lower lengths. it gets entry points if high/low touches main trend line as well.
Warning: Arrows are entry points but it may also represents trend reversal. So you should use stoploss line if you decide to take buy/sell positions.
P.S. I didn't backtest it, it's non-repainting, it should be used educational purposes only . I believe it can be improved, so I am open for new ideas to improve it ;)
Enjoy!
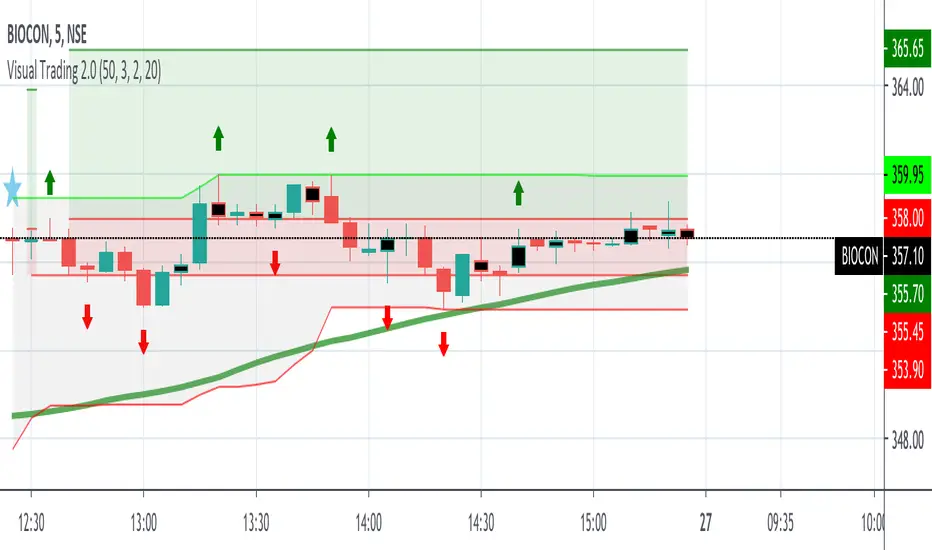
VT SMA 50 DC with FractalsBuying or Selling levels are identified with SMA 50 along with Fractals for breakouts and reversals.
SMA will be green when the trend is Bullish
SMA will be red when the trend is Bearish
The color is set GREEN and RED for Bullish and Bearish trend
Donchian Channels with Auto Fibonacci RetracementRichard Donchian created Donchian Channels, which is a type of moving average indicator and a look-alike of other support and resistance trading indicators like Bollinger Bands.
Donchian Channels has a simple plotting of highest high and lowest low of the last “n” periods.
The “n” periods is based on the trader’s choice, who can select the period according to their requirements ranging from a day, hour and minutes etc.
Traders use Donchian Channels to understand the support and resistance levels.
Donchian Channels is a popular indicator for determining volatility in market prices.
The channels are wider when there are heavy price fluctuations and narrow when prices are relatively flat.
Generally, investors use 20-periods with the Donchian Channels as the default trading setting, but this value can be tweaked based on your trading style.
Donchian channels are mainly used to identify the breakout of a stock or any traded entity enabling traders to take either long or short positions.
Traders can take a long position, if the stock is trading higher than the Donchian channels “n” period and book their profits/short the stock if it is trading below the DC channels “n” period.
The middle band is the average of the upper and lower bands.
The middle band in Donchian channels could also be used as a breakout indicator.
If the stock rises above the middle band of the Donchian channels, then you can open a long position.
On the contrary, if the stock is trading below the middle band of the Donchian channel, then a trader can open a short position.
Combining Donchian Channel trading strategies with other trading strategies might decrease the false entry/exit signals and give a clearer picture of trading opportunities.
If you start to trade a choppy market on an intraday basis, you will be overloaded with false signals.
So, what I noticed is that in order for things to become clearer, we just need to increase the time frame.
Where Donchian Channels Can Fail You
It’s likely not the indicator but more likely our misinterpretation of the signals.
Few areas where the Donchian channel may be tough to read.
Low float stocks are not bound by any indicator, especially Donchian channels.
The challenge with the Donchian channels is that it does not factor in the most recent market volatility.
The indicators provide an equal weighting to all data points.
Therefore when a low float stock picks up and goes on a run, the lower bounds not capture the price movements quickly enough, thus risking giving back more profits than necessary.

[Zekis]Opening Range Higher High Lower Low Forex SessionsOpening Range Higher High Lower Low Forex Sessions
Very useful for session trading, the opening range will reset when new session is start and will plot new higher highs and new lower lows until the end of the session.
Ability to change between 3 opening sessions:
* London - opens at 3:00 am EST
* New York - opens at 8:00 am EST
* Tokyo - opens at 7:00 pm EST
* New day - GMT +0
Green arrow - new higher high
Red arrow - new lower low
Green background - the strength of the bullish trend
Red background - the strength of the bearish trend
(the lighter the color, the stronger the trend)
Enjoy!
@zekis
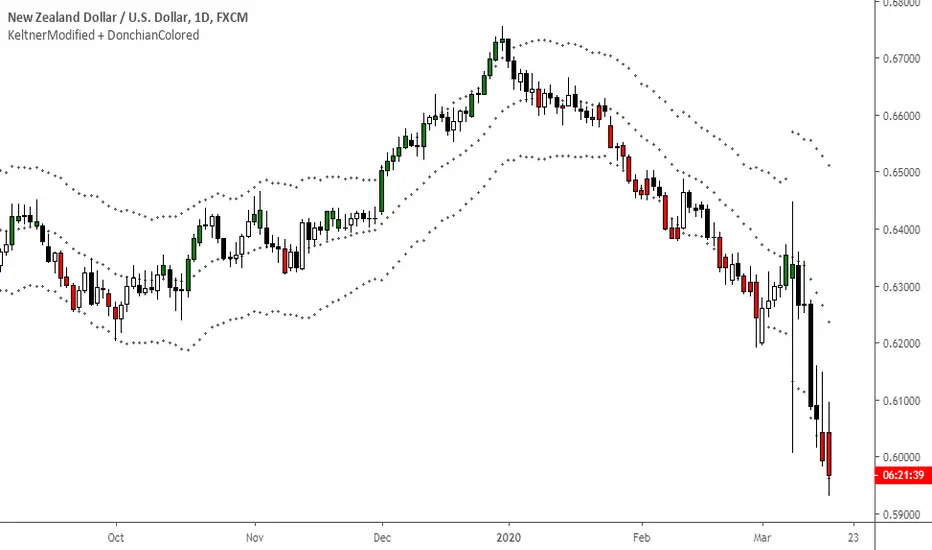
KeltnerModified + DonchianColoredKeltner Channel + color coded candles when making new Donchian highs/lows
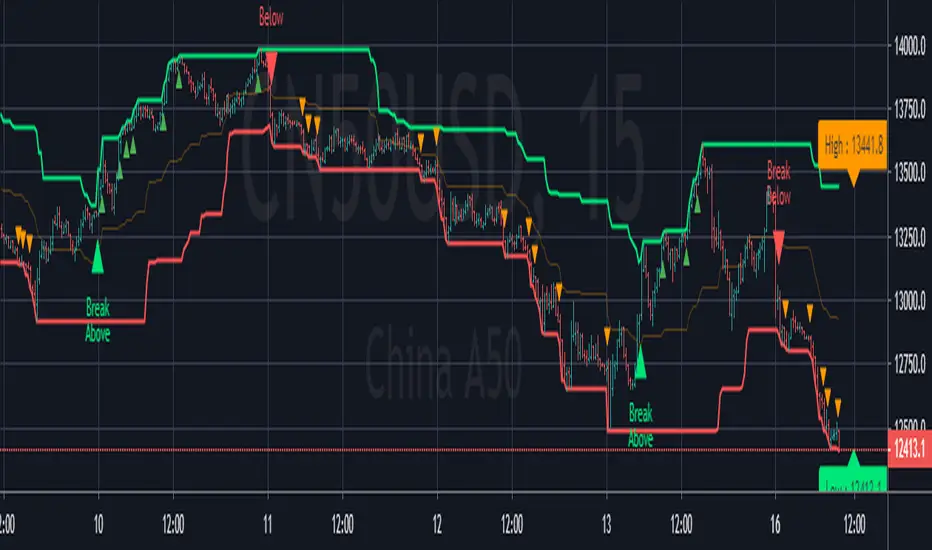
[Zekis]Turtle Trading Donchian Price Channels StrategyOne of the most famous strategy in the history of trading, #Turtle strategy have numerous legends, one of them is using Donchian Price Channels with 55 period for entries and 20 period for exits.
Can be used with any time frame
Added alerts
I added re-entries and re-exits for more scalps or for laddering trading.
Also you can modify parameters for entries and exits for your market needs.
Trade safe!
@Zekis
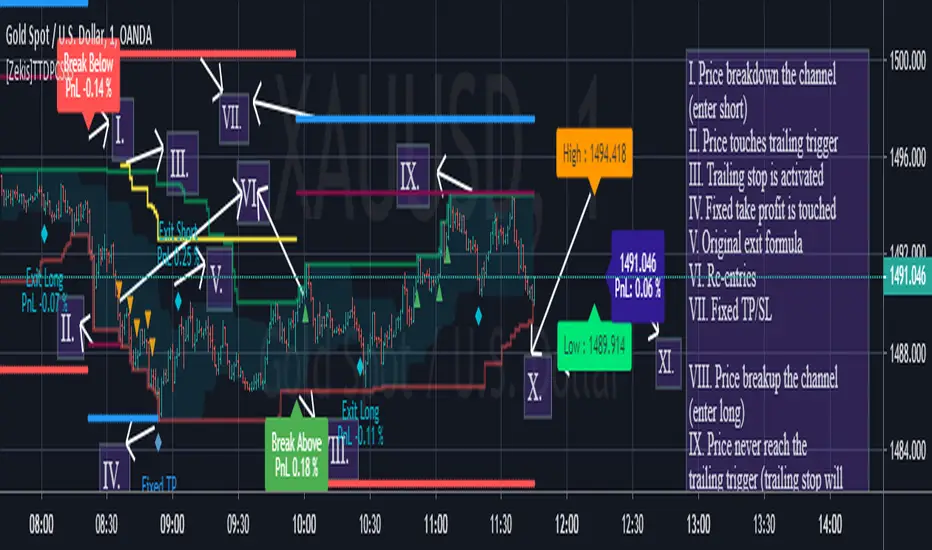
[Zekis]Donchian Price Channels Strategy with AlertsClassic Donchian(Price) Channels, I added alerts for entries and re-entries and labels for upper and lower bands of the channel.
# Investopedia
" What are Donchian Channels?
Donchian Channels are three lines generated by moving average calculations that comprise an indicator formed by upper and lower bands around a mid-range or median band. The upper band marks the highest price of a security over N periods while the lower band marks the lowest price of a security over N periods. The area between the upper and lower bands represents the Donchian Channel.
The indicator seeks to identify bullish and bearish extremes that favor reversals as well as breakouts, breakdowns and emerging trends, higher and lower.
The Formula for Donchian Channels Is:
UC = Highest High in Last N Periods
Middle Channel=((UC−LC)/2)
LC = Lowest Low in Last N periods
where:
UC = Upper channel
N = Number of minutes, hours, days, weeks, months...
Period = Minutes, hours, days, weeks, months...
LC=Lower channel
What Do Donchian Channels Tell You?
Donchian Channels identify comparative relationships between current price and trading ranges over predetermined periods. Three values build a visual map of price over time, similar to Bollinger Bands, indicating the extent of bullishness and bearishness for the chosen period. The top line identifies the extent of bullish energy, highlighting the highest price achieved for the period through the bull-bear conflict. The center line identifies the median or mean reversion price for the period, highlighting the middle ground achieved for the period through the bull-bear conflict. The bottom line identifies the extent of bearish energy, highlighting the lowest price achieved for the period through the bull-bear conflict.
Limitations of Using Donchian Channels
Markets move according to many cycles of activity. An arbitrary or commonly used N period value for Donchian Channels may not reflect current market conditions, generating false signals that can undermine trading and investment performance
"
Ichimoku Kinkō hyō Keizen 改MTF善The script is not finnished yet and show's an other interpretation of how it could be scripted
Step -1 is complete... Basic Ichimoku with asjutable length and editable lines colors and visibilities.
Step -2 in progress... Adding ability to une multiple Spans, sens and Kumo on higher and lower timeframe.
Your Step : Like and Share ;) have a good year 2020 !
2020-01-06 /--------/ -R.V.
Jan 06
Release Notes: The script is not finnished yet and show's an other interpretation of how it could be scripted
Step -1 is complete... Basic Ichimoku with asjutable length and editable lines colors and visibilities.
Step -2 in progress... Adding ability to une multiple Spans, sens and Kumo on higher and lower timeframe.
Your Step : Like and Share ;) have a good year 2020 !
2020-01-06 /--------/ -R.V.
Jan 07
Jan 13
Release Notes: MTF Ichimoku is on it's way !!
Jan 17
Release Notes: The script is not finnished yet and show's an interpretation of how it could be scripted
Step -1 is complete... Basic Ichimoku with asjutable length and editable lines colors and visibilities.
Step -2 in complete... Adding ability to use multiple Spans, sens and Kumo on higher timeframe.
Step -3 in progress... Creating a UNIX based function to framgments actual chart periods in subcandles or "Subprices/periods" to plot multiple Spans, sens and Kumo on LOWER timeframe.
Your Step : Like and Share ;) have a good year 2020 !
/--------Coder--------/ -R.V.

ATR-ranged Donch on 15min// This is a simple Mean Reversion & Breakout Indicator.
// A Donchian Channel is plotted. A threshold equal to 0.25 of Daily ATR.
// If price reverses from this threshold, then it can be taken as possible Mean Reversion.
// If price crosses the previous Donchian levels, it can be taken as a possible breakout.
// Typical of such strategy is the whipsaw effect when price movement is just flat.
// I have marked the region where the lower and higher thresholds are closer to be an indicative of whipsaw.
// But it is not really effective to avoid whipsaw.

Ichimoku Kinkō hyō Keizen 改善
The script is not finnished yet and show's an other interpretation of how it could be scripted
Step -1 is complete... Basic Ichimoku with asjutable length and editable lines colors and visibilities.
Step -2 in progress... Adding ability to une multiple Spans, sens and Kumo on higher and lower timeframe.
Your Step : Like and Share ;) have a good year 2020 !
2020-01-06 /--------/ -R.V.
bg_Ichimoku_AlertsVersion 1.0
This script is a version of the Ichimoku Cloud indicator, which has its default settings optimized for Cryptocurrency trading. (20 Period Tenkan, 60 Period Kijun, 120 Period Senkou A, 30 Period Senkou B, 30 Period Offset/Displacement).
This script contains shape-plots and alert conditions for the following events:
- Bullish Entry into Red Kumo Cloud (Long Signal)
- Bearish Entry into Green Kumo Cloud (Short Signal)
- Edge-To-Edge(E2E) Completion on either type of Cloud (Possible Reversal Signal)
- Red & Green Kumo Cloud Breakout (Long or Continuing Long Signal)
- Kumo Cloud Support Breakdown, Top and Bottom of Cloud (Short Signal)
- Kumo Cloud Potential Bounce and Rejection
- Tenkan/Kijun Crossup/Down
Some things to note:
- Using short timeframes can cause certain alerts to fire many times, such as an E2E detection in a very thin cloud, or short/breakout when price is back-and-fourth at the edge of a cloud.
- The shapes are mostly there to provide a way to backtest when alerts would be triggered. They can be turned off in the settings if they become obnoxious and fill the screen with clutter.
At the time of releasing this script, the strategy version of this is still in development, but should be similarly released relatively soon. This indicator version of the script is intended for alerts, notifications, bot calls, and just general visual analysis of price action.
Thanks,
Bryan

BlackPika XBTUSD AlgoIntroducing the Blackpika Algo for XBTUSD and other pairs on crypto for smaller timeframes (< 1H).
Ideally, it is to be used on XBTUSD bitmex on 5m/15m/30m Interval.
Sensitivity adjustement is available to the user to fine tune on each timeframe and pair.
The script's basic foundation is on ATR, volatility, RSI, StochRSI, Donchian channels.
No repaint. Alerts available for all signals including take profit signals.

Buy & Sell - XMRBTC 1DPrivate Indicator
Indicator optimised for trading XMRBTC in 1D (daily) timeframe.
Buy and Sell signals as automated alerts.
Indicator optimised for trading XMRBTC in 1D timeframe.
The goal was to beat Buy & Hold on the whole period of the backtest. Results below!
The strategy is using a combo of Donchian Channels and Heikin Ashi, this is why there is a colored channel which can also be used to highlight the trend.
To get this indicator, use the links below, thanks !

Donchian Channels Alert SystemThis time I was using an script/indicator that was originally written by ChrisMoody on 12-14-2014, as turned it an Alert System to know whether the price breaks above or below the donchian channel of 20 periods.
I would like to show you how easy is to use it and configure it to receive this alerts in your phone.
Here's a page about what Donchian Channels are for the ones that don't know already: www.investopedia.com
This simple indicator prints a green alert when the close price crosses above the upper band of the DC, and a red alert when the price crosses the lower band of the DC.
When these conditions are met, the indicator throws an alertcondition signal. You can personalize your Trading View alerts using this information.
Create new alert, In the condition select "DC Alert System" and below select "Break Above" or "Break Below" depending on the case you're looking for. Save the Alert and voila.
Simply as that.
The Donchian Channel period is set to 20 by default, but you can update it to what suit best for you.
Hope this is a +1 to your trade alert system.
Have a good day!
If you like this script please give me a like and comment below.

Cyatophilum BITCOIN Daily IndicatorFree indicator
To get it, add it to your favorites using the button below, then you will find it on your chart in the "favorites scripts" tab
I wanted to have a tool that would quickly show me an overview of the Bitcoin chart each day, and receive alerts when something was happening, so I made this indicator.
Optimized for Bitcoin / USD on the daily timeframe, this indicator uses many technical tools such as a double Donchian channel, momentum, volume, RSI, divergences and moving averages.
HOW TO USE
Signals - You can create Automated Alerts corresponding to the graphic labels on chart.
BUY: Most bullish signal. Go long or buy bitcoin if you haven't already.
⚠️ REVERSAL: The bear trend might be over soon. Prepare some stable coins on your exchange to make sure you are ready to trade.
⚠️ RISE: Very bullish signal meaning a lot of people are buying. At this point you should just follow the sheep herd and buy.
⚠️ DROP: A drop is very likely to happen. Take your profits even though the rally can continue. Most of the time the price will drop significantly.
SELL: Most bearish signal. Go short or sell bitcoin.
Note: Use 'Once per bar close' option when creating alerts to get the exact same signals as on the chart, but only at candle close. Otherwise use 'Oncer per bar' to get them as soon as possible but the graphic-signal can disappear (unvalidated) at candle close.
Parameters
"Show 3 EMAs": Show a 50, 100 and 200 EMA. Usefull for golden/death cross.
"Channel_Length" Length in bars for the double Donchian Channel. Default is 30.
Any feedback is welcome!
To get access to my private strategies, use the link below

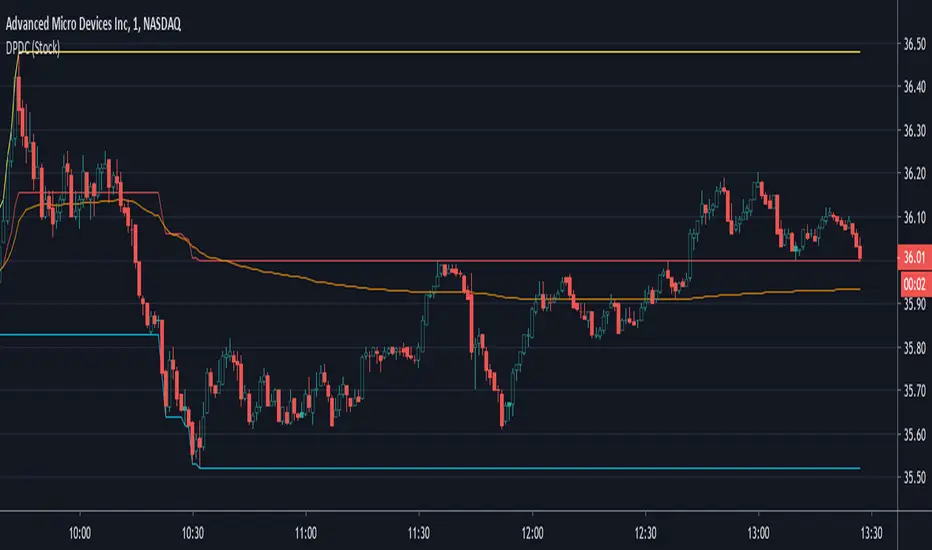
Daily Progressive Donchian ChannelsThis is the first script that I publish.
His main goal is to help identify the extreme of the day and to compare the VWAP with the average DPDC to find meaningful resistance and support.
X Period High/Low/MidToday we have a simple, but endlessly versatile, indicator that plots the X Period High/Low/Mid of your chosen market.
Traditionally the 52 week High/Low is used as a breakout signal. However, by changing to an X period, and adding a midway line, we create a more versatile indicator that can be tailored to various markets.
By default it's set at 250 periods (because I like the 250 period moving average), and I generally trade H4 and Daily time frames. But tweak it to your liking, you just have to modify the length periods by your desired time frame and lookback length. E.g. to create a 52 week indicator on the daily time frame, enter a length of 260 in the indicator (5 days per week * 52 weeks = 260).
For the above reason, I haven't made this indicator MTF, as there's no real need. However, if users find it easier I can look at adding it later.
Also, the mid point between an X period high/low is often a good trend-follower, as well as acting as support/resistance . I encourage you to experiment with different ways of using this indicator. Entire systems (if your risk management is correct) can be built and traded from this one indicator.
Good luck.
DD

Adaptive ChannelThis indicator uses KAMA to adjust the length of a channel according to volatility.
A set up is generated when a candle closes below/above the mid point line; this is indicated via the background color.
Buy/sell on the break of the high/low of the signal candle.
Use the channel top/bottom as a stop (or a close above/below the mid pint line)


