Fixed price Stop Loss [Takazudo]This strategy is a demo for fixed price stop loss.
This strategy enables you to specify fixed price stop loss. Let's say your deposit is USD. When you trade EURCAD, you need to specify the quantity for trade. Here comes three chances for trade.
A: SL pips: 500
B: SL pips: 200
C: SL pips: 100
In these trade, the risk is different for each. ABC risk ratio is 5:2:1. And, you cannot know how much to lose if the price hits the stop loss. This is a huge problem.
With this strategy, You can specify the fixed risk price for each trade. If you specify 100 USD for the risk, this strategy calculates how much quantity to buy or sell for each entry. In the case above, this strategy guides you how much quantity to buy or sell like below.
A: 2,000 qty (SL: 500pips)
B: 5,000 qty (SL: 200pips)
C: 10,000 qty (SL: 100pips)
If you make entries with those quantity and the price hits the stop loss, You will lose the money like below.
A: 100 USD
B: 100 USD
C: 100 USD
This is what this script does. Fixed price SL.
I tested this caliculation for OANDA's main 28 currency pairs forex listed below.
AUDUSD, EURUSD, GBPUSD, NZDUSD, USDCAD, USDCHF, USDJPY, AUDCAD, AUDCHF, AUDJPY, AUDNZD, CADCHF, CADJPY, CHFJPY, EURAUD, EURCAD, EURCHF, EURGBP, EURJPY, EURNZD, GBPAUD, GBPCAD, GBPCHF, GBPJPY, GBPNZD, NZDCAD, NZDCHF, NZDJPY
I may add more pairs later.
Note: The entry strategy in this script is not intented to win. Check the result. Be careful.
Donchian Kanalları (DC)

Donchian Channels Trending Breakout StrategyThis script looks for two entry signals. Long is when the previous breakout of the donchian channels was a low, price is above the input EMA, current price is equal or higher than the upper band and we're not in a position yet. Short is the other way around, so previous breakout of the donchian channels was a high, price is below the input EMA, current price is equal or lower than the lower band.
I haven't found a script that does take the previous highs and lows into consideration. Works for any markets in any conditions because the stop loss and profit targets are based on the upper and lower band of the donchian channels, which means the stop loss and profit targets move with the trend.
For more details see the script itself, I wrote a ton of comments.

HiLo Extension This Strategy is finding high and low breaks of the day and enter into the trader based on RSI value and time value
1) This strategy is created for Indian Index like Nifty, Bank Nifty and so...
2) Trades are initiate only after 10:15 AM and before 3:10PM
3) High and Low of the day break will be check during the above time frame
4) RSI value will be check (RSI 50)
5) and trade will be initiate
6) Stop loss set as vwma 20...
Note: This Script will work fine in Index future chart not index spot chart...
This is just my idea only... Please back test yourselve, before using it..
Your comments are welcome!

MACD Crossover trend strategy, Long and ShortHey everybody,
This is my first strategy and script I wrote mostly myself. There's tons of content out there to learn how to code in Pinescript and it's exactly what I wanted and needed in this time of my life.
In any case, I made a rather simple MACD crossover strategy that only takes trades in the direction of both EMA and SMA (there are inputs to change the length of the moving averages and lots of other stuff too).
If the MACD line crosses upwards on the signal line, while above the zero point of the histogram and the price is above EMA + SMA , it's a long signal.
If the MACD line cosses downards on the signal line, while below zero on the histogram and the price is below EMA + SMA , it's a short signal.
There are a lot of default variables that make no sense, for basically any symbol you're going to be looking at. You're going to have to adjust the EMA , SMA , backtest date, take profit, stop loss and all that good stuff yourself to find decently profitable parameters.
I made this myself because I couldn't really find a strategy out there that allowed for so much customizing and it's an easy way to get started in Pinescript.
If you have any suggestions, tips or you see a flatout mistake in my code, please let me know. I'm still learning, everyday and I'm enjoying every second of it.

hamster-bot PDD Pump and Dump DetectorPump and Dump detector by hamster-bot
strategy author: foresterufa
Pump and Dump detector (PDD)
This is a trend strategy, with a unique mechanism of multi-stage re-entry into a position (Take Profit-Entry) when a significant trend develops, based on our HiDeep indicator.
Positions are opened by the HiDeep indicator signal with trend direction filtering and volatility filtering. Positions are closed by a HiDeep indicator signal or a change in the trend direction.
The position can be accompanied by a unique Stoploss trailing MA.


TradeChartist Donchian Channels Breakout Strategy™TradeChartist Donchian Channels Breakout Strategy is the strategy backtester version of ™TradeChartist Donchian Channels Breakout Filter .
===================================================================================================================
Features of ™TradeChartist Donchian Channels Breakout Strategy
========================================================
Option to plot Donchian Channels of user preferred length, based on the Source price in addition to High/Low Donchian Channels.
Generates trade entries based on user preferred Breakout Price. For example, if the user prefers HL2 as breakout price, irrespective of the Donchian Channels type, trade entries are generated only when hl2 price (average of high/low) breaks out of the upper or lower band.
Option to plot background colour based on Breakout trend. The bull zones are filled with green background, the Bear zones are filled with red background and the bar that broke out is filled with orange background.
Option to colour price bars using Donchian Channels price trend. The Donchian Channels basis line is plotted using the same colours as coloured bars as default.
Note: This script does not repaint. To use the script for trade entries, wait for the bar close without Backtester or Strategy entries (with Backtester) and use a second confirmator (includes fundamentals) based on asset type as some markets require users to have good pulse on the fundamentals as trading by Technicals/price action dynamic alone may not be safe.
Note: Trend Based Stochastic of the same DC Length can be used from ™TradeChartist Risk Meter for Trade Confirmations too.
===================================================================================================================
Best Practice: Test with different settings first using Paper Trades before trading with real money
===================================================================================================================
This is not a free to use strategy. Get in touch with me (PM me directly if you would like trial access to test the strategy)
Premium Scripts - Trial access and Information
Trial access offered on all Premium scripts.
PM me directly to request trial access to the scripts or for more information.
===================================================================================================================

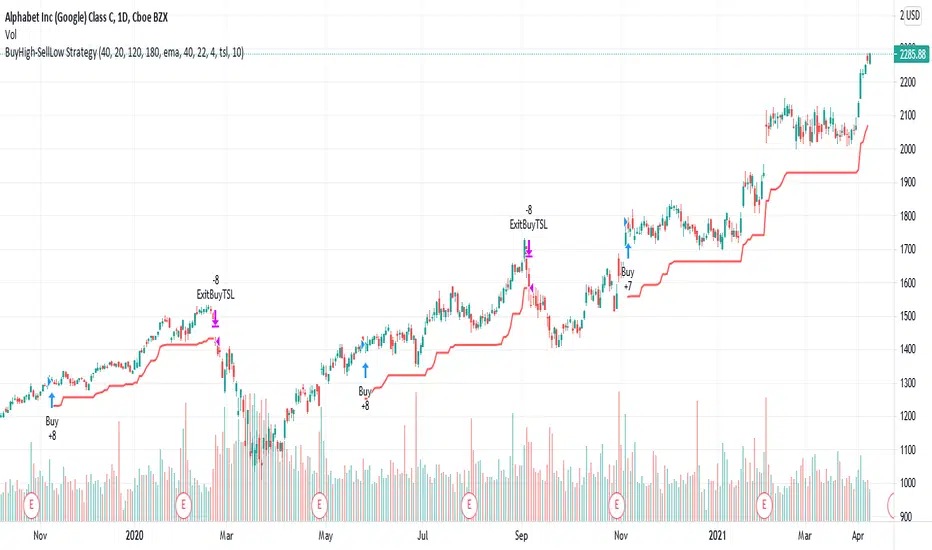
BuyHigh-SellLow StrategyYeah. You read it right. It's not a mistake. It is buy high and sell low strategy.
Main entry condition is to buy when price hits 40 day Donchian channel top. This is combined with my other regular filters which are aligned moving average and new high/low filter and yearly high/low filter.
Exit condition can be based on two things:
Donchian channel : Set appropriate DonchianExitLength. Lower line of donchian channel acts as trailing stop.
ATR Based trailing stop : Select appropriate ATR multiplier and length.
What a surprise!! You can buy high, sell low and still make money.
2HLA very simple, almost naive strategy, in which you buy on the lowest of the two previous candles and sell at the highest of the two previous candles. You can configure these highest and lowest lenght, in some assets two is too small of a number to make profit. You can also configure to exit the position after X, and I found that 7 (which is a week of working days) is a good number for that.
This is strategy is intended to be used as a swing trade. Your capital needs to be high enough so that it can pay the operaitonal costs, and reach it's target with a reasonable profit.
Since this is a volatility based strategy, assets that are more liquid won't work properly.

Donchian Channels Strategy - Long Term TrendFor Educational Purposes. Results can differ on different markets and can fail at any time. Profit is not guaranteed.
This only works in a few markets and in certain situations. Changing the settings can give better or worse results for other markets. This is a longer term trend following strategy that uses Donchian Channels for trend following and uses the upper and lower bands to find price breakouts to enter the market and then uses the middle band as a trailing stop to exit. DCs are known as the original trend following strategy made by Richard Donchian.
Usually the middle band uses the same length of the upper and lower bands in its calculation but I included the default option of using a middle band that is double the length of the other bands, but also an option to use the regular input length that most Donchian strategies use if needed. If long term trends are somehow found, this longer middle band lets the profits run longer and lets you see where the long trends were at if the market had any. The double lengthed middle band looks surprisingly very similar to a 3x ATR trailing stop, which is the recommended setting Wilder suggested for trend following. If a good ATR stop or other trailing stop can't be found, this longer middle band can act as a substitute for it.
For some reason I can't seem to find anything related to Donchian strategies on here despite the popularity and simplicity of it, not even a single working one to my liking, so I made my own. It seems this strategy only works in trending markets. I intentionally handpicked a market that the backtest does well on to illustrate the potential it might have for other markets where trending following strategies might work on and what to expect the results in those might be. Trend following strategies are said to have high profits but at the same time lower accuracy due to the failure rate of being able to catch the right trend. If you all got any suggestions or feedback please let me.

Lagged Donchian Channel + EMAThis strategy is based on a lagged 24 periods Donchian Channel and a 200 periods EMA .
The enter positions are calculated this way :
Bull entry
1. we wait for the close of a candle below the channel and it must be below the 200 EMA
2. the following candle must be a green one and close in the lagged channel
3. we put a long order at the close of the second candle, a stop loss at the low of last 3 candles and a x3 take profit
Bear entry
1. we wait for the close of a candle above the channel and it must be above the 200 EMA
2. the following candle must be a red one and close in the lagged channel
3. we put a short order at the close of the second candle, a stop loss at the high of last 3 candles and a x3 take profit
For both long or short positions :
If the order is not filled, it's cancelled if the price reach 50% of the TP or if the price reach the stop loss level
The position is closed if a new bear/bull condition appears in the other side of the position (if a bear appears when you're long and inversement)
Features :
Position calculator's included with leverage option
Labels of position can be plotted or not
Bull/Bear channels can be plotted with red and green filled
All parameters can be changed for backtesting
Better results have been got with defaults parameters on LTCUSDTPERP in H1 timeframe => profit factor of 2.84 with almost 100 positions.
Hope this strategy will be useful and it would be cool if I could get feedback, comments or better combinations of parameters !!
Don't hesitate to like and leave a comment ;)
@Mysteriown

Channel Break [for free bot]I present to you a script for testing the channel breakout strategy for the Bitmex exchange.
Cryptocurrency itself is a trending tool, which is why breakout strategies generate the largest profits, and the channel breakout strategy is one of the most effective trend strategies.
The optimization result shows the result of trading on a volume of 20% of the deposit. But since Bitmex trades in futures contracts, you can use 50%, 100% and even much more, depending on your attitude to risk.
At the time of publication on the Bitmex exchange there are 12 different contracts, i.e. You can diversify your trading well (by pre-optimizing the settings for each contract).
In the script, you can set up many trading options - timeframe, periods for buying and selling, method of exiting a trade, stop loss, take profit, risk management, etc.
Thus, you create a strategy "for yourself".
Представляю Вам скрипт для тестирования стратегии пробоя канала для биржи Битмекс.
Криптовалюта, сама по себе является трендовым инструментом, именно поэтому, пробойные стратегии генерируют самую большую прибыль, а стратегия пробоя канала – является одной из самых эффективных трендовых стратегий.
На результате оптимизации показан результат торговли на объеме в 20% от депозита. Но так как на Битмекс торговля идет фьючерсными контрактами, Вы можете использовать 50%, 100% и даже намного больше, в зависимости от Вашего отношения к риску.
На момент публикации на бирже Битмекс есть 12 разных контрактов, т.е. Вы можете хороши диверсифицировать свою торговлю (предварительно оптимизируя настройки по каждый контракт).
В скрипте Вы можете настроить множество вариантов торговли - таймфрейм, периоды для покупки и продажи, метод выхода из сделки, стоп-лосс, тейк-профит, рискменеджмент и т.п.
Таким образом Вы создаете стратегию "под себя".

Donchian Strat EXMOThis is simple test of Turtle Trading strategy by Richard Dennis. The script meant to place orders on Donchian Channel borders. It's best to test and use on mid-term charts like 1H and more.
I've chosen Kraken XBT/USDT chart because this market opened in december 2019. The main problem of crypto trading strategy testing is the bullish market of 2017 year. That enormous growth gives unrealisting expectations to all trend-following strategies tested.

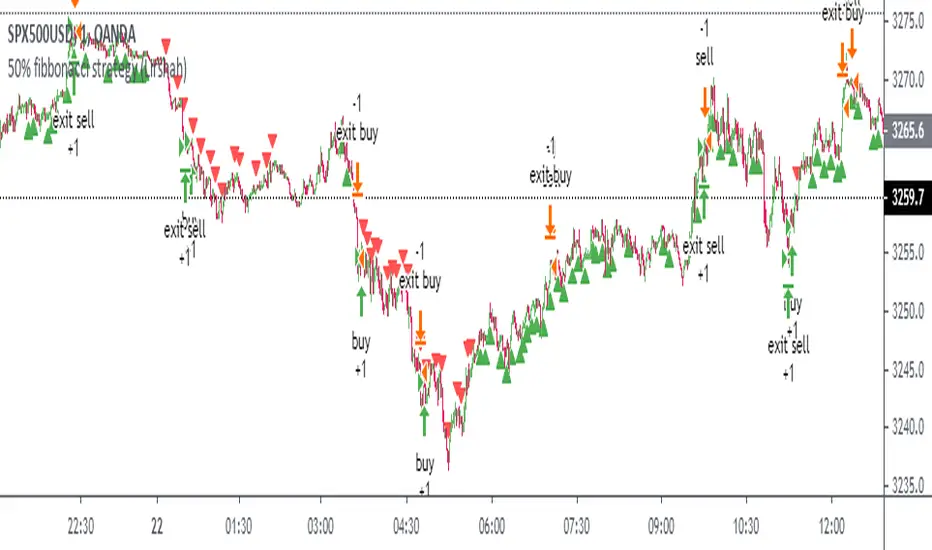
50% fibbonacci strategy (Lirshah)50% Fibonacci is driven from long term average price action in combined with pivot point.
the strategy trigger buy signal when its on uptrend long term and buy on pivots.
the similar scenario for sell signals.
the strategy has good results on indices and some forex pairs.
the parameter are as below:
1)last bar calculation
2)pivot point
3)take profit
4)stop-loss
the below is results of 1 contract wall street index on 5sec time frame without calculation of commission.
in order to access scripts contact me directly.
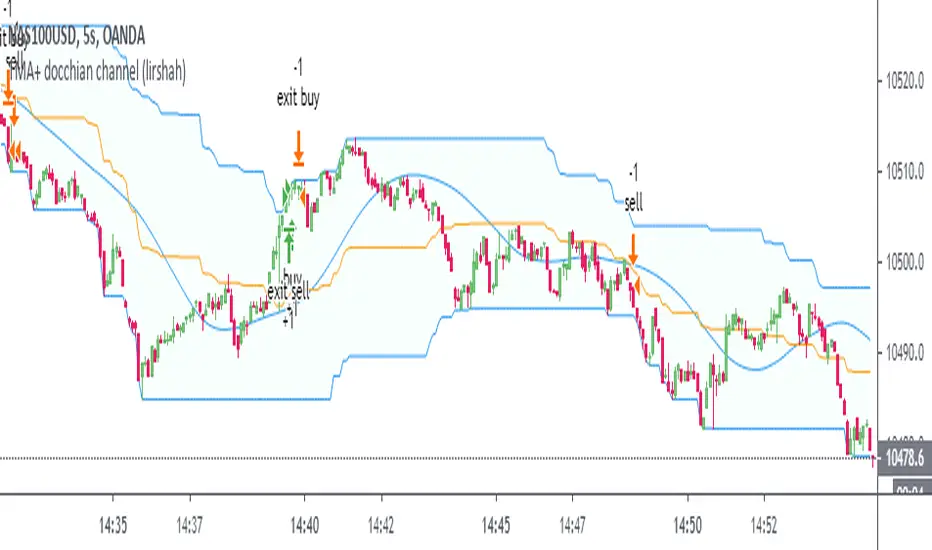
TMA+ docchian channel (lirshah)this strategy is based on combination of donchian channel and TMA moving average.
buy signals triggers when TMA crosses average line of donchian channel and similar for selling position.
the standard parameters are a below:
donchian channel length: 55
Tma length: 20
the results of overview on germany index (1 contract+ 2$ commissions per order) is as below.
in order to access scripts contact me directly
Donchian Channel StrategyLong and Short entries based on the Donchian Channel indicator. The entry can be set to Higher High/Lower Low or the basis line.

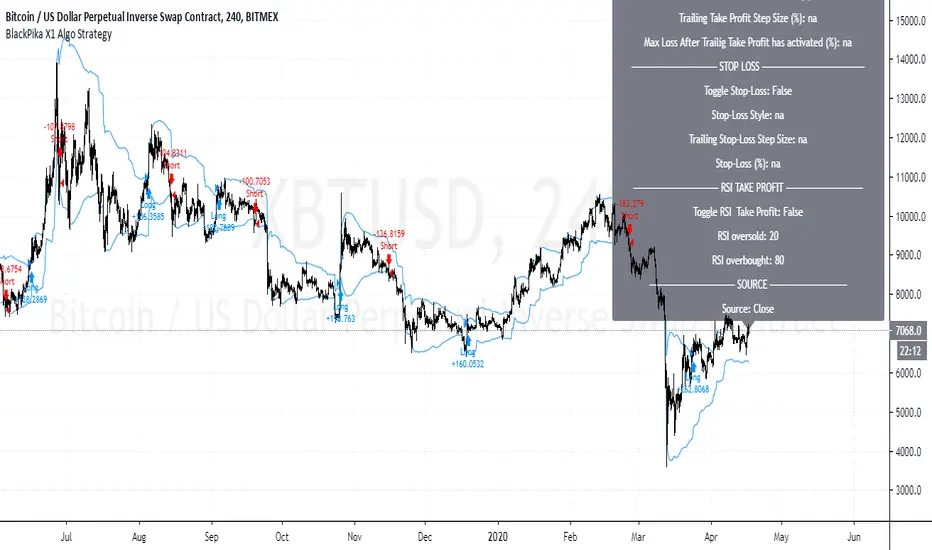
BlackPika X1 Algo StrategyBlackPika X1 Algo is a successor to the original BlackPika Algo.
It uses the following main elements:
RSI
ATR
ADX
Volume
Chopiness Filter
Trailing Profit
Fixed Profit
Trailing Stop loss
Fixed Stop Loss
Donchian channels and some more...
The backtest you see includes a commision of 1% and slippage of 1 tick. and the start date is from 2015
All the above mentioned settings are customisable, and can be adapted to your liking, timeframe and Asset.
Hit me up if you have any questions. This is only a backtest version.
All the best in your trading.
Combo Backtest 123 Reversal & Donchian Channel Width This is combo strategies for get a cumulative signal.
First strategy
This System was created from the Book "How I Tripled My Money In The
Futures Market" by Ulf Jensen, Page 183. This is reverse type of strategies.
The strategy buys at market, if close price is higher than the previous close
during 2 days and the meaning of 9-days Stochastic Slow Oscillator is lower than 50.
The strategy sells at market, if close price is lower than the previous close price
during 2 days and the meaning of 9-days Stochastic Fast Oscillator is higher than 50.
Second strategy
The Donchian Channel was developed by Richard Donchian and it could be compared
to the Bollinger Bands. When it comes to volatility analysis, the Donchian Channel
Width was created in the same way as the Bollinger Bandwidth technical indicator was.
As was mentioned above the Donchian Channel Width is used in technical analysis to measure
volatility. Volatility is one of the most important parameters in technical analysis.
A price trend is not just about a price change. It is also about volume traded during this
price change and volatility of a this price change. When a technical analyst focuses his/her
attention solely on price analysis by ignoring volume and volatility, he/she only sees a part
of a complete picture only. This could lead to a situation when a trader may miss something and
lose money. Lets take a look at a simple example how volatility may help a trader:
Most of the price based technical indicators are lagging indicators.
When price moves on low volatility, it takes time for a price trend to change its direction and
it could be ok to have some lag in an indicator.
When price moves on high volatility, a price trend changes its direction faster and stronger.
An indicator's lag acceptable under low volatility could be financially suicidal now - Buy/Sell signals could be generated when it is already too late.
Another use of volatility - very popular one - it is to adapt a stop loss strategy to it:
Smaller stop-loss recommended in low volatility periods. If it is not done, a stop-loss could
be generated when it is too late.
Bigger stop-loss recommended in high volatility periods. If it is not done, a stop-loss could
be triggered too often and you may miss good trades.
WARNING:
- For purpose educate only
- This script to change bars colors.


Donchain BreakoutIt is a long only strategy.
1. Buy when price breaks out of the upper band.
2. Exit has two options. Option 1 allows you to exit using lower band. Option 2 allows you to exit using basis line.
3. Slippage and commissions are not considered in the return calculation.

Donchian Breakout StrategyThis strategy buys when the Donchian Channel is broken to the upside and uses the lower Donchian Channel line as a trailing stop. You can also choose to use a moving average as a filter to keep you out of trades that are counter trend.
You can also configure which dates you want to backtest, so you can see how this behaves over specific time frames and market cycles.

BlackPika XBTUSD Algo StrategyThis is a strategy script to the "BlackPika XBTUSD Algo" with Take Profit and Stop Loss features.
Easy to backtest. Enjoy
