Moving Average Crossover with Shading Signals This script uses 3 moving averages (2 simple moving averages and 1 exponential moving average ) to signal long and short opportunities based on moving average crossovers.
A long SMA (Signal SMA2) is used to determine longer term trend. When the EMA crosses above the Slow SMA1 and price is above the Signal SMA2. The space between the moving averages will shade green and the Signal SMA should also be green.
A sell signal occurs when the EMA crosses below the Slow SMA1 and price is below the Signal SMA2. The space between the moving averages will turn red and the Signal SMA should also be red.
A retracement, consolidation, or reversal may be occurring if the shaded color is yellow.
Use the identifying shapes to learn when to open or close positions.
Cross

FEJ - DogeMarginFEJ - DogeMargin ist ein All-in-One Indikator.
Mit dem ihr euch praktisch das Upgrade auf eine bezahlte Tradingview Version sparen könnt.
- Wave-Detector: Bestehend aus einem innovativen Wave-Trenddetector mit dessen hilfe es sehr leicht ist einen Trendwechsel und die vorraussichtliche Stärke des kommenden Moves zu erkennen.
- NMA: Eine dynamische Trendlinie um die stärke der Signale zu überprüfen.
- Channel: Um potenzielle Trendwenden bzw. Überkaufte oder Überverkaufte Situationen zu erkennen.
- Golden- & Deathcross: SMA basierende Crosses um potenzielle Trendwendepunkte zu erkennen und bestehende Signale zu überprüfen. Die SMA Crosses sind in einem festgelegten Timeframe, welcher sich in den Einstellungen anpassen lässt. Die SMA´s sind optional einblendbar. In einem Update folgen noch MACD Crosses.
- Volume Candles: Dieser passt die Farbe der Candles entsprechend dem aktuellen Volumen und dessen Richtung an.
Dunkel Violett - Der Preis sinkt und das Volumen ist größer als 200% des Durchschnitts der letzten 20 Tage - Stark Bearish
Violett - Der Preis sinkt und das Volumen ist zwischen 50% und 200% des Durchschnitts der letzten 20 Tage - Volumen ist weder stark noch schwach
Helles Violett - Der Preis sinkt und das Volumen ist geringer 50% des Durchschnitts der letzten 20 Tage - Wenig Support für die aktuellen Preisbewegungen.
Aqua - Der Preis steigt und das Volumen ist größer als 200% des Durchschnitts der letzten 20 Tage - Stark Bullish
Blau - Der Preis steigt und das Volumen ist zwischen 50% und 200% des Durchschnitts der letzten 20 Tage - Volumen ist weder stark noch schwach
Helles Blau - Der Preis steigt und das Volumen ist geringer 50% des Durchschnitts der letzten 20 Tage - Wenig Support für die aktuellen Preisbewegungen.
- S & R Lines: Dieser Indikator zeigt die für diesen Timeframe aktuellen Support und Resistance Linien an.
- EMA Ribbons: Dieser Indikator zeigt ein Ribbon für den aktuellen Timeframe an.
Wave
Mit Hilfe der Welle in der Mitte lassen sich Trendwenden erkennen.Die Trendwende ist besonders stark, wenn das Signal bei einem Bull-Signal unterhalb der gelben NMA-Line liegt ; bei einem Bear-Signaloberhalb der gelben NMA-Linie liegt.
Wenn Kurs in folge eines Signals nach der NMA schließt, deutet das auf einen Trendwechsel hin. Bis dahin
Mit hilfe des Dogeprotocol lassen sich diese Signale noch weiter verbessern undgegenprüfen
Channel
NMA
Golden- & Deathcross
Zeigt an wo sich entweder ein SMA Golden- oder Death-Cross befindet
WICHTIG: Der TimeFrame für die Crosses ist festgelegt - Standardmäßig auf 4h (240m)
Es macht am meisten Sinn, den TF auf 1/10 deines Beobachtungszeitramens zu stellen.
2x SMA´s
Volume Candles
S & R Lines
EMA Ribbos
____________________________________________________________________________________________________________________________
English:
FEJ - DogeMargin is an all-in-one indicator.
With which you practically do that Upgrading to a paid Tradingview version can save you money.
- Wave detector: Consists of an innovative wave trend detector with its help it is very easy to change the trend and the anticipated Recognize the strength of the upcoming move.
- NMA: A dynamic trend line to check the strength of the signals.
- Channel: Around potential trend reversals or overbought or oversold situations to recognize.
- Golden & Death cross: SMA based crosses around potential trend turning points to recognize and to check existing signals. The SMA Crosses are in a fixed timeframe, which can be found in the settings can be adjusted. The SMAs can optionally be faded in. MACD Crosses will follow in an update.
- Volume Candles: This adjusts the color of the candles according to the current volume and its direction.
Dark Purple - The price is falling and the volume is greater than 200% of the Last 20 Day Average - Strongly Bearish
Purple - The price is going down and the volume is between 50% and 200% of the Last 20 days average - volume is neither strong nor weak
Light purple - the price goes down and the volume is less than 50% of the Average of the last 20 days - Little support for the current ones Price movements.
Aqua - The price goes up and the volume is greater than 200% of the Last 20 days average - Strong Bullish
Blue - The price is increasing and the volume is between 50% and 200% of the Last 20 days average - volume is neither strong nor weak
Light blue - the price goes up and the volume is less 50% of the Average of the last 20 days - Little support for the current ones Price movements.
- S & R Lines: This indicator shows the current support and for this timeframe
Resistance lines on.
- EMA Ribbons: This indicator shows a ribbon for the current timeframe.
Wave
Trend reversals can be seen with the help of the wave in the middle.
The turnaround is particularly strong when the signal is at one
Bull signal is below the yellow NMA line; on a bear signal is above the yellow NMA line.
If course closes on a signal after the NMA , it indicates one
Change of trend. Until then
With the help of the Dogeprotocol, these signals can be improved even further
double check
Channel
NMA
Golden & Death Cross
Shows where either a SMA golden or death cross is located
IMPORTANT: The timeframe für crosses is fixed - by default to 4h (240m)
It makes the most sense to set the TF to 1/10 of your observation timeframe.
2x SMAs
Volume candles
S&R Lines
EMA Ribbos

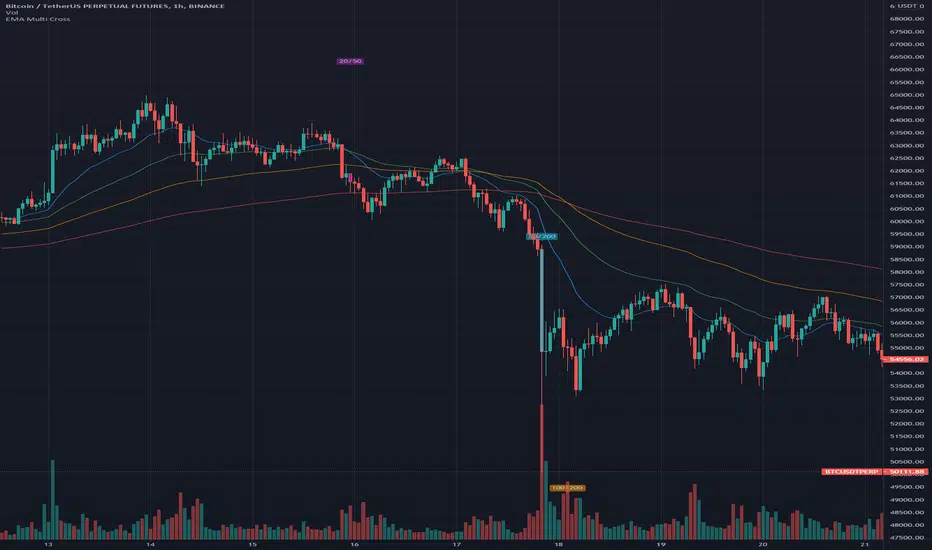
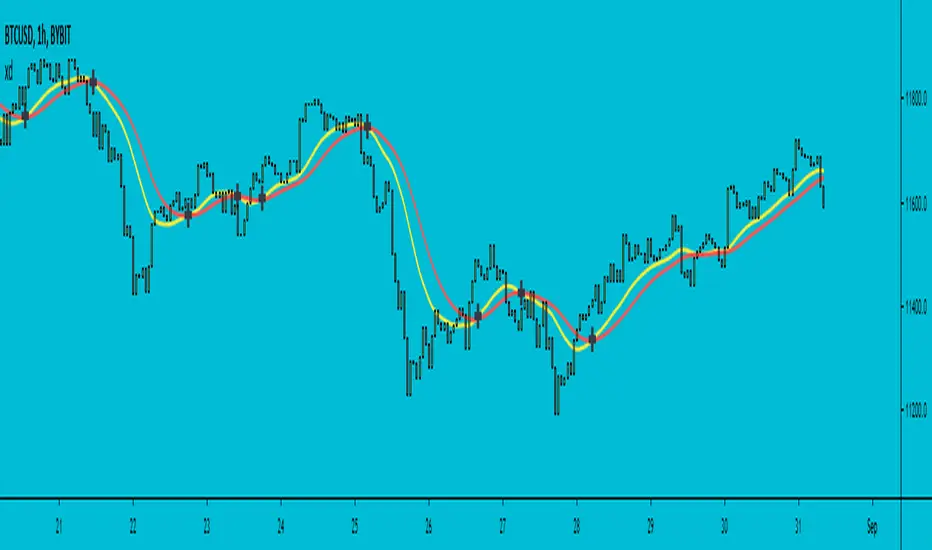
EMA Multi CrossThis is just a very simple EMA indicator that shows the 20, 50, 100, and 200 Exponential Moving Averages and plots some shapes when the lines cross from the 20 & 50, the 50 & 200, and the 100 & 200.
I know there are many EMA indicators out there, but I couldn't find one that let me edit the colors, values, and toggle the crossings. Maybe some of you will find usefulness in having some of these extra options too.
I use this occasionally on the Bitcoin 1 hour charts to see how the long-term trend is going.
Here are some ways to read EMA lines:
Slope: A rising moving average generally reflects a rising trend, while a falling moving average points to a falling trend.
Crosses: Seeing when a slower moving average crosses over/under a faster moving average can be an indication of a trend. If a shorter moving average remains above the longer moving average after they cross, the uptrend is considered intact. The trend is seen as down when the shorter moving average is below the longer moving average.
I prefer the slope of the two since crosses can cause some false positives if you are relying on it for trades.
MACD Moving Average Convergence/Divergence - DurbtradeDurbtrade MACD - macd line changes color based on vertical direction. This makes it easier to see and discern movements and also helps the indicator to retain maximum functionality when taking up less chart real estate (also, having the color change really helps me see charts on small screens... such as when it's bright outside and I'm driving in my car and glancing at a chart on my phone... it helps having the info pop visually). A fill option is included to fill the space between the macd and signal lines, though I personally prefer to disable this function. Also, you get a zero line if you want it, and it doesn't extend past the current time, removing unnecessary info and keeping your chart looking a bit cleaner. Finally, there are color-coded, cross-over and cross-under background fills, signaling when the macd line crosses the signal line.
This is my 2nd published script, and 2nd script ever. If you like this style, see my 1st published script: Durbtrade Bollinger Bands Width.
Hope you find this useful.
Feel free to comment.

Altered True Strength Indicator (TSI) Reupload-
Altered TSI provides a slightly more volatile signal that demonstrates extremities in price action with greater success than standard TSI. In addition, I added bull/bear cross indicators (green/red) to make it easier to notice the crosses to save time when the market is moving fast (I couldn't find a regular TSI script with this addition). Finally, the signal also has overextension parameters (red and green lines)
I think this is best used on Intraday time frames as the signals respond to volatility very well and using Heikin Ashi candles, trend is more visual. In this particular example, I am showing SPY on the 3m time chart (my favorite short time frame) and the signal alone provided many opportunities for trades when using simple divergences and countering overextension direction when short term (blue) signal crosses either
In the first example (purple lines), SPY ramps but it was a dull signal given the signal strength flatlining- we would be looking for a short entry. When the signal fires, it provides a clean $1.50 move down in spy.
In the second example (orange), the blue signal provides a nice V shape (rebound signal) in which we are looking for a long entry. 390.50 is a strong SPY support in confluence with 2nd std dev VWAP extension, but disregarding that bull signal fires resulting in a 2 dollar move upwards. Exit is provided when blue line crosses green overextension.
In the third example (white), we are searching for a short entry at 392.5 resistance in confluence with divergently higher highs. Bear cross signal when fired and a significant cross is visible provides a $2.50 move to the downside with a potential exit provided when blue line crosses red overextension line in confluence with previous LOD area.
In the fourth example (green), we watch as the blue line provides a V pattern, we are searching for a long entry. If you didn't take a riskier long at 2nd std dev VWAP overextension with V recovery on blue line at red overextension for a ride to vwap, then you are looking for a secondary entry long as you wouldn't take the trade at resistance (vwap). Bullishly divergent lows provide this entry and the signal does not bear cross at all (but looking for significant crosses is more important even if the signal were to make a minor bear cross). Bullishly divergent double bottom provides a long entry to end of day with a nice clean signal for a $5.00 move until eod or when signal crosses overextension range.
Ideally, close to the money options or SPY/SPXS/SPXL are best used in the intraday time frame.
Again, this is not a standalone indicator but it's best used in conjunction with other indicators/trading strategies
Any questions feel free to comment

Open Close Cross Strategy plus ExplorerOpen Close Cross Strategy plus Explorer
V 1.0
There is a code that can control sensitivity. try to change 'ATR Multiplier' menu
There is a code for prevent 'repaint'. If you want it check 'Forces Non-Repainting' menu
thanks to
PMax Explorer STRATEGY & SCREENER KivancOzbilgic
Open Close Cross Strategy R5 revised by JustUncleL JustUncleL

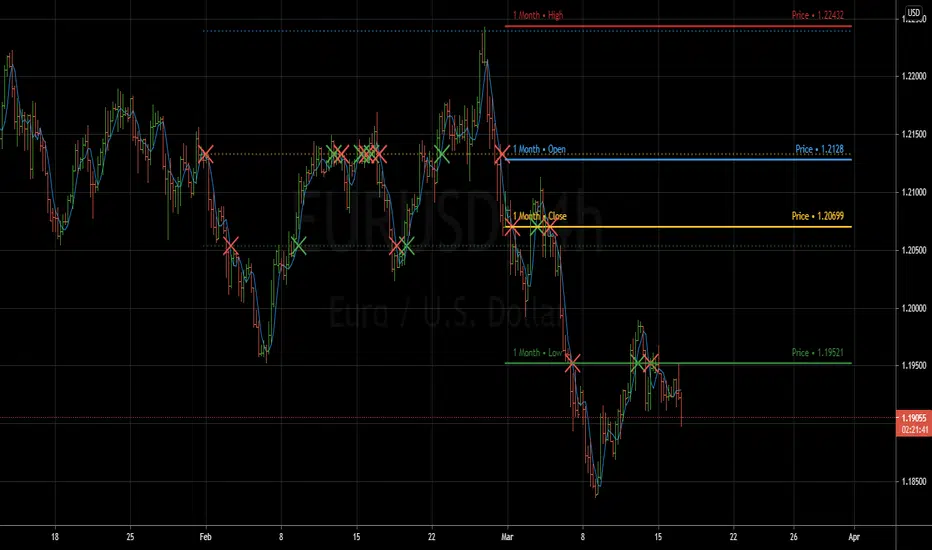
Previous Period Levels - X Alerts====== ABOUT THIS INDICATOR
- A simple but highly customisable display of previous higher time-frame
OHLC values, drawn using line.new and label.new. Nothing fancy but...
- Customised resolution input which excludes time frames lower than 1 hour
while extending the common higher reference inputs to include:
• 6, and 12 Hour
• 5 Day
• 3, and 6 Month
• 1 Year
- Alert conditions using an adjustable SMA to help reduce false positive
spam.
- Full visual customisation options for (almost) every aspect, so it can be
tuned to suit most individual preferences.
- In line with the miriad visual customisation options is the ability to
change the display format of the Labels, to show more or less information,
or disable them altogether.
====== REASON FOR STUDY
- To practice advanced user input option handling to allow for a full visual
customisation experience without stepping outside of, or interfering with,
the intended function of the indicator.
- Provide reasonably clear code commenting and structure in order to be
useful as a potential learning aid for others, and future reference for
myself.
====== DISCLAIMER
Any trade decisions you make are entirely your own responsibility.
I've made an effort to squash all the bugs, but you never know!
EL Relative Strength Index cross - by Epullemanepulleman RSI long and short
probability of uptrend when red cross-up blue (with small yellow dot)

[DS]Entry_Exit_TRADE.V01-StrategyThe proposal of this script is to show the possible trading points of BUY and SELL based on the 15-minute chart of the Nasdaq Future Index. The start point of the strategy was schedule for 2021/01/01 and until the time of this publication (2021/01/31), for 1 index contract the results presented area a Gross Profit of 2.97% with a Net Profit of 1.35%.
█ FEATURES
The indicator shows on the graph the position of the MACD and TSI indicators that are the places of strength among Buyers and Sellers.
It's possible to observe a sharp fall or rise in the price of these positions.
On the current candle, a label is displayed containing the value of the William %R Mod indicator, which will display the OverBought position (dark red) and OverSold position (dark green). The other colors like light red and green are the regions where the price makes the decision of which direction to go.
There are also other indicators:
a) The positions of the BUY (light green) and SELL areas (light red);
b) The label with the position of BUY (dark green) and SELL (dark red) with the line that connects these points;
c) DEMA 72 (orange);
d) EmaOchl4 in the color green for BULL and red for BEAR market;
e) Pivots high and low
f) Maximum (purple light) and minimum areas (blue light)
█ FUNCTIONS AND SETTINGS
The indicator uses the following functions:
(1) DEMA - Double Exponential Moving Average (08,17,34, 72)
(2) ema () - Exponential Moving Averge (72, ohlc4)
(3) plot()
(4) barcolor()
(5) cross()
(6) pivots ()
(7) William R% Md (OverBought = -7, OverSold=-93)
(8) Maximum and Minimum Value
(9) fill()
(10) macd () - Moving Average Convergence Divergence (Fast Lengt=12, Slow Length=26, Source=close, Signal Smoothing=9)
(11) tsi() - Trading Strenght Indicator==> Índice de Força Real ( IFR ) (Long Length=72, Short Length=17, Signal Length=17)
(12) Buy and Sell TRADE Points
█ PERFORMANCE AND ERRORS
The positions of BUY and SELL points are defined through the crossing of the Dema 34 candles with the Ema Ohcl4. As it is an indicator, it can present different positions from de market direction. Thus there is a need to observe the direction of the market in order to verify whether the indicate decision is really acceptable. The decision to BUY or SELL an asset must be well studied to avoid financial losses. The indicator will only help you in this decision, is your responsibility the decision of entering or leaving an asset.
█ THANKS TO
PineCoders for all they do, all the tools and help they provide, and their involvement in making a better community. All the PineCoders, Pine Pros, and Pine Wizards, people who share their work and knowledge for the sake of it and helping others, I'm very happy and grate full indeed.
█ NOTE
If you have any suggestions for improving the script or need help using it, please send a message in the comments

Double EMA CROSS
Double EMA CROSS (DEC)
Useful for identifying and receiving alerts about uptrends and downtrends.
This script uses two Exponential Moving Averages (EMAs) to find price uptrends and downtrends.
An Exponential Moving Average ( EMA ) is a type of moving average that places a greater weight and significance on the most recent data points.
The script produces uptrend and downtrend signals based on crossovers and divergences between the two EMAs,
the user will be able to spot a trend change (when the EMAs crossover) and to determine the strength of the current trend (when the EMAs diverge).
It is also posible to get alerts for uptrends and downtrends on the web and mobile app with sound and pop-ups as well as via email.
The optimal time to enter and exit the market can be concluded from this trend changes.
The user can set their own EMAs, by default they are set to 25 and 75 periods for medium and long term respectively.
When the medium term EMA crosses below the long term EMA the asset is in a downtrend and the price will decline, and when the
medium term EMA crosses above the long term EMA the asset is in an uptrend and price will increase.
This scripts plots the following indicators and signals on the chart to help the user to identify trends:
1.- Medium and long term EMAs as lines overlaid on the price chart.
2.- Up green triangles above bars when the price is on an uptrend and down red triangles below bars when the price is on a downtrend.
3.- Arrows with text to indicate the start of an uptrend or downtrend.
The user can enable and disable the indicators and signals as well as set colors and shapes to their liking.
This script also lets the user create alerts for uptrends and downtrends. To create a new alert using this script follow this instructions:
1.- Once you added this script to your chart, go to the alerts panel (right on web or bottom tool bar on the mobile app) and add a new alert (alarm clock icon with a plus sign).
2.- A modal window will open. On the “Condition” dropdown menu select “DEC”.
3.- On the next dropdown menu (right below the “Condition” one) you can select.
4.- Lastly you can set all the normal alert options and create the alert.

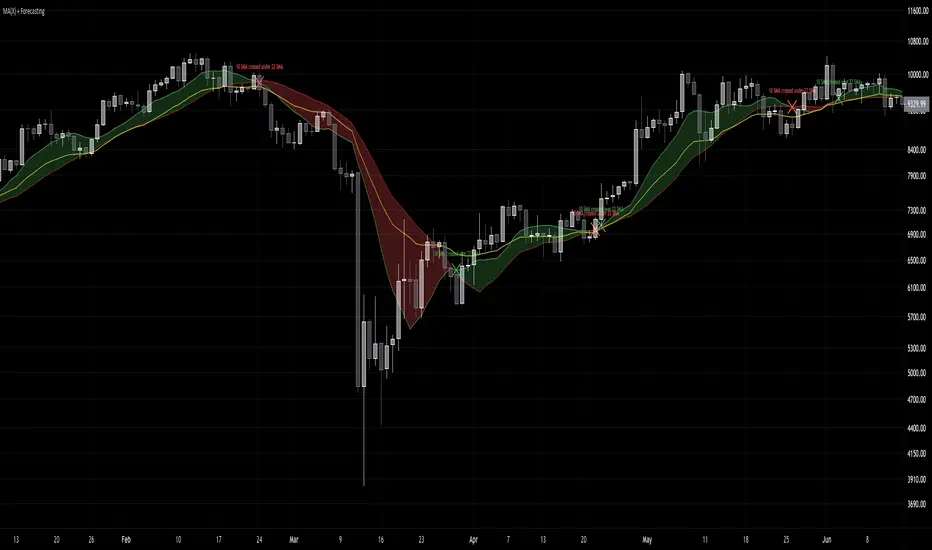
MA(X) + ForecastingSimply put, MA(X) + Forecasting is a moving average cross visualizer which allows the end-user to enter two user defined moving averages, each with their own length, source, and type, to create the visualized ribbon, as well as the option for an additional three separate moving averages, all with their own length, source, and type enabling MA(X) the flexibility to be used for any one of your favorite moving average strategies or in conjunction with another for added confluence.
Additionally, MA(X) also has a built in moving average ‘Forecasting’ feature, which calculates and projects the trajectory of each moving average. For added flexibility, the forecasting feature has 4 bias settings, (Neutral, Bullish, Bearish, Auto). The first three bias settings are rather self explanatory, and the “Auto” bias setting will in a nutshell automatically determine the current market cycle, and then apply the correct bias setting to use.
By default, the indicator is setup with the settings for the Daily SMA strategy ’10 SMA + 22 SMA’ as well as the Daily EMA+SMA strategy “21 EMA”, but can be used on any timeframe with any settings needed.
Enjoy!
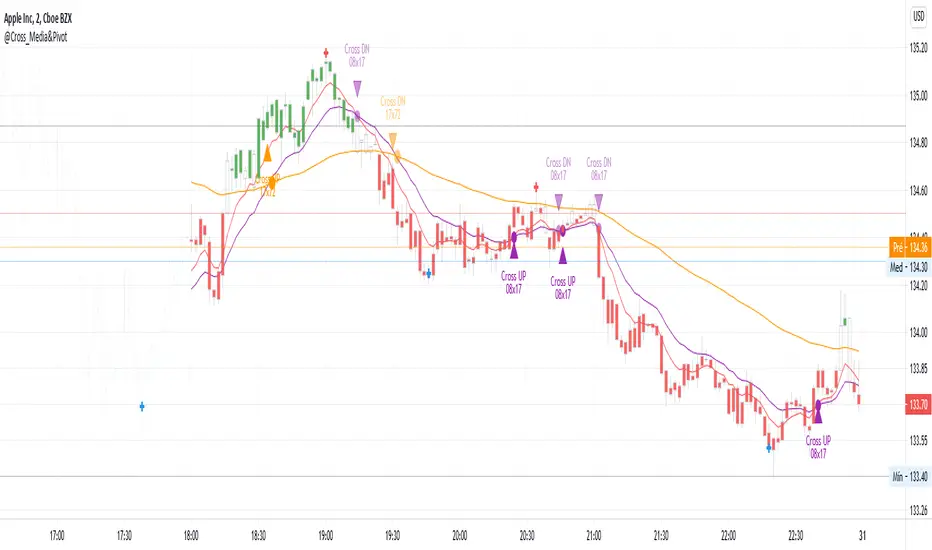
@Cross_Media&Pivot&TRADE_Entry_and_ExitThis script uses the functions plot(), cross(), plotcandle(), pivothigh() and pivotllow(). You can see the candles in the color green, above EMA 72 (Exponetional Move Average), and the color red, below EMA72. You can identify the position of the crossing UP and DOWN of the EMA 08 x EMA 17, EMA 17 x EMA72. You can identify the TRADE ENTRY points with the pivot high and TRADE EXIT with the pivot Low.
Bjorgum RSIRSI output signals are displayed with color change to reflect the plotted value. This makes evaluating RSI conditions require but a glance.
RSI momentum buy signals are given on the cross of the 50 level, whereas sell signals are given on a fall below.
Default values a 5 period RSI which gives more timely entrances and exits for swing traders. This can be adjusted to the typical 14 period if the viewer desires slower signals.
Bullish and bearish area is shaded to accentuate the signal to the eye.
Excellent results can be found when coupling BJ RSI, with BJ TSI, and the reversal system using all 3 as a complete together simultaneously
Default color changes are plotted as a recorded value falls within the following levels:
RSI < 30 = green
RSI 30-50 = red
RSI 50-70 = blue
RSI 70-80 = yellow
RSI 80-90 = orange
RSI 90-100 = white hot

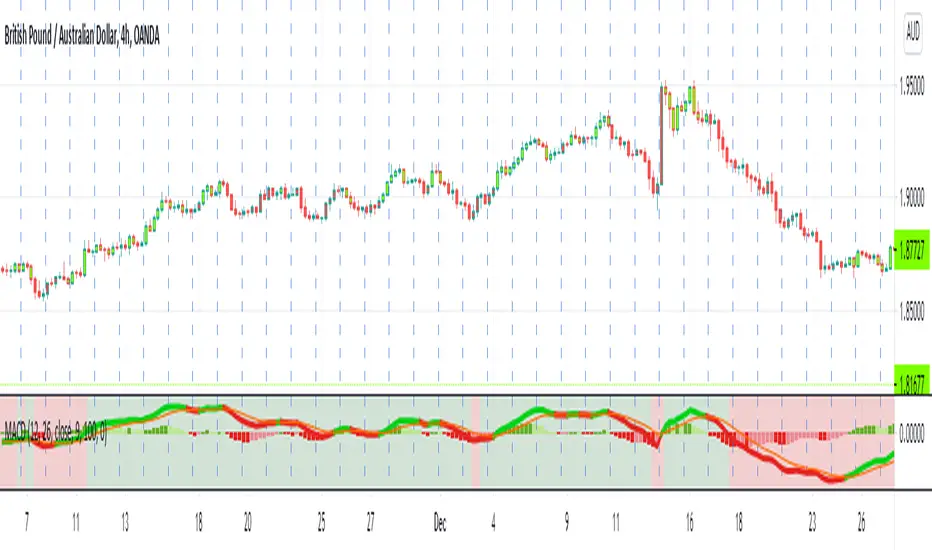
MACD with 3 strategiesMACD WITH 3 STRATEGIES
- Macd line change colour when cross the signal line
- Background Color change colour based on a moving average, on settings the value of the moving average can be changed 50,100,150,200
- Strategy one based on Macd lines with bar changing colours
- Strategy two based on Macd lines but with a different method
- Strategy three based on two other trending indicators
This indicator can be used to spot trends and changing of direction of the market and with the bar coloured its easier to identify them.
The strategy one can be used as confirmation of a trend or as changing direction integrated with other indicators like Rsi , Stochastic, Supertrend , Bollinger band, with ema option mode works better.
The strategy two can be use together with the back ground colour: When is red and the candles are red can be identified as strong drown trend.
When is green and the candles are green can be identified as strong up trend.
The strategy three can be used after checked the strategy two for more confirmation for a trend.
VERY IMPORTANT WHEN YOU TRY A NEW STRATEGY TEST IT IN A DEMO ACCOUNT FOR AT LEAST 3 MONTHS
Every donations will be devolved to cancer research and you ll have one month free trial.
If you want to purchase this indicator 30% will be devolved to cancer research.
Please leave a comment or message me if you want you have two weeks trial.
Enjoy!

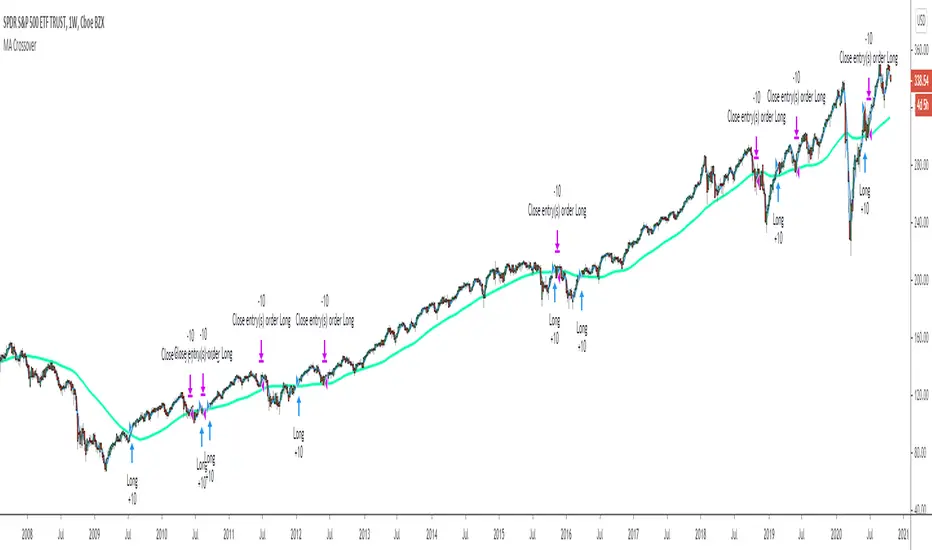
Moving Average Cross Strategy early Closing This is my example for the Moving Average Cross Strategy with early Closing. You can modify the strategy for your individual setup and market.
I tested the strategy in DAX30 and SP55
MA Cross - Multi-Timeframe The MA cross is probably one of my favourite strategies because of its simplicity but it often gets overlooked for more complex strategies.
The original author of this script is ChartArt, I have just added some extra controls and functions which are outlined below. I would just like to add that this is my first published script, everything I have learned about coding has been from studying and tinkering with many of the publicly available scripts on TV so I would like thank all the authors who give out this knowledge so freely!
Updates
- Converted to v4
- Made some graphical changes and provided more control over plots
- Added RMA and VWMA
- Added alerts
Original script can be found here
Cross DoublesThis is a moving average cross script that plots moving averages of moving averages. Easier to find settings with one length instead of two I think.
Use this script for inspiration or find good settings and share them, simply publishing this because I couldn't find it on TradingView yet.
Have a nice day!
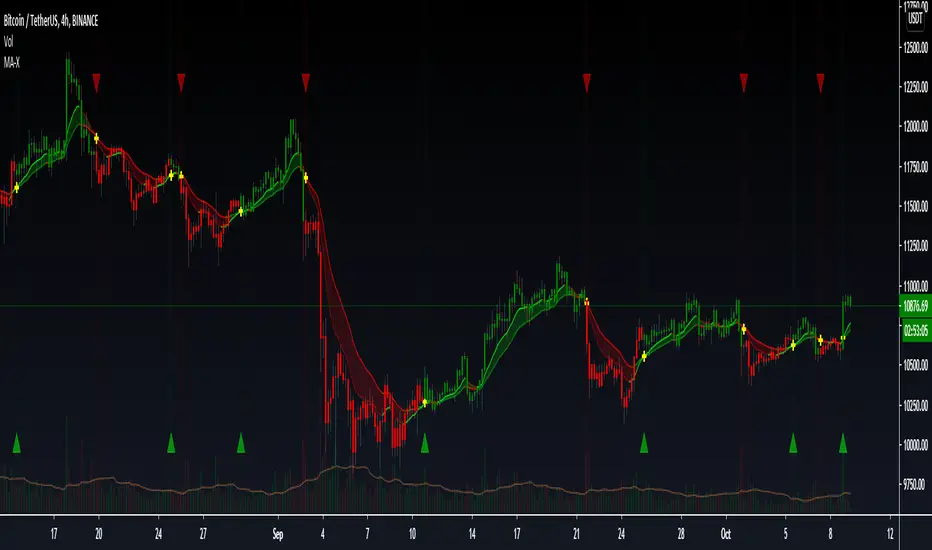
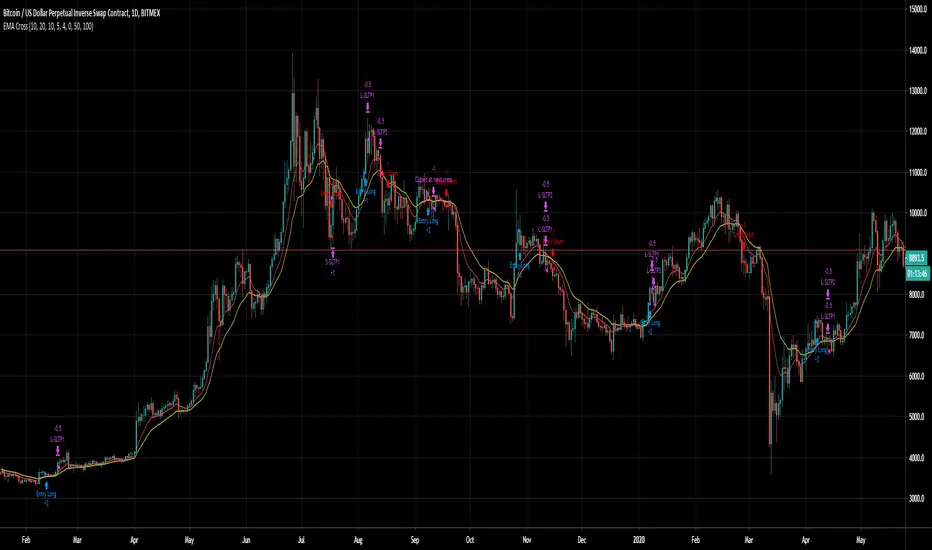
Moving Average CrossNote: This is just an idea, I did not test this for trading.
MA Cross normally uses close as source in the moving averages, this script uses highs and lows as source.
In an uptrend you will see the 20 period high EMA and 50 period low EMA, once they cross, the indicator will switch to 20 period low EMA and 50 period high EMA. This gives it way less fake crosses as you see in the image on BTC.
As i said above, this is just an idea. If you change the settings, they might not cross at all.. so do your own testing.
Hope this code can help someone.

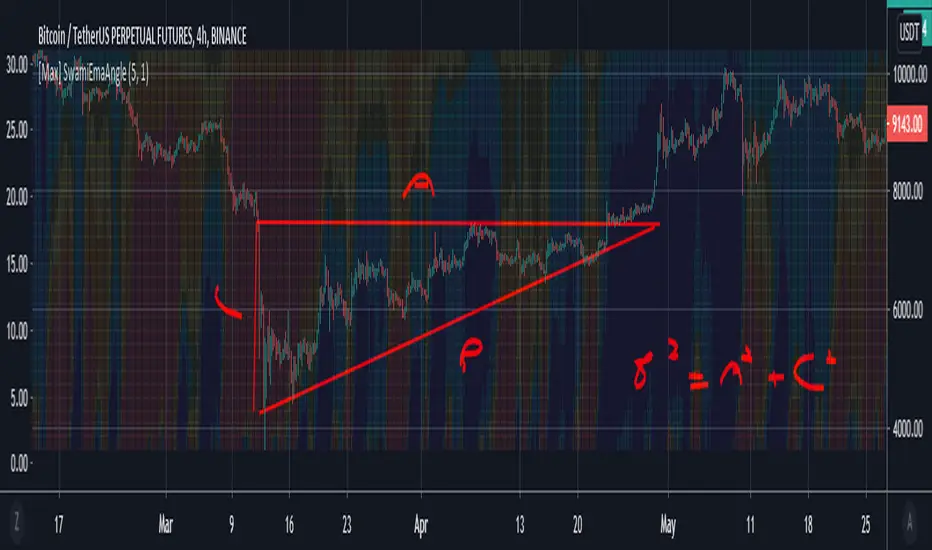
[Max] SwamiEmaCrossIt's a swami chart on emacross
if eman+1 > eman : green when inverse red, when no data yellow
If you have any idear on swamichart implementation feel free to ask.
Inspire of RicardoSantos work
Have a nice day
MultiType Shifting Predictive Moving Averages (MA) CrossoverJust 2 Moving Averages with adjustable settings and shifting capability, plus signals and predicting continuations.
At the time of publish these different types of MAs are supported:
- SMA (Simple)
- EMA (Exponential)
- DEMA (Double Exponential)
- TEMA (Triple Exponential)
- RMA (Adjusted Exponential)
- WMA (Weighted)
- VWMA (Volume Weighted)
- SWMA (Symmetrically Weighted)
- HMA (Hull)
I'm looking forward to any idea about filtering the signals. Thanks.

EMA Cross
Uses EMA crosses as a signal for entry.
Configurable first TP profit level
Stop moves up to entry after first TP
Option to use ROC and Price Gap as filters to entries
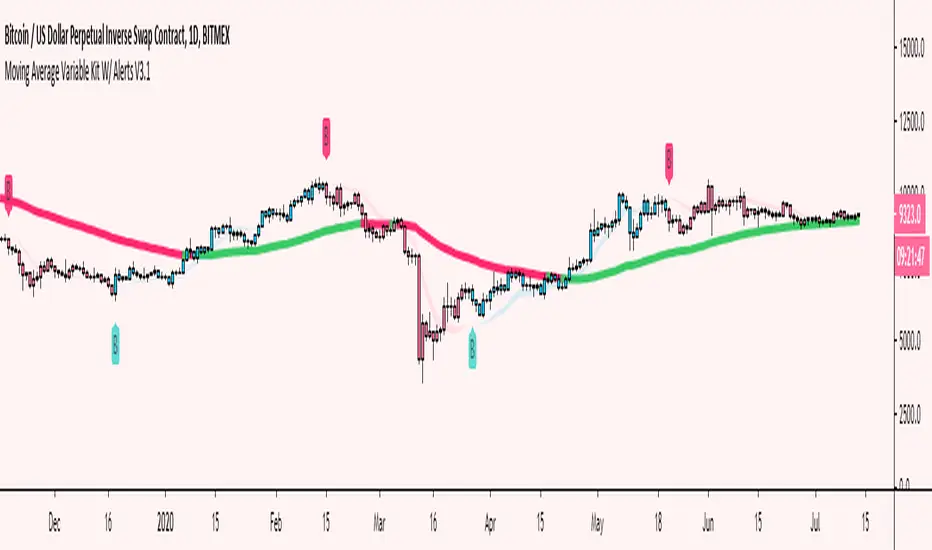
Moving Average Variable Kit W/ Alerts V3 [Moon]Create your own MA system
5 basic kinds of Moving Average types available for now
DEMA
EMA
SMA
TEMA
WMA
Mix and match moving average types and lengths.
Create your own alerts built into Tradingview.
Turn alerts or MAs off or on with 1 click.
Choose visual transparency and alert coloration - everything is customizable.
Trend candles on crossovers.
Choose your MA input source.
Create your own MA cloud or cloud ribbons.
Trend MA coloration on candle or bar interactions.
It really empowers you to experiment and create your own trading system or strategy.
Don't be afraid to use Renko or Heikin Ashi for trend spotting or reversals.
Copy built in exchange bands or indicators for an edge up on the competition or exchange users (these are heavily watched and in my opinion do affect the price action especially on smaller coins like alts).
This is Binance's default kit that you can easily make (7/25/99) SMAs.
Works well on traditional markets or Forex | Should be cross compatible on any asset or timeframe.
Turn off a majority of signals except for "buy" or "sell" alerts. Use these clusters to DCA, short, long or take profit.
Use it to monitor classic "Golden" or "Death" crosses - Set a TV alert to get a notification when it official goes off.
These are just a few of the things you can create. I encourage you to explore further.
Send me a DM if interested.