MA Cross MTF Alert (Miu)This script extends the classic moving average crossover strategy with support for up to 8 user-defined symbols across 4 custom timeframes, combined with a visual and alert system designed for traders who monitor multiple assets simultaneously.
Unlike traditional MA crossover tools, this script enables traders to receive real-time alerts for crossovers across multiple assets and timeframes, even when the script is not actively displayed on the chart — ideal for passive monitoring in multi-asset strategies.
What it does:
This script calculates two customizable moving averages (SMA or EMA) for each selected symbol and timeframe.
It then tracks crossover events:
- Bullish crossover when the fast MA crosses above the slow MA
- Bearish crossunder when the fast MA crosses below the slow MA
On the chart, it also displays the crossover signals for the current symbol and timeframe using color-coded cross icons.
Key features:
- Select SMA or EMA type for both moving averages
- Customize MA lengths and colors
- Works with any asset and timeframe
- Alerts include symbol and timeframe info for easy identification
How to use:
1) Add the indicator to your chart.
2) Choose the moving average type and lengths.
3) Enable/disable any of the 8 symbols and 4 timeframes.
4) Set up TradingView alerts by clicking “Create Alert” and selecting one of the alert() calls.
5) You will receive a message like:
BTC (1h) | MA Crossover ▲ or ETH (15m) | MA Crossunder ▼
Technical note:
This script uses request.security() to retrieve moving average values from up to 8 different symbols and 4 different timeframes in real time.
Feel free to leave your feedback or suggestions in the comments section below.
Enjoy!
Cross

Pucci Trend EMA-SMA Crossover with TolerancePucci Trend EMA-SMA Crossover with Tolerance
This indicator helps identify market trends and generates trading signals based on the crossover between an Exponential Moving Average (EMA) and a Simple Moving Average (SMA) with an adjustable tolerance threshold. The signals work as follows:
Buy Signal (B) -> Triggers when the EMA crosses above the SMA, exceeding a user-defined tolerance (in basis points). Optionally, a price filter can require the high or low to be below the EMA for confirmation.
Sell Signal (S) -> Triggers when the SMA crosses above the EMA, exceeding the tolerance. The optional price filter may require the high or low to be above the EMA.
The tolerance helps reduce false signals by requiring a minimum distance between the moving averages before confirming a crossover. The price filter adds an extra confirmation layer by checking if price action respects the EMA level.
Important Notes:
1º No profitability guarantee: This tool is for analysis only and may generate losses.
2º "As Is" disclaimer: Provided without warranties or responsibility for trading outcomes.
3º Use Stop Loss: Users must determine their own risk management.
4º Parameter adjustment needed: Optimal MA periods and tolerance vary by timeframe.
5º Filter impact varies: Enabling/disabling the price filter may improve or worsen performance.

Buy/Sell Signals (MACD + RSI) 1HThis is a Pine Script indicator for TradingView that plots Buy/Sell signals based on the combination of MACD and RSI indicators on a 1-hour chart.
Description of the Code:
Indicator Setup:
The script is set to overlay the Buy/Sell signals directly on the price chart (using overlay=true).
The indicator is named "Buy/Sell Signals (MACD + RSI) 1H".
MACD Settings:
The MACD (Moving Average Convergence Divergence) uses standard settings of:
Fast Length: 12
Slow Length: 26
Signal Line Smoothing: 9
The MACD line and the Signal line are calculated using the ta.macd() function.
RSI Settings:
The RSI (Relative Strength Index) is calculated with a 14-period setting using the ta.rsi() function.
Buy/Sell Conditions:
Buy Signal:
Triggered when the MACD line crosses above the Signal line (Golden Cross).
RSI value is below 50.
Sell Signal:
Triggered when the MACD line crosses below the Signal line (Dead Cross).
RSI value is above 50.
Signal Visualization:
Buy Signals:
Green "BUY" labels are plotted below the price bars where the Buy conditions are met.
Sell Signals:
Red "SELL" labels are plotted above the price bars where the Sell conditions are met.
Chart Timeframe:
While the code itself doesn't enforce a specific timeframe, the name indicates that this indicator is intended to be used on a 1-hour chart.
To use it effectively, apply the script on a 1-hour chart in TradingView.
How It Works:
This indicator combines MACD and RSI to generate Buy/Sell signals:
The MACD identifies potential trend changes or momentum shifts (via crossovers).
The RSI ensures that Buy/Sell signals align with broader momentum (e.g., Buy when RSI < 50 to avoid overbought conditions).
When the defined conditions for Buy or Sell are met, visual signals (labels) are plotted on the chart.
How to Use:
Copy the code into the Pine Script editor in TradingView.
Save and apply the script to your 1-hour chart.
Look for:
"BUY" signals (green): Indicating potential upward trends or buying opportunities.
"SELL" signals (red): Indicating potential downward trends or selling opportunities.
This script is simple and focuses purely on providing actionable Buy/Sell signals based on two powerful indicators, making it ideal for traders who prefer a clean chart without clutter. Let me know if you need further customization!

MicuRobert EMA Cross StrategyThis is a repost of a old strategy that cant be updated anymore, it was a request for a user made in Oct, 6, 2015
Here's a possible engaging description for the tradingview script:
**MicuRobert EMA Cross V2: A Powerful Trading Strategy**
Join the ranks of successful traders with this advanced strategy, designed to help you profit from market trends. The MicuRobert EMA Cross V2 combines two essential indicators - Exponential Moving Average (EMA) and Divergence EMA (DEMA) - to generate buy and sell signals.
**Key Features:**
* **Trading Session Filter**: Only trade during your preferred session, ensuring you're in sync with market conditions.
* **Trailing Stop**: Automatically adjust stop-loss levels to lock in profits or limit losses.
* **Customizable Trade Size**: Set the size of each trade based on your risk tolerance and trading goals.
**How it Works:**
The script uses two EMAs (5-period and 34-period) to identify trends. When the shorter EMA crosses above the longer one, a buy signal is generated. Conversely, when the shorter EMA falls below the longer one, a sell signal is triggered. The strategy also incorporates divergence analysis between price action and the EMAs.
**Visual Aids:**
* **EMA Plots**: Visualize the two EMAs on your chart to gauge market momentum.
* **Buy/Sell Signals**: See when buy or sell signals are generated, along with their corresponding entry prices.
* **Trailing Stop Lines**: Monitor stop-loss levels as they adjust based on price action.
**Get Started:**
Download this script and start trading like a pro! With its robust features and customizable settings, the MicuRobert EMA Cross V2 is an excellent addition to any trader's arsenal.
~Llama3

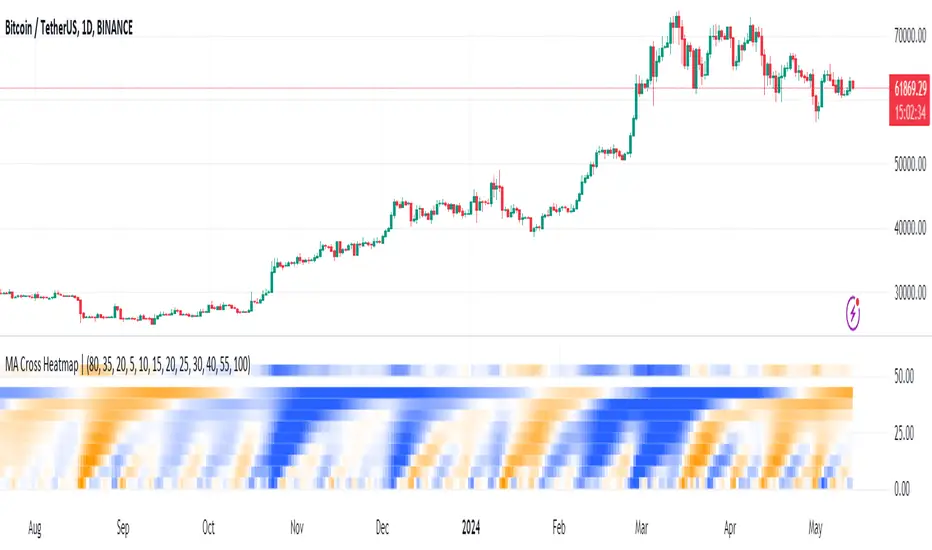
MA Cross HeatmapThe Moving Average Cross Heatmap Created by Technicator , visualizes the crossing distances between multiple moving averages using a heat map style color coding.
The main purpose of this visualization is to help identify potential trend changes or trading opportunities by looking at where the moving averages cross over each other.
Key Features:
Can plot up to 9 different moving average with their cross lengths you set
Uses a heat map to show crossing distances between the MAs
Adjustable settings like crossing length percentage, color scheme, color ceiling etc.
Overlay style separates the heat map from the price chart
This is a unique way to combine multiple MA analysis with a visual heat map representation on one indicator. The code allows you to fine-tune the parameters to suit your trading style and preferences. Worth checking out if you trade using multiple moving average crossovers as part of your strategy.
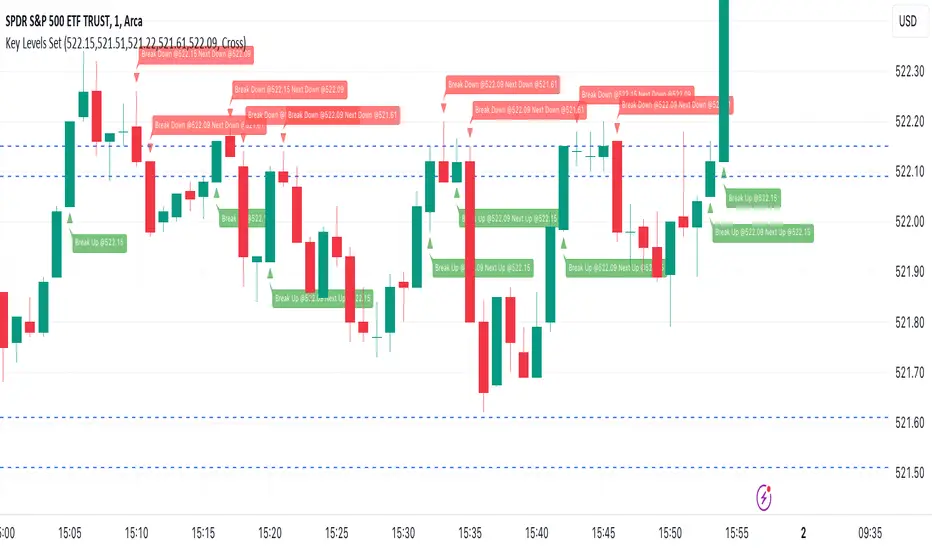
Key Levels SetKey Levels Set allows to set key levels as comma separated values, and to detect breaks to the downside and/or upside, taking into account potential gaps between bars.
This indicator can be very handy if you, like me, rely on some key levels that you identified as potential support/resistance from some technical analysis.
Features
+ It allows for key levels to be set as comma separated values.
+ It draws key levels on chart.
+ On close, it identifies highest key level that has been broken to the upside, if any.
+ On close, it identifies lowest key level that has been broken to the downside, if any.
+ In Cross mode, as bar is printing, it also detects highest/lowest key levels being broken to the upside/downside between bar high and low, if any.
+ It plots and labels breaks with current level and next level information.
+ It includes alerts from breaks on close.
+ It includes turn on/off functionality.
Settings
+ {Prices} checkbox: turns on/off entire functionality
+ {Prices} text field: comma separated values for key levels
+ {Breaks on} checkbox: turns on/off breaks detection functionality
+ {Breaks on} options: selects Close or Cross mode
Price Cross Time Custom Range Interactive█ OVERVIEW
This indicator was a time-based indicator and intended as educational purpose only based on pine script v5 functions for ta.cross() , ta.crossover() and ta.crossunder() .
I realised that there is some overlap price with the cross functions, hence I integrate them into Custom Range Interactive with value variance and overlap displayed into table.
This was my submission for Pinefest #1 , I decided to share this as public, I may accidentally delete this as long as i keep as private.
█ INSPIRATION
Inspired by design, code and usage of CAGR. Basic usage of custom range / interactive, pretty much explained here . Credits to TradingView.
█ FEATURES
1. Custom Range Interactive
2. Label can be resize and change color.
3. Label show tooltip for price and time.
4. Label can be offset to improve readability.
5. Table can show price variance when any cross is true.
6. Table can show overlap if found crosss is overlap either with crossover and crossunder.
7. Table text color automatically change based on chart background (light / dark mode).
8. Source 2 is drawn as straight line, while Source 1 will draw as label either above line for crossover, below line for crossunder and marked 'X' if crossing with Source 2's line.
9. Cross 'X' label can be offset to improve readability.
10. Both Source 1 and Source 2 can select Open, Close, High and Low, which can be displayed into table.
█ LIMITATIONS
1. Table is limited to intraday timeframe only as time format is not accurate for daily timeframe and above. Example daily timeframe will give result less 1 day from actual date.
2. I did not include other sources such external source or any built in sources such as hl2, hlc3, ohlc4 and hlcc4.
█ CODE EXPLAINATION
I pretty much create custom function with method which returns tuple value.
method crossVariant(float price = na, chart.point ref = na) =>
cross = ta.cross( price, ref.price)
over = ta.crossover( price, ref.price)
under = ta.crossunder(price, ref.price)
Unfortunately, I unable make the labels into array which i plan to return string value by getting the text value from array label, hence i use label.all and add incremental int value as reference.
series label labelCross = na, labelCross.delete()
var int num = 0
if over
num += 1
labelCross := label.new()
if under
num += 1
labelCross := label.new()
if cross
num += 1
labelCross := label.new()
I realised cross value can be overlap with crossover and crossunder, hence I add bool to enable force overlap and add additional bools.
series label labelCross = na, labelCross.delete()
var int num = 0
if forceOverlap
if over
num += 1
labelCross := label.new()
if under
num += 1
labelCross := label.new()
if cross
num += 1
labelCross := label.new()
else
if cross and over
num += 1
labelCross := label.new()
if cross and under
num += 1
labelCross := label.new()
if cross and not over and not under
num += 1
labelCross := label.new()
█ USAGE / EXAMPLES

Multi-Symbol Cross Indicator Template - Unleash Your Potential!Unlock your full trading potential with this powerful and versatile Multi-Symbol Cross Indicator Template! This script is designed to make you stand out from the crowd by enabling you to monitor multiple symbols on a single chart for specific events, such as a Golden Cross or Death Cross. With its high adaptability to include various technical indicators, you're in complete control of your trading decisions and market analysis.
By using the built-in request.security function, this template fetches data for your chosen symbols from the selected exchange and calculates the conditions (e.g., moving average crossovers) for each symbol. Although the current implementation focuses on Golden Crosses and Death Crosses, the sky is the limit when it comes to modifying the script to incorporate other technical indicators such as RSI, MACD, or Bollinger Bands.
You, as a discerning trader, can easily customize the script by selecting your preferred exchange and symbols through input options. This flexibility allows you to monitor your favorite markets without the need for any direct code modification, giving you the ultimate adaptability for various trading strategies and market analysis purposes.
Remember, this script is more than just an example or template; it's the key to unleashing your inner trading genius. While it's not intended to be a standalone trading strategy, it serves as the foundation for you to build upon and create your own customized multi-symbol indicators or strategies. You are awesome, and with this Multi-Symbol Cross Indicator Template, there's no doubt that you're on the path to achieving great success in your trading journey!

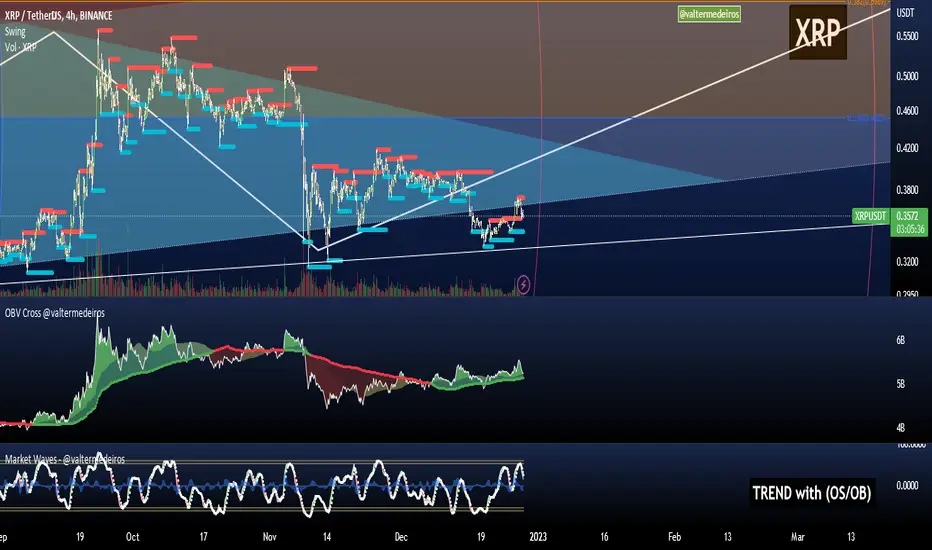
On Balance Volume CrossoversCheck on balance volume but with crossover. You can choose the smoothing method, which is set by default to use the Volume Weighted Moving Average (bringing volume to the equation is always a good idea) but you can change to SMA, MA, EMA, ...
Hope you guys enjoy it and don't forget to rate it up! :)
I plan to include % from 0-100 OBV in here later! Stay tuned.
Feedback is cool.
RedK Magic Ribbon JeetendraGaurCross Over Strategy
Moving average Cross Over Strategy
Please use in 1 minute Expiry

Crossover Alerts for Yesterday O/H/L/C , Today Vwap [Zero54]This is a very simple script/indicator that trigger alerts every time the script triggers the following conditions.
1) Script crosses yesterday's (previous day's) high
2) Script crosses yesterday's (previous day's) low
3) Script crosses yesterday's (previous day's) open
4) Script crosses yesterday's (previous day's) close
5) Script crosses today's vwap.
I developed this to keep track of the scripts I follow and I find it useful. Hope you will find it useful too.
Steps to use:
1) Open the ticker for which you want to set the alerts.
2) Add this indicator to the chart.
3) Right Click on the text and set choose "Add Alert"
4) After you have done with setting up the alert, feel free to remove the indicator from the chart. It is not necessary for the indicator to be added in the chart in order for it to work.
5) Repeat 1-4 for all the scripts for which you want to set the alerts.
Be advised: During market open, if you have set alerts for multiple scripts, a tsunami of alerts may be triggered.
If you like this alert indicator, please like/boost it. Feel free to re-use this code however you may wish to. Cheers!

Channel SurfingThis is my Channel Surfing indicator. It fires Buy and Sell signals based on multiple conditions. You can use EMAs or LSMAs. You will have to check the box of which moving averages to use once you add it to the chart. It plots EMAs or LSMAs using the different sources Close, Low, and High as the channel to surf. It fires a Buy signal if price crosses the channel up and if there is a pullback into the channel followed by a breakout to the upside. It fires a Sell signal if price crosses the channel down and if there is a pullback into the channel followed buy a breakdown to the down side. I find it works great on the 5 minute SPY chart and the 1 minute chart of ES with the default settings when scalping. You are able to switch between 2 different channels using LSMAs or EMAs. The EMAs has an optional LSMA slope filter for getting rid of some false signals. Let me know if you guys find any other settings or ways to use this and as always I hope it helps.

BTC Hashrate with smoothingBTC Hashrate with smoothing - thanks to the recent integration of IntoTheBlock data into Tradingview, we can now effortlessly show Hashrate data on our chart.
One popular use for Hashrate is to buy when the 30 day moving average crosses above the 60 day moving average, signifying that miner capitulation is over and recovery has started.
Definition
The Bitcoin hash rate is the number of times per second that computers on the Bitcoin network are hashing data to verify transactions and perform the encryption that secures the network. The hash rate is an indicator of how healthy the Bitcoin network is at any given time, and is driven primarily by difficulty mining and the number of miners. Generally, a high hash rate is considered a good thing.
More precisely, the Bitcoin hash rate is the number of times per second that computers on the Bitcoin network are hashing data to verify transactions and perform the encryption that secures the network.

Actieve Inversiones EMABBOL by EDOHEN
EMABBOL includes these indicators:
- triple emas (9,21,50)
- Bollinger Bands
- Also includes buying or selling signals
The following strategy is based on ema crosses and bollinger ma crosses, the Bollinger band gives us the target we could expect from our trades, using the upper and lower bands.
Trading criteria
Buy : Price crosses over the triple emas and also crosses under the Bollinger band ema. Looking for 3:1 PnL
Sell : Price crosses under the triple emas and also crosses under the Bollinger band ema. Looking for 3:1 PnL
Stop Loss Tips : set the SL above the crosses if Selling, below the crosses if buying
Take Profit Tips : set the TP below the Bollinger's lower Band band if Selling, or above the Bollinger's upper Band band if Buying

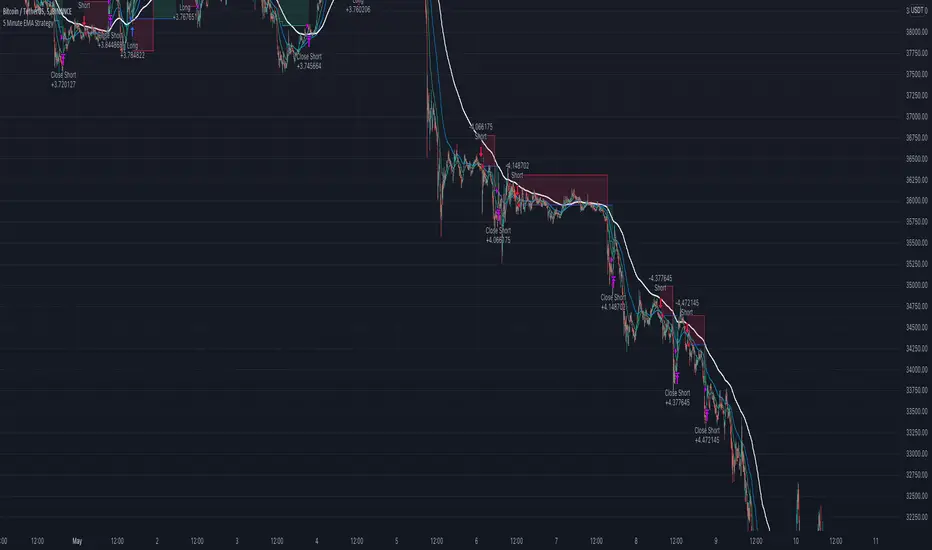
5 Minute EMA Cross StrategyThis simple Fast/Slow EMA cross strategy is designed to be used with Alertatron to place limit orders and use a trailing stop/take profit.
Features:
Indicators when the fast EMA crosses the slow EMA
Trailing Stop/Take Profit
Bar look back for placing limit order
Macro EMA filter to only trade with the macro trend
FunctionIntrabarCrossValueLibrary "FunctionIntrabarCrossValue"
intrabar_cross_value(a, b, step) Find the minimum difference of a intrabar cross and return its median value.
Parameters:
a : float, series a.
b : float, series b.
step : float, step to iterate x axis, default=0.01
Returns: float

investor_EMA Three-CrossI produced a strategy using short term ema intersections.
A short-term low capital buy signal creates a yellow background after the red background color. Here, profit should be taken by following the trend.
When the green background is formed, positions can be increased, the price will lead us to a safer market.
Exposures can be turned off in the formation of a red background.
The pink zigzag average always shows the Weekly ma9. Price should be followed above the MA9 weekly average which will allow us to see medium term positive price movements.
As a result, the background colors will present a more understandable graph in price movements up and down movements.
The above strategy will generate signals as long and short.
You can make the coloring you want from the settings section.

investor_RSI Two-CrossThe RSI 14/50 cross is an oscillator that shows the market direction.
Positive price movements can be expected when the small value crosses the high value.
Negative price movements can be expected when the small value crosses the high value to the downside.
You can make the coloring you want from the settings section.

T/K CROSSSimple crossing of the Tenkan & Kijun Sen indicated by a "Cross". Surfed Tradingview for it, but did not find it, so decided to make one. Does NOT include the Ichimoku Cloud & the Chikou

Moving_average-10/5This moving average contain three moving averages , where two moving average corssover work and 1 moving average corssover on candle
when candle cross above or below moving average 10 or 5 its gives signals buy or sell ....
not work in ranging market .
backtest first before use in real trading for study how its work on chart.
thank you

Ichimoku CrossThis is a trend analysis indicator based on Ichimoku
this indicator splits the chart into :
"Buy Phase" where KijunSen > TenkanSen with "Green color"
"Sell Phase" where KijunSen < TenkanSen with "Red color"
"Cross Phase" where KijunSen = TenkanSen
Close of each candle above or below KijunSen and TenkanSen determine the strength of the trend
and is shown by 3 different green colors for Bullish Trends and 3 different red colors for Bearish Trends .

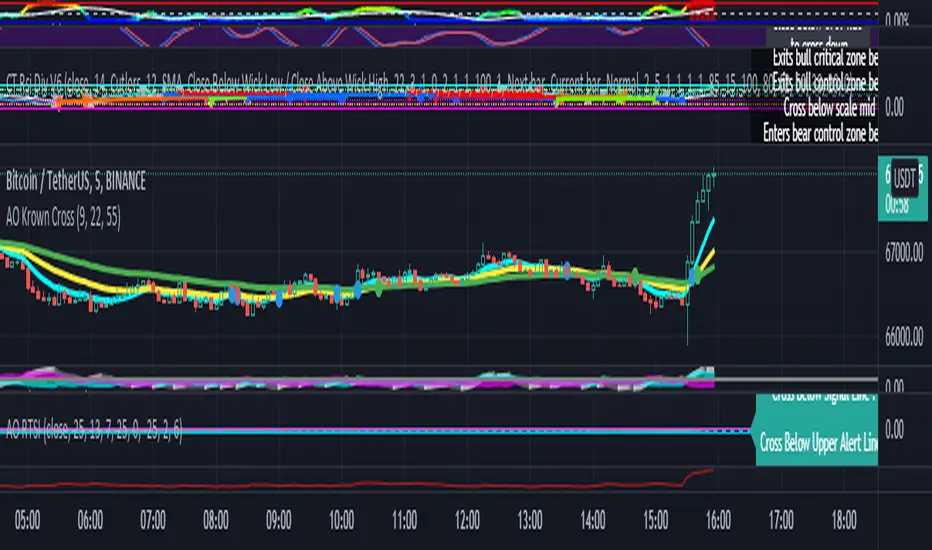
AO Krown Cross
This is a simple script to add alerts to 3 EMA's ie 9,21,55 based on the Krowns Cross Strategy
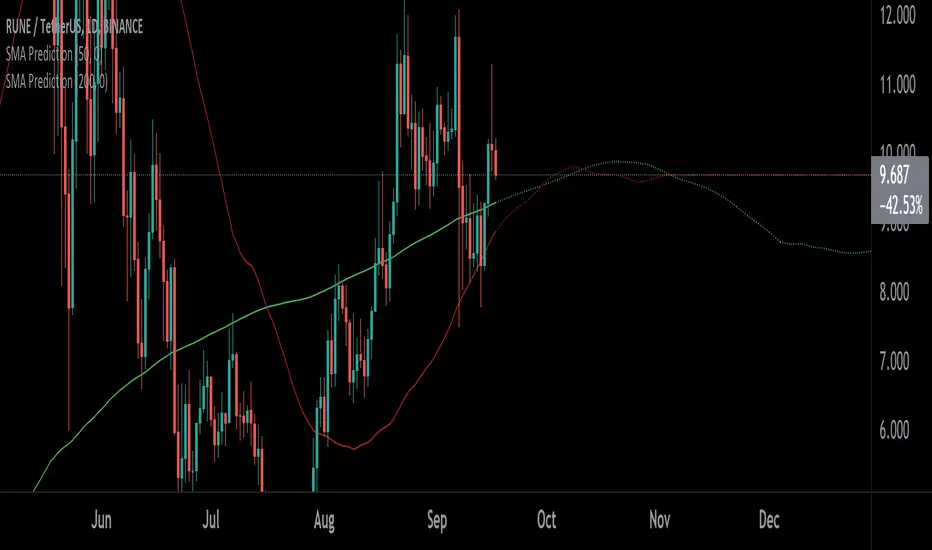
SMA PredictionThis indicator predicts future moving average (SMA) values assuming the prices remains at configured level (-50% to +50%).
It can be used to predict golden/death crosses as well - when two of these indicators are on - one configured for length 50 and one for length 200.