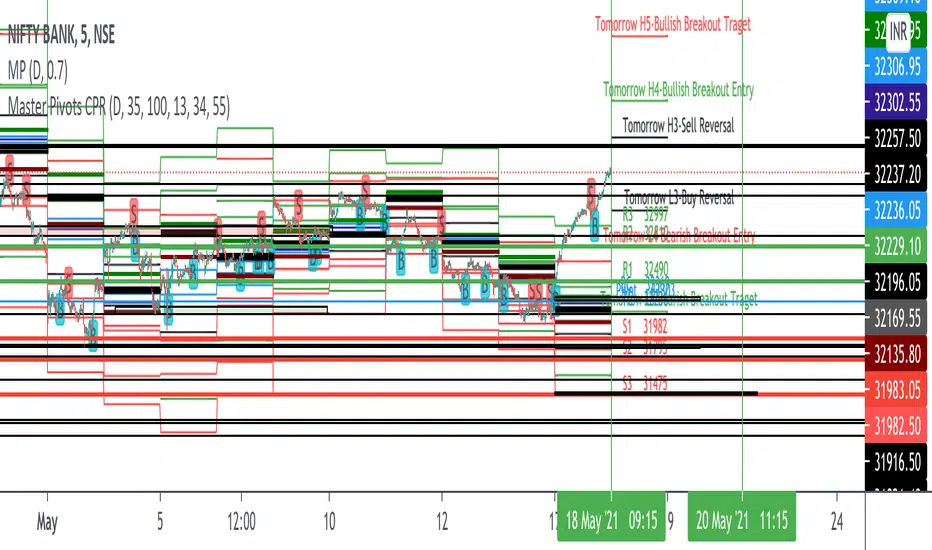
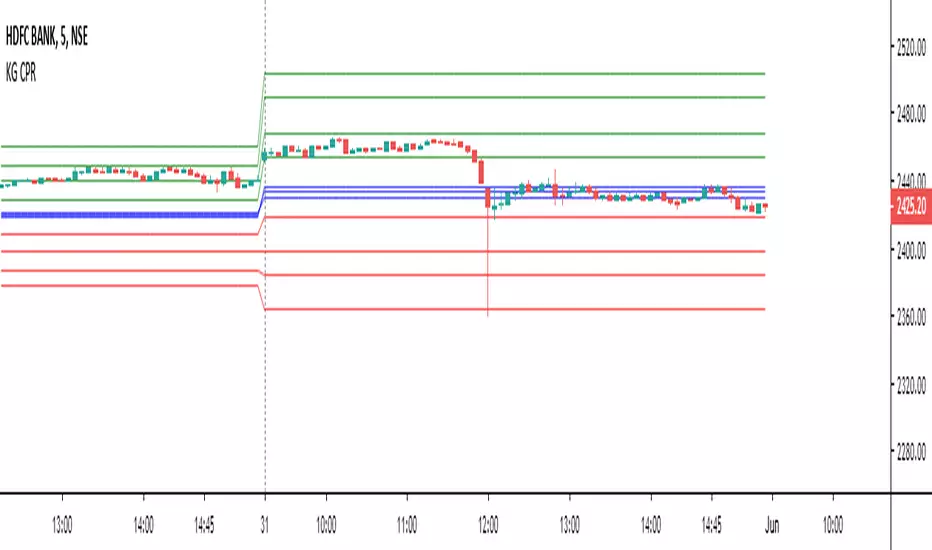
Master Pivots (CPR)This helps in monitoring the support and resistance of the current day and plan for tomorrow's support and resistance. The formula for creating the indicator is as below.
Pivot Point (P) = (High + Low + Close)/3
Support 1 (S1) = (P x 2) - High
Support 2 (S2) = P - (High - Low)
Resistance 1 (R1) = (P x 2) - Low
Resistance 2 (R2) = P + (High - Low)
Floor Pivots are one of the classic pivot ranges and helps us in trading based on pivot values. This indicator that I have built is also capable of predicting tomorrow's support and resistance up to 3 levels i.e. R1, R2, R3 and S1, S2 and S3. This is the only indicator available in trading view which does the same. Thats the only reason of making a separate indicator.
In this indicator we have also added some symbols to identify the reversal patterns based on candle. This is best if used in 15 min candle. This plots engulfing pattern, shooting star, hammer and bullish and bearish reversals.
Please use it and provide feedback for changes. If i would change anything it would be available automatically anyway.
I have not added Fibonacci Pivots as its generally available in many sites out of box. How ever if you want to code you can use the below formula.
Pivot Point (P) = (High + Low + Close)/3
Support 1 (S1) = P - {.382 * (High - Low)}
Support 2 (S2) = P - {.618 * (High - Low)}
Support 3 (S3) = P - {1 * (High - Low)}
Resistance 1 (R1) = P + {.382 * (High - Low)}
Resistance 2 (R2) = P + {.618 * (High - Low)}
Resistance 3 (R3) = P + {1 * (High - Low)}
CPR
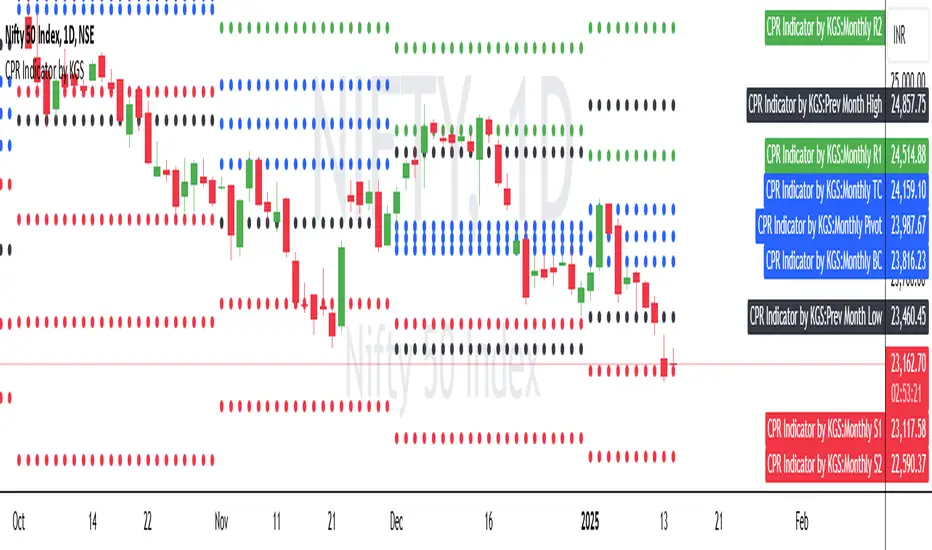
CPR with Pivot Levels - CPR by KGSThis script is based on Secret of Pivot Boss book by Frank Ochoa. Suitable for Intraday Trading.
You can view Daily timeframe cpr/support/resistance.
You can view Weekly timeframe cpr/support/resistance.
You can view Monthly timeframe cpr/support/resistance.
You can also view Previous Day High/Low.
You can also view Previous Week High/Low.
You can also view Previous Month High/Low.
You can also turn on/off as per your wish.

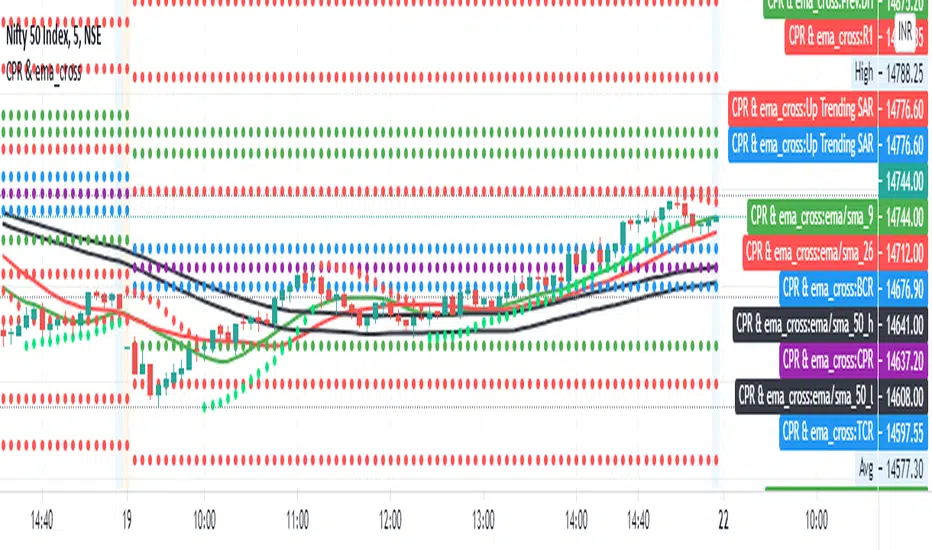
CPR with ema_crossThis indicator will combination of ema cross over 9,26 and Central Pivot Range(CPR) with resistance 1, resistance 2, support 1 and support 2

CPR with Pivot LevelsWe recommend some preconditions for Intraday Trading Strategy with CPR (Central Pivot Range)
Rules For BUY Setup with CPR
1) Today's Pivot Level Should be higher than Previous Day's Pivot Level
2) The previous day's close should be near day high.
Rules For SELL Setup with CPR
1) Today's Pivot Level Should be lower than Previous Day's Pivot Level
2) The previous day's close should be near day low.
CPR or central pivot range is the best tool available for the trader to see the price base indicator. You can use this tool i.e CPR (central pivot range) to check the price indicator in the stock market. You know the price of shares sometimes goes up or sometimes goes down in the stock market. So it will be best to stay updated and know it before the time the share market/stock market fall or rises.

Pivot Point Std With CPR,2 EMA,MW S R,P Day H L - by AnanthPivot Point Std With CPR,2 EMA,Monthly Weekly Support Resistance,Previous Day High and Low - by Ananth

CPR WidthThe indicator shows the width of the Central Pivot Range. Frank Ochoa call it It Pivot Range Histogram in his book.
Use it in conjunction with the Central Pivot Range indicator.
Below is the interpretation of the reading.
CPR Width > 0.5 - Sideways or Trading Range Day,
CPR Width > 0.75 - increases the likelihood of sideways trading behavior,
CPR Width < 0.5 - Trending type of day,
CPR Width < 0.25 - increases the likelihood of a trending market.
The above reading only increases the likely-hood of the possibility and not always right.

The Multi-day Central Pivot RangeThe indicator is a Multi-day CPR.
It shows CPR range as per yesterday's HLC and also CPR range for last n number of trading sessions.
For example: If you mention the value as two in Multi-day CPR (blue color) then it calculates the CPR using HLC of the last two trading sessions.
Also, the daily CPR is designed in such a way to highlight Virgin CPR (purple color) separately from the normal CPR(fuchsia color) .

The Golden PivotsThe Golden Pivots indicator is a combination of the following:
1. Central Pivot Range
2. Floor Pivots
3. Camarilla Pivots
4. Monthly, Weekly, Daily Highs and lows
5. Candlestick Setups
All the pivot calculations are based on Secret of Pivot Boss book by Frank Ochoa.
One can also view tomorrow's central pivot range by today end of the day.

5PRBThis script will plot the support and resistance levels calculated based on previous five days OHL data. Apart from the resistance and support levels, this script also plots the pivots for BUY and SELL trigger points.

Pivots With CPR,Moving Average and VWAP - by AnanthThis indicator is a combination of Pivot points with CPR, Moving Average and VWAP.

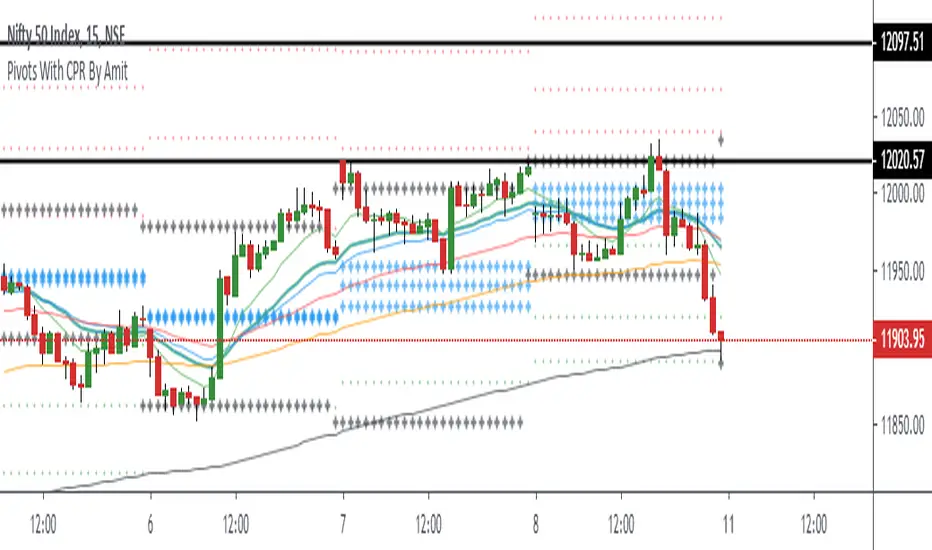
Pivots With CPR By AmitPivot With CPR combination with Previous Day High Low And Also combine the ema for trend confirmation

Pivot Points CPR with M,W,D High/lowThis script is based on Secret of Pivot Boss book by Frank Ochoa. Suitable for Intraday Trading.
You can view Daily timeframe cpr/support/resistance.
You can view Weekly timeframe cpr/support/resistance.
You can view Monthly timeframe cpr/support/resistance.
You can also view Previous Day High/Low.
You can also view Previous Week High/Low.
You can also view Previous Month High/Low.
You can also turn on/off as per your wish.
Updated Floor Pivots @scorpiomanojFRMThis features intraday pivots for Indian markets.
The total trading time per day is 375 minutes.
This is bifurcated into 3 zones of 125 minutes each.
Pivots constructed based on prior 125 minutes which are called intraday pivots.
These intraday pivots provide key clues on the possible direction of the markets.
These can be used as supports and resistances in conjunction with higher time frame pivots for scalping / intraday trades.

Expanded Floor Pivot Points UPDATEDThis Central Pivot Range is based on Pivot Boss book from Frank Ochao. All Resistance/Support/CPR width has been reduced for clear view
Quadruple Moving Averages Plus Smoothed Moving AveragePrincipal moving averages and an approximation the institutional (smoothed) moving average.
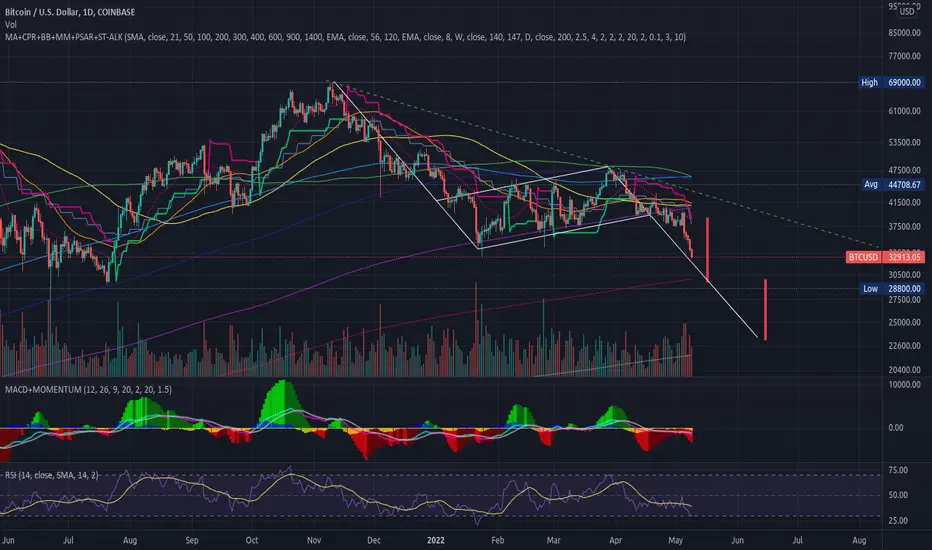
Price-Actionclassic patterns.
daily charts.
CPR-
Green+level=buy
red+level=sell
pinbar
green pinbar+level=buy
red pinbar+level=sell
green ppr+level=buy
ppr-
red ppr+level=sell
IB- and OB-
green IB/OB+level=buy
red IB/OB+level=sell
third bar
green third bar+green cpr+level=buy
red third bar+redcpr+level=sell
3 candles green = buy, tp30 pips(gbpusd,gbpjpy)
3 candles red = sell, tp30 pips. (gbpusd,gbpjpy)
