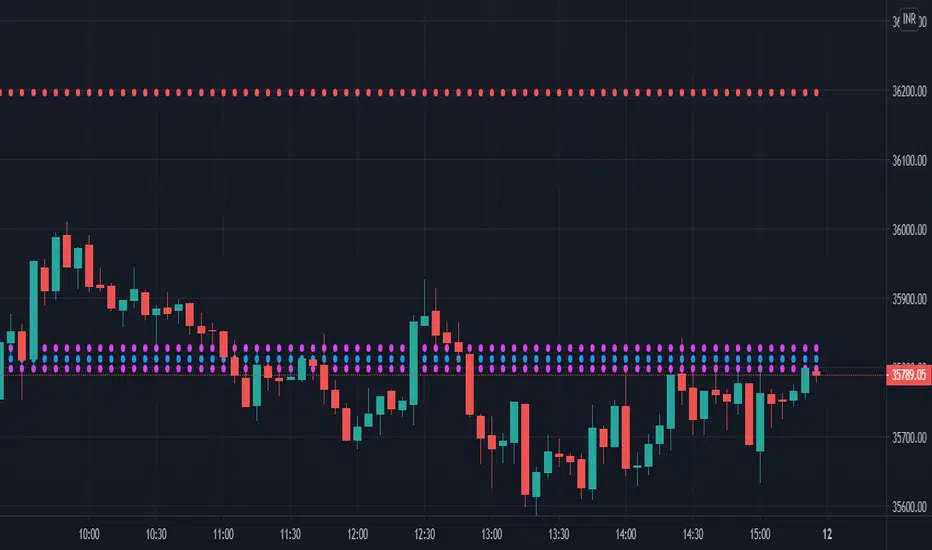
Developing Pivot Range [Swastik]This is the developing cpr indicator made by Swastik.
It shows how the cpr is developing as the day is progressing.
The colour of the range is red when tc is below bc and green when tc is above bc .
While calculating the value of cpr , the high is the high from starting of the session and low is the low from starting of the session till that specific candle.
This also shows that the trend is developing.
If the colour is red and the range starts widening, it means downtrend has started to develop and
when the colour is green and range starts widening, it means uptrend is developing.
CPR

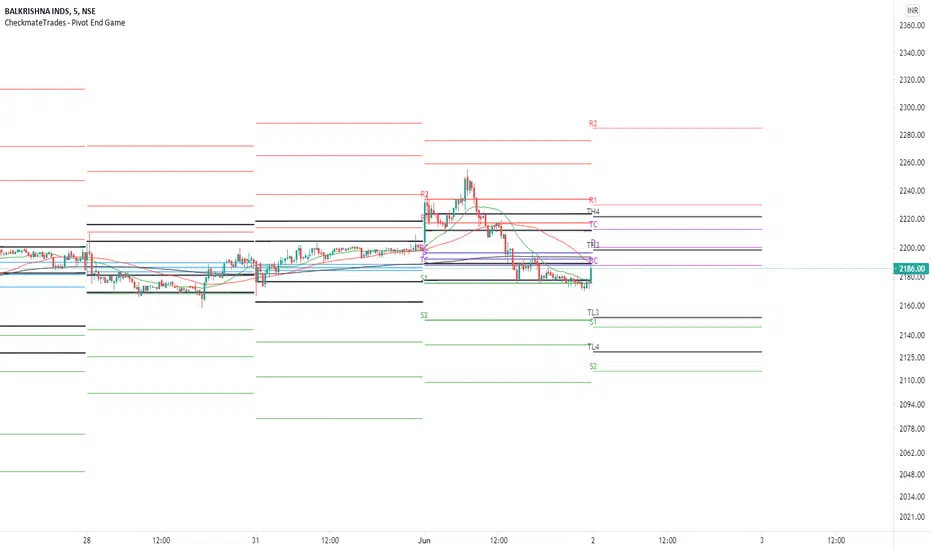
CheckmateTrades - Pivots End GameThis indicator is based on the Pivot study. Traders will be able to plot CPR, Standard floor pivots as well as Camarilla Pivots on multiple timeframes.
Why pivots from multiple timeframes are relevant and included in this one indicator?
We can analyse pivots on multiple timeframes for different trading setups. As in, Daily floor pivots are best suited for analysing the market trend for Day trading. Similarly, Weekly and Monthly floor pivots can be analysed for Swing and positional trading entries. Whereas yearly pivot is best suited for trend analysis for investment purpose.
What is the relevance of plotting tomorrow's pivot level in advance?
Pivot are calculated based on the price happened on a previous day. And hence trader can plot tomorrow pivots in advance to shortlist stocks for tomorrow's trading session.
TimeFrames Available to traders are –
1. Daily
2. Weekly
3. Monthly
A) Daily Pivots
Present Day –
1. Trader can plot Daily CPR
2. Trader can plot Daily R1, R2, R3 and R4 pivot resistance levels
3. Trader can plot Daily S1, S2, S3 and S4 pivot support levels
4. Trader can plot Daily Camarilla levels
Future Day –
1. Trader can plot Tomorrow CPR
2. Trader can plot Tomorrow R1, R2, R3 and R4 pivot resistance levels
3. Trader can plot Tomorrow S1, S2, S3 and S4 pivot support levels
4. Trader can plot Tomorrow Camarilla levels
5. Previous Day High and Low
B) Weekly Pivots
Present Week –
1. Trader can plot Present week CPR
2. Trader can plot Present week R1, R2, R3 and R4 pivot resistance levels
3. Trader can plot Present week S1, S2, S3 and S4 pivot support levels
4. Trader can plot Present week Camarilla levels
Next Week –
1. Trader can plot Next week CPR
2. Trader can plot Next week R1, R2, R3 and R4 pivot resistance levels
3. Trader can plot Next week S1, S2, S3 and S4 pivot support levels
4. Trader can plot Next week Camarilla levels
5. Previous Week High and Low
C) Monthly Pivots
Present Month –
1. Trader can plot Present Month CPR
2. Trader can plot Present Month R1, R2, R3 and R4 pivot resistance levels
3. Trader can plot Present Month S1, S2, S3 and S4 pivot support levels
4. Trader can plot Present Month Camarilla levels
Next Month –
1. Trader can plot Next Month CPR
2. Trader can plot Next Month R1, R2, R3 and R4 pivot resistance levels
3. Trader can plot Next Month S1, S2, S3 and S4 pivot support levels
4. Trader can plot Next Month Camarilla levels
5. Previous Month High and Low
Moreover, I have also included SMA (Simple moving averages) study in this indicator. Trader can add 20,50 & 200 SMA on there charts.
Why is it relevant? Trader can get a visual confirmation of an up-trending or an down-trending move by looking at rising or falling 20 & 50 SMA respectively
Usually in an uptrending stocks. 20 & 50 SMA will move in parallel to each other and will rise upwards. Price will tend to trade above the 20 SMA and 20 SMA will continue to act as a support.
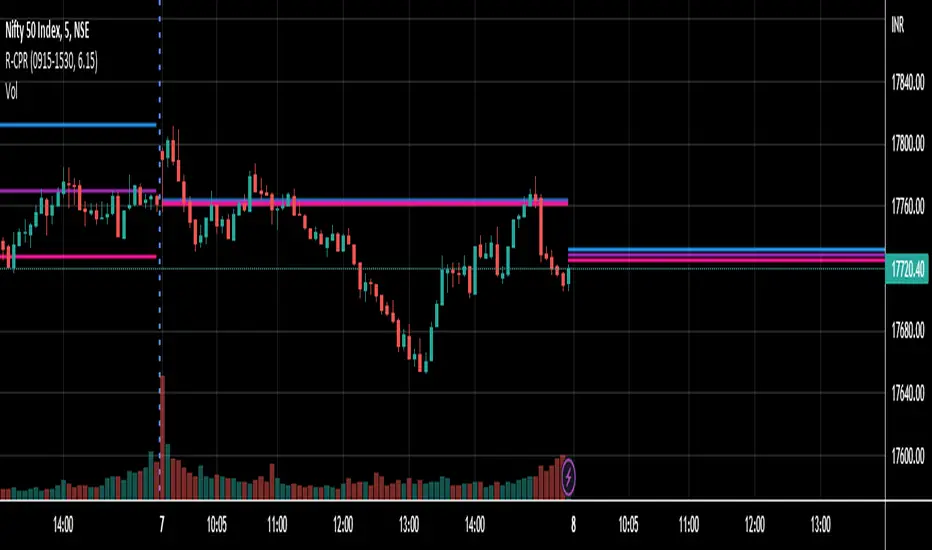
R-CPRThis is a simple CPR script that plots the following data,
Central Pivot,
Pivot,
Bottom Central Pivot.
Thanks.
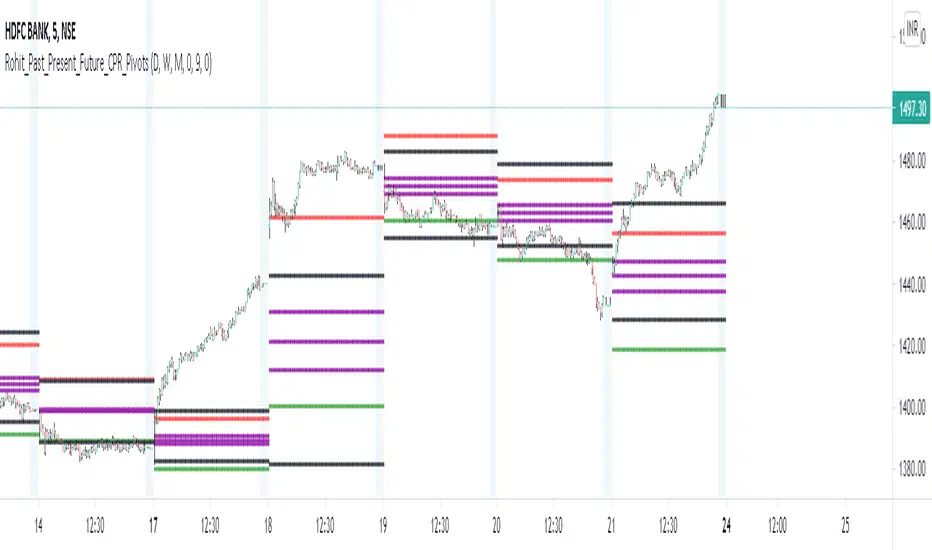
Rohit_Past_Present_Future_CPR_PivotsThis script is for all market types, one could see historical, present and future pivots and CPR at the same time. Also one could apply daily, weekly and monthly pivot levels all together,. Further, daily/weekly/monthly high and low support could be seen as well.... Good Luck with your trading!!!!
CPR, Camarilla & Moving AverageThis script is created primarily for Intraday trading but can also be used for short and long term trading. This is a combination of Central Pivot Range (CPR), Moving Averages and Camarilla Pivot levels (with inner levels). This helps you to combine the strategies of CPR and Moving Averages to identify the best trading opportunities with greater edge. Central Pivot Range and Camarilla pivots are taken from PivotBoss by Franc Ochoa.
Key features:
# Daily CPR levels
# Weekly CPR levels
# Monthly CPR levels
# Previous Day High and Lows
# Previous Week Highs and Lows
# Previous Month Highs and Lows
# Camarilla Pivots with inner Levels
# CPR Levels for the next Day, Week and Month
# 5 Simple moving averages and 5 Exponential Moving Averages
What separates this script from other scripts with CPR and Moving averages?
# One of the few indicators (if not the only one) which combines the 2 types of Moving Averages, CPR and also Camarilla Pivots.
# CPR Levels for not just the next Day, but for next Week(Weekly CPR) and Month(Monthly CPR) also.
# Hide the previous day's levels according to your wish. This is the most unique feature of this indicator. You can set the number of Daily CPR levels you want to load in the chart. This is not just for the Daily CPR but also for the Weekly and Monthly CPR also. This makes the chart less cluttered and prevents the candles from getting buried in the indicators. Please notice how the previous day's CPR levels are hidden in the displayed demo chart on the script page. In the chart, only one trading day's data is shown(by default).
# This script is OPEN SOURCE.
Strategies :
For CPR & Camarilla Strategies for intraday trading and swing trading refer to the book 'Secrets of a Pivot Boss: Revealing Proven Methods for Profiting in the Market' by Franklin O. Ochoa.
Moving averages strategies :
Moving averages can be combined and also used individually for several strategies
* 9 EMA can be used as trailing stop loss for strong moving trends that helps you to catch big moves.
* 20sma can be used not just trailing stop loss but also for taking re-entry to the trend.
* Golden cross - The golden cross occurs when a short-term moving average crosses over a major long-term moving average to the upside. This indicates a bullish turn in the market. Eg: 50 SMA cuts 200 SMA from below.
* Death Cross - The death cross occurs when the short term moving average crosses the long-term average from above. This indicates a bearish turn in the market. Eg: 50 SMA cuts 200 SMA from above.
* When 20 SMA is above 50 SMA and 20 SMA and 50 SMA are angling up like parallel lines, then it denotes bullish strength. If this happens right after Golden Cross, big moves to the upside can be expected.
* When 20 SMA is below 50 SMA and 20 SMA and 50 SMA are angling down like parallel lines, then it denotes bearish strength. If this happens right after Death Cross, big moves to the downside can be expected.
* When 20SMA and 50 SMA are going flat and crossing each other, then it denotes sideways sentiment.
Moving average strategies are taken from the book 'How to Make Money in Intraday Trading' by Ashwani Gujral. For learning more about how to combine CPR and Moving averages in your trading please refer to this book.

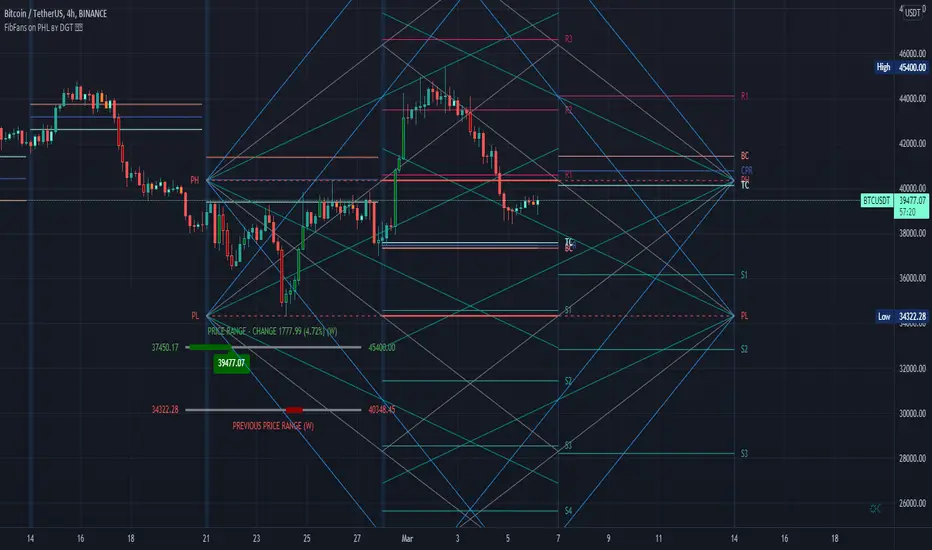
FibFans on Previous HTF HL [FaizanNawaz] by DGTFibonacci Fans application on top of Previous Higher TimeFrame High and Low. Idea owner is @faizannawaz1, special thanks to him for both the idea and tesing the application
WARNING : Study includes plottings in the future, and due to temporal gaps in non 7/24 markets such as weekends, holidays etc plotting of the fans will move to the open session (the effect will be observed on Friday and Monday). With crypto no any side affect will be observed.
More about Fibonacci Fans, how to apply fibonacci fans and automated fibonacci speed and resistance fans study
Adiitonally the study includes some addons, such as
Central Pivot Range and Traditional Pivot Points
Volume Weighted Colored Bars
Price Range Meter - Horizontal HTF Candle
Disclaimer :
Trading success is all about following your trading strategy and the indicators should fit within your trading strategy, and not to be traded upon solely
The script is for informational and educational purposes only. Use of the script does not constitute professional and/or financial advice. You alone have the sole responsibility of evaluating the script output and risks associated with the use of the script. In exchange for using the script, you agree not to hold dgtrd TradingView user liable for any possible claim for damages arising from any decision you make based on use of the script
Pivot Points - Daily(with CPR)/Weekly/Monthly with two EMAsThis script plots all the Pivot points and Support/Resistance on your chart
You can chose Daily, Weekly or Monthly pivot.
Daily Pivot has CPR, 4 support levels and 4 resistance levels
Monthly and Weekly pivot has 3 supports and 3 resistance.
You will also get to plot two EMAs if you want.
Untick the checkbox of Primary EMA and Secondary EMA if you don't want to see EMAs(by default EMAs are disabled)
As this is a leading indicator, price reacts to these levels quite significantly.
You can use this indicator by 'Add to Favourite Indicators' option

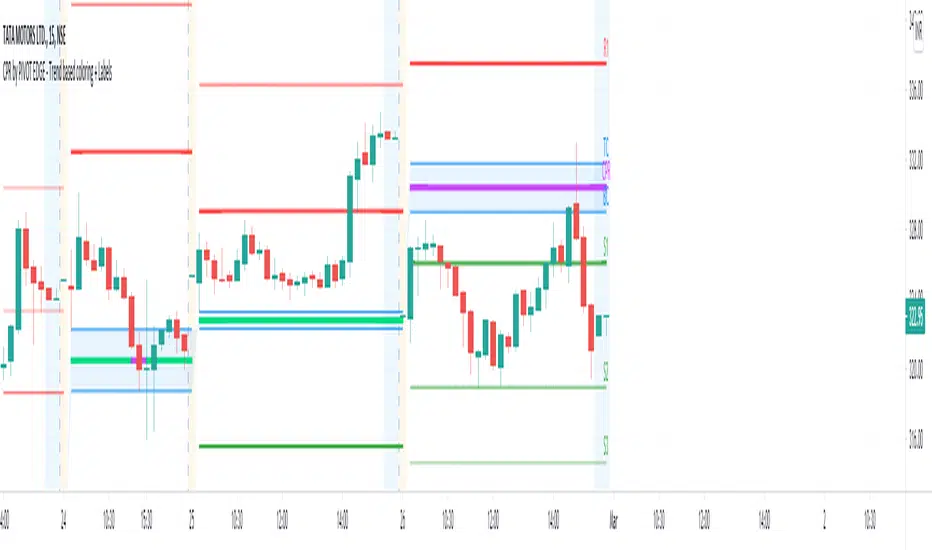
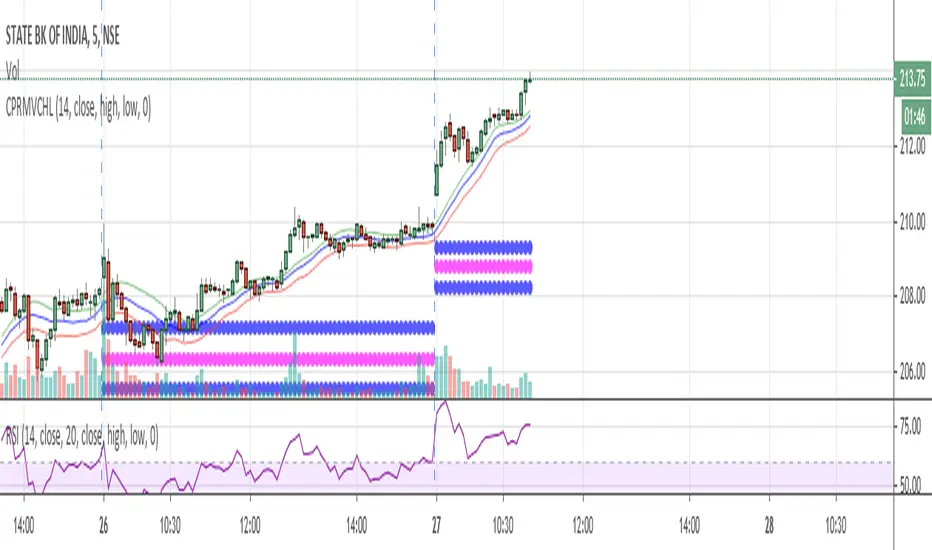
CPR by PIVOT EDGE - Trend based coloring + LabelsIntroduction to the Indicator " CPR by PIVOT EDGE - Trend based coloring + Labels "
The Foundation layout for this indicator is based on PIVOT's which are nothing but the most important levels that the price has respected in the past.The values for the pivots are derived from the key attributes of the price in any timeframe such as the OPEN, HIGH, LOW and CLOSE. These define the mood of the price and where it intends to move in relation to the previous range formed.Earlier HIGH - LOW i.e the RANGE indicates the possible movement that a stock can make in the current session and as per the calculated pivots we can possible find out the tentative supports and resistances. In addition to this indicator, It is advisable to use the price action theory which helps in taking a right decision for entries.
This indicator by itself is complete in nature, i.e it guides the user for possible entry levels and the projected targets that we can achieve and also the likely stop loss limit in case the price reverses. So beforehand even before entering into a trade position, the user can ascertain what can be his loss or max profit and then he can chose an optimum position size for favorable results.
The beauty of this Indicator lies in the fact that it can be used for all types of trading like Scalping, Intra day, Swing or Positional and Investments also. It works on all timeframes and across all market segments like EQUITY, COMMODITIES , FUTURES , OPTIONS , FOREX etc.
This indicator can be used for any exchange and any timezone also without any changes or adjustments needed.
Now let us understand the features of this Indicator in detail.
TIMEFRAME - It has options to choose between Day,week and month as timeframe. By default it is set to Day timeframe
DISPLAY CPR BAND - This displays the CPR range that consists of Pivot, TC and BC. This Band or Range is the core of this indicator and this givesa detailed information about the tentative range and momentum of the market for the present period
as well a prediction for next session and also can tell you the history of its pior period. This level acts as both support and resistance based on the direction of the trend. The unique feature built in this indicator is that
the Pivot changes its color based on the trend in the market and by looking at the color of the pivot itself you can make out what the current trend in the market is.
DISPLAY SUPPORT RESISTANCE - This indicates the important support and resitance levels for the day which is derived from the price details of prior period that is based on HIGH / LOW / CLOSE of prior period.
DISPLAY PREVIOUS HIGH / LOW / CLOSE - I have included Daily / Weekly and monthly levels. It is important to know the earlier highs / lows and close since price respects it very must just like support and resistance.
DISPLAY TOMORROW CPR - This displays the CPR band and support / resistance for tomorrow.It give an advance information of tomorrows trend and momentum today itself if you study the CPR concepts you can be prepared for tomomorrows market and can very well know in advance if it will be a sideways market or a trending day.
MINOR TREND - This displays a combination of 2 moving averages. By default I have coded for 20 and 50 period which can be modified as per your needs. These 2 moving averages depicts the prevailing minor trend in the market and you can take decision to enter trade based on this trend projection.
For users ease, I have conditionally coded the moving average curves and also the background color to depict the present trend i.e red denoted bearish trend and green denoting bullish trend. The colors change automatically based on the change in price behaviour.
MAJOR TREND - This displays the prevailing major trend in the market and I have used as 200 period moving average by default which you can change to suit your needs. You can check the major trend of the market by using higher timeframes above 1Hr.
IMPORTANT NOTE : This indicator does not guarantee any favorable results nor protect your from any loss. You own the complete risk of your trades. It is suggested that you use this indicator and do back testing for considerable period to understand how it works the the potential win rate it can give.
If you have any doubts or need any clarifications of assistance in understanding, you can message me and i will try to help.
I will soon try to make a Video and explain the use of this indicator for better clarity and understanding.
Happy and Safe trading - Mohan from PIVOT EDGE
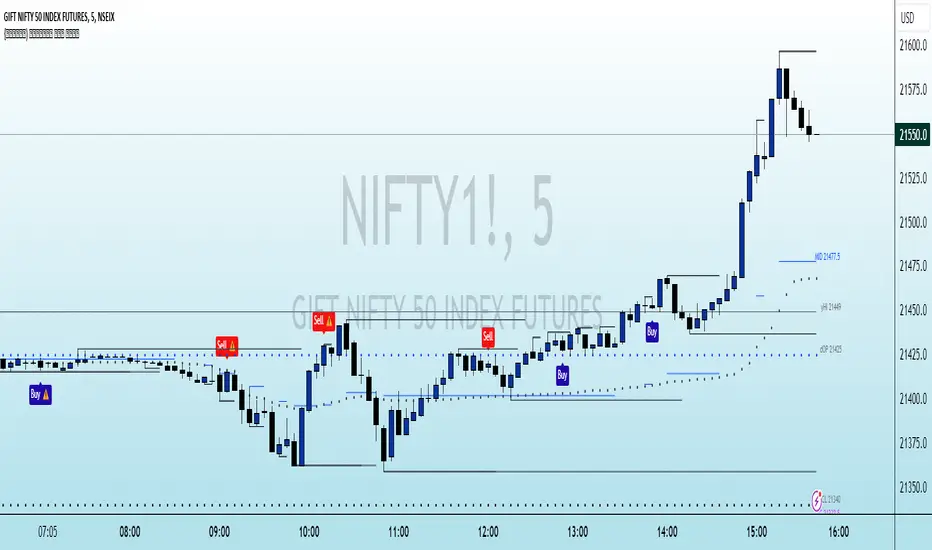
Fishing with SignalsFishing with Signals
HOW DOES IT WORK?
Fishing with Signals comprises of 3 indicators
1) Buy / Sell Signals
2) Band for Trend Recognition
3) ADX-DI Trend Identifier
Indicator 1 == Buy / Sell Signals
The signals are based on moving average exponential rectified by the previous high and low break at any real-time, it recognises the previous specified moving average deviation. If the predefined high and lows are broken along with current candle is closed below the specific moving average then sell is given and vice-versa for buy. The settings are not editable.
Indicator 2 == Band for Trend Recognition
The band comprises of 200 moving average with exponentially smoothening feature, there are three lines one can identify the trend if candles are below or above the band
Indicator 3 == ADX-DI Trend Identifier
The indicator gives a multiplication of ADX and the DI+ and DI-values, colour coded for bullish or bearish momentum and shows general market direction and divergence in a simpler visual way than the normal ADX-DI lines, a threshold value cannot be edited. The indicator is plotted relative to the 200 ema and can be seen as a "buffer" against price reversal. The ADX is used to indicate market direction, the existence or nonexistence of a trend and market momentum. Market direction is determined by the levels of the +DI and -DI. The ADX indicator, which varies in value from zero to 100, is the primary momentum indicator, default value is kept at +40 and -40. If the ADX is lowering or rising the DI line plotted will be moving as directed with change in colour and background filling. The Line hovering below and above the "buffer" is changing the colour with rising as navy and falling as maroon with intermittent colour of red and lime which also shows reversal.
HOW TO use the indicator?
For SHORT ==If the candles are below the Band for Trend Recognition and ADX-DI Trend Identifier is lowering and if the SELL SIGNAL comes one can go short with stop-loss be the close above top band and with momentum be positive.
For LONG == If the candles are above the Band for Trend Recognition and ADX-DI Trend Identifier is growing and if the BUY SIGNAL comes one can go Long with stop-loss be the close below lower band and with momentum be negative.
CAUTION!! : There will be false buy / sell signals also, where user have to verify with the other two indicators, for confirmation.
TARGET in any call = If the trend is up and buy signal comes then target may be trailed till next signal or close below band and vice versa for sell side.
USER OPTIONS : Choice of turning on / off the three indicators.
VISUAL CHECKS - The user could manually validate the back test results on various assets they would like to use this strategy on before putting it live.
USAGE MARKETS : Index Trading / Equities and also well with Commodities and Currencies.
TIME FRAME : Timeframe maybe any and as the user likes, still it works well with 5 min for less signals.
SETTING THE ALERTS : - Buy and Sell Signal alerts are advisable.
HOW TO GET ACCESS
Please click on the link / email available in the signature or send me a private message to get access.
FEEDBACK
Please click on the link/email in the signature or send me a private message for suggestions/feedbacks.
DISCLAIMER.
I AM NOT A FINANCIAL ADVISOR. THESE IDEAS ARE NOT ADVICE AND ARE FOR EDUCATION PURPOSES ONLY. ALWAYS DO YOUR OWN RESEARCH!
Utmost Care is taken to implement the suggestions of users and also tried to keep the chart neat and clean.
Greetings!!
Drop a mail to edgineer@yahoo.com or Drop a personal message for access.
Questions, Help, Discussion -> Telegram: Telegram: @miteysh

CPR by stockarrowsCPR along with Pivot lines provide the much needed important level right when the day begins. Please consider the lines as Support/Resistance and you can apply your strategy on top. It can be used for entry as well as exit.
PIVOT EDGE - The complete trading setup - LITEIntroduction to the Indicator " PIVOT EDGE - The complete trading setup - LITE "
The Foundation layout for this indicator is based on PIVOT's which are nothing but the most important levels that the price has respected in the past.The values for the pivots are derived from the key attributes of the price in any timeframe such as the OPEN, HIGH, LOW and CLOSE. These define the mood of the price and where it intends to move in relation to the previous range formed.Earlier HIGH - LOW i.e the RANGE indicates the possible movement that a stock can make in the current session and as per the calculated pivots we can possible find out the tentative supports and resistances. In addition to this indicator, It is advisable to use the price action theory which helps in taking a right decision for entries.
This indicator by itself is complete in nature, i.e it guides the user for possible entry levels and the projected targets that we can achieve and also the likely stop loss limit in case the price reverses. So beforehand even before entering into a trade position, the user can ascertain what can be his loss or max profit and then he can chose an optimum position size for favorable results.
The beauty of this Indicator lies in the fact that it can be used for all types of trading like Scalping, Intra day, Swing or Positional and Investments also. It works on all timeframes and across all market segments like EQUITY, COMMODITIES, FUTURES , OPTIONS , FOREX etc.
This indicator can be used for any exchange and any timezone also without any changes or adjustments needed.
Now let us understand the features of this Indicator in detail.
TIMEFRAME - It has options to choose between Day,week and month as timeframe. By default it is set to Day timeframe
DISPLAY MAJOR LEVELS - These are the important support and resistance levels calculated based on the past price data. Most important ones are marked in BOLD RED and BOLD GREEN between which the price tends to move generally.
Apart from these, We have breakout level marked in light green and if price breaks this level we can expect targets upto extended levels and beyond marked in blue.
we also have breakdown level marked in light red and if price breaks this level we can expect targets down up to extended levels and below it marked in blue.
In addition I have coded intermediate target levels that appear in light gray between the extended levels or blue lines. Sometimes when the gap between these targets are huge, price cannot reach the targets and reverses at these intermediate targets. You can use them as targets or trailing stoploss based on your plan
DISPLAY HIDDEN LEVELS - These levels are intermediate supports and resistances that can be used whenever the present day indicated range is very wide. Whenever we have an explosive moments in market the range of that day is very huge and so he next day support and resistance band becomes very wide indicating the sideways movement day within that range. And on those days we can switch on the hidden levels and the price respects these levels and most of the days it is inside this range only.
DISPLAY PREVIOUS HIGH / LOW / CLOSE - I have included Daily / Weekly and monthly levels. It is important to know the earlier highs / lows and close since price respects it very must just like support and resistance.
PEMA - This is an important EMA based indicator which potentially indicates curves of support and resistance during retracements or pullbacks. If the curves are breached then the trend is reversed and the price will tend to move to the next pivots.
VALUE AREA - One of the most important feature of this Indicator is this which is derived from the Volume profile concepts. It indicates the fair value area Indicated by orange band and the upper and lower limits indicated by orange lines. Whenever the price is overvalued or undervalued, it is pushed back to its fair value and we can judge the present price position in relation to the value area and then take position in anticipation of the price reaching its fair value area. This must be coupled with price action for favorable results.
IMPORTANT NOTE : This indicator does not guarantee any favorable results nor protect your from any loss. You own the complete risk of your trades. It is suggested that you use this indicator and do back testing for considerable period to understand how it works the the potential win rate it can give.
If you have any doubts or need any clarifications of assistance in understanding, you can message me and i will try to help.
I will soon try to make a Video and explain the use of this indicator for better clarity and understanding.
Happy and Safe trading - Mohan from PIVOT EDGE

Intraday Multi timeframe CPRDue to the request of some users and inspired by "Intraday CPR " I updated "CPR for Intraday Trading " and added extra functionality for your convenience.
Intraday CPR levels are changed according to timeframe instead of previous day high, low and close
This indicator you can change timeframe : Week ,Day, 240 min ,180in, 120 min, 60 min
code credit : ThePivotTrader

{INDYAN} Perfect Buy SellA simple indicator based on candle stick strength, with cpr,vwap and support resistance...
search for buy sell signal on 15 min timeframe and wait for second candle to close above/below of signal candle. Cpr pivots would act as support and resistance. Entry should only be based on 15 mins or higher timeframe. 3 and 5 mins timeframe for profit booking.
No supertrend or atr used in this indicator.
This show how a single candle can give u good trade...
Love Indyan
* tested on Banknifty and nifty , kindly share ur experiences on other scrips. Thanks
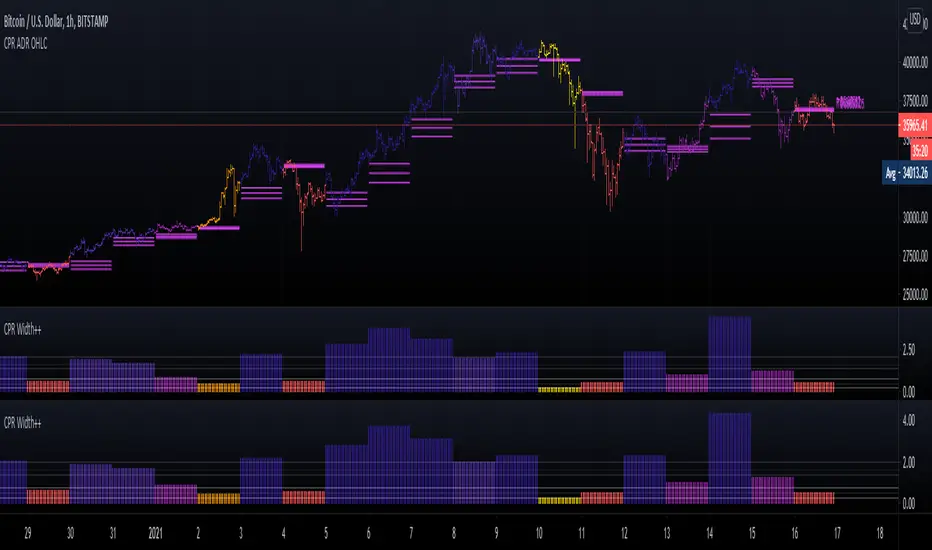
CPR Width + MTF, Offset and BarcolorsDue to the request of some users and inspired by "5 Day ADR ICT Intraday Tracker" I updated "CPR Width" and added extra functionality for your convenience.
tradershedge
Dear Traders,
This script will get a smile on most of the pivot and price action traders.
My trading skills have drastically improved after learning the concepts of central pivot point, supply and demand and more importantly understanding of the simple candle stick patterns.
This is my experiment of decoding the above mentioned concepts to simple trading setups which can be used across any instruments and across any timeframes.
The most essential and must skills required in order to achieve profits in trading is to identify the right trend, exact entry and exits, risk management and importantly understanding the market structure along with the traders emotion.
Let’s just decipher each of the essential skills along the tools we will be using for analyzing each of the section
TREND ANALYSIS
Central pivot range ( CPR ) : is used to identify the market structure and the major trend of the instrument you are going to trade. This will help in identifying the mean reversions & trending trade setups in the market.
Developing Dynamic Pivots & Future Targets
This setup will help us in decoding the closing and opening market sentiment and will help us in planning our trade upfront. This home work in post & pre-market session will increase the odds of the trade in our favor to a great extent.
Trend Identification & Dynamic Support & Resistance
I have also included the Pivot based exponential moving average (PEMA) to visually identify the current trend and it also shows the current trend by dynamically changing the colors for bull & bear market in the PEMA zone.
VALUE AREA
We know that the market works on supply and demand and when the price arrives at these zones the market reacts very faithfully. Hence it’s very important for a trader to know in advance where these levels exist before entering the market.
This Indicator bridges this gap by showing in advance the future value areas where the price reaction can be expected and trades can be planned accordingly. Hence it can anticipate the market move with a strong logic behind us rather than leaving the trader in surprise.
This value area zone will be highlighted in different colors on the chart will be grab your attention and help in planning your trade accordingly.
Market Sentiment
Each market session is a story in itself which is been scripted by the movements of each candle sticks, hence if we understand the relationship between each candles as it is getting formed we can predicate the future candle stick formation to a great extent.
i have coded the indicator triggers which reads the relationship between each candles and shows signals of reversals and also give traders alerts when the price rejection occurs.
Various shapes of rejection signs are plotted for bullish and bearish reversals which help in prediction the strength of the price rejection which will help the trader in planning his trade.
The various shapes in the order of strength are diamond, square, arrows, and triangle respectively.
Entry & Exits
The volatility is the key in predicting the market movement. If we identify the trend correctly then all we have to do is set our expectations accordingly for the targets based on the volatility of the instrument.
The indicator basically captures the recent volatility for the specified look back period and plots across the possible price movements for the current session.
Based on your entry setups you can get a reference of the maximum targets we can expect with the help of the levels the indicator plots.
Please do feel free to use the indicator and give your valuable feed backs which will help me in optimizing it to a great extent.
I am in the process of optimizing the price triggers to a greater extent and also dynamically plot the possible demand and supply zones in coming future.
I would love to thank each of the traders in this TradingView community in helping me improve on my trading skills.
Happy Trading !

(CoInS) Confluence of Indicators and Signals v2 skvConfluence of Indicators and Signals (CoInS) v2 skv
This time best of pivots and oscillators came to confluence to guide traders for better decision making to trade. Remember practice makes profit.
This script created for educational purpose for learners want to observe/study the indicators and its signals. Indicators HMA, SMA, Super Trend, MACD, BB, ADX/DMI/DMS, RSI, Elder Impulse and Pivots CPR, Camarilla, Floor, SQR are used in this script and the display of them controlled through the indicator settings. Values are tuned and can't be changed. Only the current day values will be displayed.
Observe the signals and reversal points at pivots or moving average lines. The bright green up triangles and bright orange down triangles indicates momentum, the faded triangles indicates the momentum is getting weak.
At start of the day, this script indicates whether today is trending or not trending for the scrip.
The SQR pivot points will move as per the trend and indicate the resistance and support level at that time. The color crosses informs that the change occurred throughout the day.
The signals generated by this study are not recommendation and use it on your own discretion after keenly observing each and every details.
Pivots
Pivot Boss CPR with width
Pivot Boss Camarilla
Pivot Boss Floor pivots
Simple and amazing SQR pivots
Displays signals from,
RSI signals
HMA signals
Super Trend
MACD (cross and histogram signals)
Elder Impulse
ADX/DMI/DMS and BB for Momentum
I'm thankful to trading view, various pine coders and authors contributing here and building wealth of knowledge.
*****Remember: Practice makes Profits*****
Disclaimer
1. Only for educational and learning purpose
2. For Intraday and scalping strategies and 5 and 15 min TF only
3. Do paper trade before using any information for actual trading
4. Not swing or positional trade
5. Use it on your own discretion and no one else responsible for the profit/loss except you

Pivot point with CPR, historical, high low and openThis script generates pivot points up to 10 level with CPR levels for Daily, Weekly, Monthly & Yearly
along with resolution for Daily, Weekly, Monthly & Yearly
along with High, low and close for that resolution
can check historical levels for the resolution as well.
the pivot auto adjusts even when you change the chart pattern to heikin ashi, renko or any other.. unlike system pivot.
change the time frame & resolution to required setting like
"Daily" & "D"
"Weekly" & "W"
"Monthly" & "M"
"Yearly" & "12M"

The Ultimate Frank Ochoa Trading Setup by YesuThis trading set up will show the Frank Ochoa's 4 reversal candles with the 'RSI and volume filters' along with the necessary pivots. You will be able to select the RSI and volume filters individually for all the 4 setups. It will also show the colored RSI candle when the RSI conditions met. You can also set the Initial Balance based on your preference. Lot more features that you can explore. A must have for pivot traders. This is the trading set up which I am using from the past 15 months

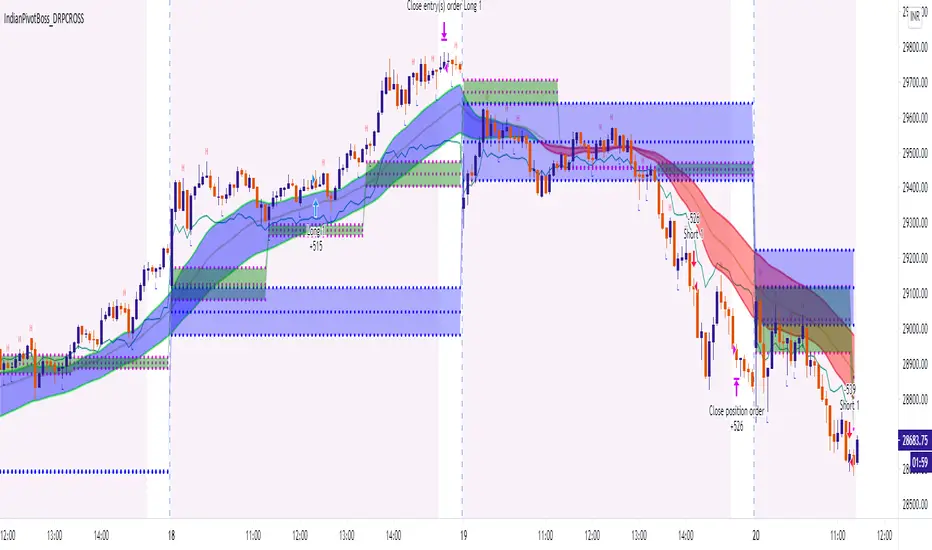
IndianPivotBoss_DRPCROSS_V2This strategy is an intraday strategy based on Developing pivot cross.
Long is generated when price crosses above developing pivot.
Short is generated when price crosses down developing pivot.
It also looks into developing pivot width for an expansion before taking into consideration of the above signals thereby providing signals only when a possibility of a trend emerges.
Pls note that past performance is not indicative of future performance.
Hence use it at your own risk. There is no guarantee for profits and there is always a possibility of losing entire capital in trading.
Magnetic Zones v1.1 BetaMagnetic Zones v1.1 Beta
This is one of the most powerful and effective indicator which I personally use for Intraday.
It works well for trending stocks and trending days.
What are the Zones?
The zones are basically Retracement and Reversal Zones. The price will take a halt at this zones. So it will be easy to take an entry.
How to use?
Labels:
Pivot = P
Major Zones = R1, R2, R3, S1, S2, S3
Minor Zones = R0.5, R1.5, R2.5, S0.5, S1.5, S2.5
Previous Day High & Low = PDH, PDL
Breakout:
Opens between Previous Day High or Low and R1 or S1 Zone and taking retracement at the zone can result in a breakout.
Entry Time:
No Entry: 0 to 15min. Wait for the early Algo rush to settle down. Just go through the shortlisted stocks or top gainers and top losers.
Risky Entry: 15min to 30min. It is the right or early time to participate in the beginning of a rally. But, recommended only for experienced, disciplined and planned traders.
Moderate Risk: 30min to 45min
Safe Entry: After 45min to 1hr
Stock Selection Tip:
Use Expanded Floor Pivots to spot Narrow Range stocks.
Entry Tip:
Use Opening Range Breakout (15, 30, 45 or 1hr) to spot false shoot ups.
Entry:
After the retracement on or closer to the zones.
If the retracement happens in between spaces of the zones expect next retracement at the next in between space. Imagine the levels accordingly.
Retracement is the right time to make an entry with minimum stoploss.
Stoploss:
Just below the longest candle which touches the zone.
Target:
If it is a trending stock the price will move easily from one major zone to another major zone.
If the zones are wider on a particular day use the minor zones as target.
Consider the historical support and resistance, highs and lows to confirm the entry or exit.
Indicator Features:
Inclusion of 2nd and 3rd zones: Helpful to identify the target zone and to participation in a major rally.
Clean and cluster free look
Shows only required zones
Hide historical levels
Previous day High and Low levels
Multi time-frame
Caution:
Don't solely depend on this indicator. Always use this with other analyzing tools or methods for more confirmation.
Acknowledgement:
Thanking the original formulators.
Note:
The indicator is under testing. Any errors, updates and additions will be updated in the final version.
Even though there many are other indicators similar to this in TradingView, this indicator is customized for precision, inclusion of extended levels and designed for a squeeze free chart and visual appeal.
Explore, improvise and formulate new methods with your personal experience and ideas.

PivotBoss-ThyagarajThis script helps in plotting multiple price action tools useful for a intraday/positional trader.
1- It can Plot opening range breakouts ( ORB ) and can customise the opening range starting from 1 min to 60 mins as you wish.
2- It can plot historical opening range breakout levels.
3- It can plot multiple timeframe (Daily/Weekly/Monthly ) CPR lines and future CPR levels.
4- It can plot the multiple timeframe camarilla or standard pivot point s.
5- It can highlight multiple bearish and bullish candle stick patterns.
6- It can plot short,medium and long term simple moving averages .By default I have set it as 20,50 and 200 sma.
7- It can colour the candle body based on candle body ratio to 14 period ATR.
8 - Each and every tool can be used individually or in combination of one another as per the users comfort.
9- All the tools can be formated as per the users choice... I have considered dark theme while setting the present colours.
Please use and provide your feedback .
Good Luck and Happy Trading...

Magic CPRThis is not a simple CPR, this includes much more than a simple CPR. Typically a price action based trader use some other support and resistance combined with CPR and I am trying to combine all of them in one single indicator.
In the case of CPR this indicator supports only daily CPR but shows Weakly and Monthly pivot if you want on chart. Other than CPR, this indicator support,
1. Daily time frame Swing Low and High : Implemented, You have to set the number of days you have to consider calculating Swing high and Swing Low. yes this is not 100% automated but really useful.
2. Yesterday High
3. Yesterday Low
4. Today Open : Today Open and Yesterday Low / High will help you to see the gap.
5. Virgin CPR : Yes, I did not see any other indicator which shows Virgin CPR on your chart. This will draw virgin CPR if any virgin CPR exists in the last 6 days. I think people consider only last few days virgin CPR only .
Why This indicator
1. It is difficult for the trader to draw all the above drawings every day
2. Even if you want to use indicators to draw these, it is extremely difficult to configure and manage it in multiple indicators.
3. If you are using a free account you are limited with the number of indicators on the chart as well.
4. Most important, there is no other indicator draw virgin CPR for you
5. Typically people do not want the CPR and pivot data for older days, I provide an option to hide all older pivot data from chart
5. Even though Pivot can be calculated for the entire day, most of the pivots show pivot data till current time. In this indicator, the pivot data will be plotted to you for the entire day at 9:15 AM.
What I am expecting from you
1. Please let me know the feedback
2. Let me know if you are looking for any improvements
3. let me know if you find any bugs
