CCI Breakout TraderWorks well on Bitcoin or most altcoins on a 15min chart or higher.
What is this exactly?
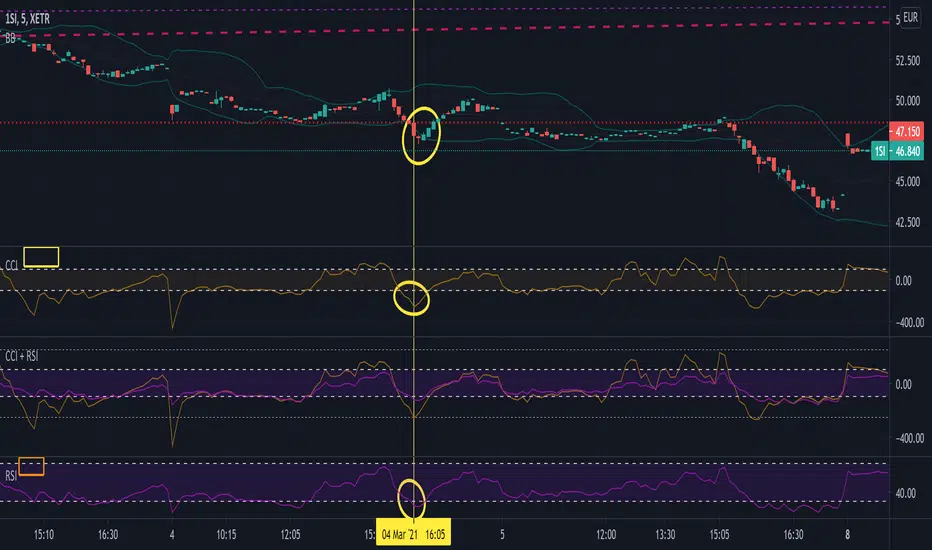
This is an indicator that uses horizontal RSI + EMA lines with a CCI line on top of it to provide optimal entry and exit positions for trading. There is also a breakout indicator based on the width of Bollinger Bands.
How to use:
If the blue stream passes upwards on the red heading to the white - it's heading towards a good BUY signal. To be safe you wait until it passes above the white line, then BUY LONG. Another signal to buy long is when the blue stream passes above the white and green lines.
Selling is essentially the opposite, if the blue stream is passing down from the green or white lines, then it's time to sell and exit your trade.
If you need help knowing when to enter and exit a trade the indicator will draw a grey candle on your chart to signal it's time to exit a long trade and it will draw a purple candle when it's time to enter a long.
--
Breakout alert:
If you see a green vertical bar it's a warning that there is a potential breakout in price coming for whichever coin you are looking at. The price breakout could go either direction, so make sure you watch the blue stream.
--
Important tips:
The direction of the green/white/red lines are important - if they are heading down that means it might not be the best time to enter your trade, even if the blue stream crosses up on the red and/or white lines.
The colored horizontal lines are there to let you know if the blue stream is near the bottom of those lines (anywhere from hline 15 to 50) and heading upwards, you will more likely have a longer positive trade. If the blue stream is above 60 hline and it looks like a good trade (passing up on the red and white lines), expect to have a shorter trade.
I use this for swing trading various crypto currencies, once you learn how to read it, you can catch amazing uptrends really early and you can exit trades before some big drops happen.
Emtia Kanal Endeksi (CCI)

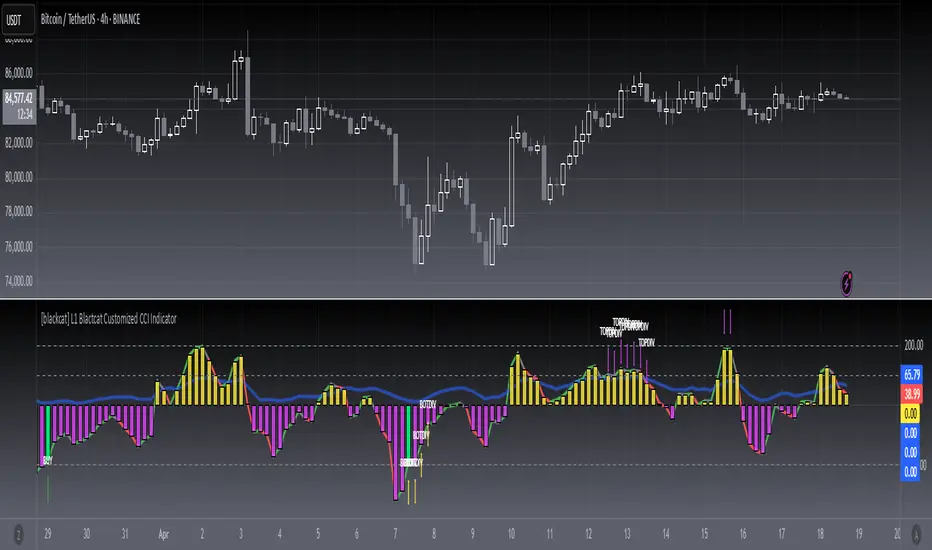
[blackcat] L1 Blackcat Customized CCI IndicatorLevel: 1
Background
This CCI indicator is blackcat customized version with enhanced features.
Function
This CCI use green line to indicate strong long trend with cci values > 0 and red line to indicate weak long trend with cci values <0. It also use yellow and fuchsia candles to present the strong and weak long trend. A green candle is used to indicate long entry, while a red candle is usded to indicate long flatten signal.
Key Signal
green line --> strong long trend
red line --> weak long trend
blue line --> trend strength indicator
SELL label --> flatten long or short entry
BUY label --> long entry
TOPDIV label --> top divergence indicator
BOTDIV label --> bottom divergence indicator
Remarks
Feedbacks are appreciated.
Readme
In real life, I am a prolific inventor. I have successfully applied for more than 60 international and regional patents in the past 12 years. But in the past two years or so, I have tried to transfer my creativity to the development of trading strategies. Tradingview is the ideal platform for me. I am selecting and contributing some of the hundreds of scripts to publish in Tradingview community. Welcome everyone to interact with me to discuss these interesting pine scripts.
The scripts posted are categorized into 5 levels according to my efforts or manhours put into these works.
Level 1 : interesting script snippets or distinctive improvement from classic indicators or strategy. Level 1 scripts can usually appear in more complex indicators as a function module or element.
Level 2 : composite indicator/strategy. By selecting or combining several independent or dependent functions or sub indicators in proper way, the composite script exhibits a resonance phenomenon which can filter out noise or fake trading signal to enhance trading confidence level.
Level 3 : comprehensive indicator/strategy. They are simple trading systems based on my strategies. They are commonly containing several or all of entry signal, close signal, stop loss, take profit, re-entry, risk management, and position sizing techniques. Even some interesting fundamental and mass psychological aspects are incorporated.
Level 4 : script snippets or functions that do not disclose source code. Interesting element that can reveal market laws and work as raw material for indicators and strategies. If you find Level 1~2 scripts are helpful, Level 4 is a private version that took me far more efforts to develop.
Level 5 : indicator/strategy that do not disclose source code. private version of Level 3 script with my accumulated script processing skills or a large number of custom functions. I had a private function library built in past two years. Level 5 scripts use many of them to achieve private trading strategy.
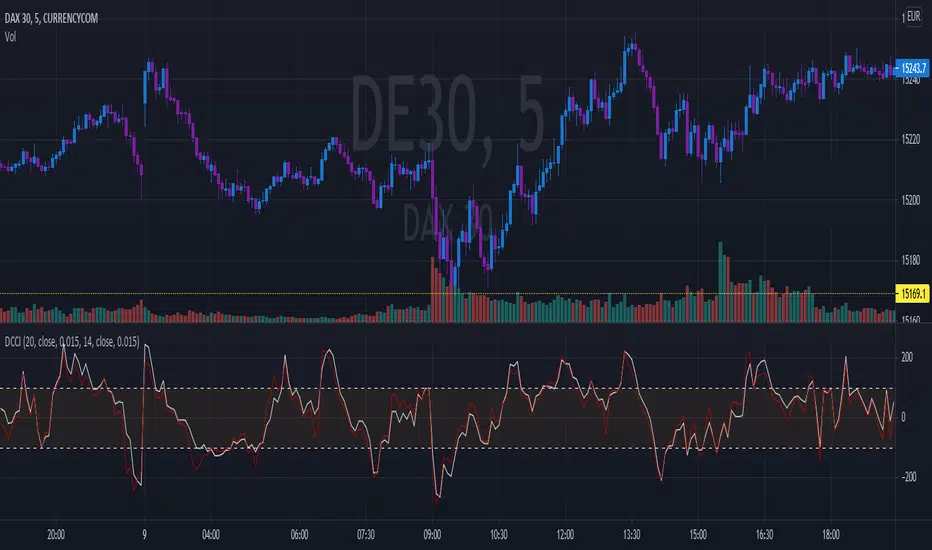
Dual Commodity Channel IndexDual Channel Commodity Index comprised of two single CCI indicators with all tweakable parameters: lengths and factoring.
All in one [Liubam]Hey tradingviewers!
This is an All in one Indicator for those who can't add too many indicators on your charts. Inspired by ©LonesomeTheBlue "Indicators all in one" script. I found a lot of very interesting scripts on the public library and I decided to make a tool with some of the greatest IMO, adding some modifications to improve the indicators. With this tool you can plot 1 of 6 different indicators by selecting it from a drop-down list (on the indicator settings).
All the credit goes to it's respective owners (taggeds).
THIS INDICATOR INCLUDES:
1. Classic RSI with some OB/OS tools:
The relative strength index (RSI) is a popular momentum indicator displayed as an oscillator (a line graph that moves between two extremes) that measures the magnitude of recent price changes to evaluate overbought or oversold conditions, in other words it shows signals about bullish and bearish price momentum. I added some visual improvements to help you finding the OB/OS zones.
2. Classic CCI with some OB/OS tools.
The Commodity Channel Index (CCI) is a momentum-based oscillator used as market indicator to help determine market movements that may indicate buying or selling. Added some vistual improvements to the chart.
3. ADX and DMI oscillator with the keylevel coded by @console:
The Average Directional Index (ADX) is non-directional indicator used by some traders to determine the strength of a trend. When the ADX line is rising (Above the keylevel) trend strength is increasing, and the price moves in the direction of the trend whether up or down. Otherwise, low ADX (Below the keylevel) is usually a sign of accumulation or distribution (Range). Non-trending doesn't mean the price isn't moving. It may not be, but the price could also be making a trend change or is too volatile for a clear direction to be present.
Suggested settings of the keylevel is 23-25.... REMEMBER: The trend may be your friend.
4. MFI
The Money Flow Index (MFI) is a technical oscillator for identifying overbought or oversold signals in an asset. Unlike conventional oscillators such as the RSI, the Money Flow Index incorporates both price and volume data, as opposed to just price. It can also be used to spot divergences which warn of a trend change in price.
5. Stochastic:
A stochastic oscillator is range-bound, meaning it is always between 0 and 100. This makes it a useful indicator of overbought and oversold conditions. Traditionally, readings over 80 are considered in the overbought range, and readings under 20 are considered oversold. However, these are not always indicative of impending reversal; very strong trends can maintain overbought or oversold conditions for an extended period. Instead, traders should look to changes in the stochastic oscillator for clues about future trend shifts. I added some features for this popular indicator to show the stochastic crosses.
6. The famous Squeeze momentum Indicator made by @Lazybear:
This is derivate of John Carter's "TTM Squeeze" volatility indicator and its very strong when using with trending indicator such a ADX. Black line (or no-line) on the midline show that the market just entered a squeeze ( Bollinger Bands are with in Keltner Channel). This signifies low volatility , market preparing itself for an explosive move (up or down). Gray line signify "Squeeze release". Mr.Carter suggests waiting till the gray line after a blackline, and taking a position in the direction of the momentum (for ex., if momentum value is above zero, go long). Exit the position when the momentum changes.
------------------------------------------------------------------------------------------------------------------------------------------------------------------------------------------------------------------------------------------------
This script is source code protected, but you can add to your favorite list to use it. Also you can add twice to use 2 different indicators at the same time (E.g. Squeeze Momentum Indicator + ADX)
An additional indicator I made (MA Hunterz + InfoPanel) is needed to not miss good entry points.
Your valuable comment and feedback is much appreciated...
And remember indicators can be really helpfull but always use Price Action.

CCI Overbought & OversoldThe Commodity Channel Index (CCI) is a momentum-based oscillator used to help determine when an investment vehicle is reaching a condition of being overbought or oversold
Developed by Donald Lambert, this technical indicator assesses price trend direction and strength, allowing traders to determine if they want to enter or exit a trade, refrain from taking a trade, or add to an existing position. In this way, the indicator can be used to provide trade signals when it acts in a certain way.
KEY TAKEAWAYS
The Commodity Channel Index (CCI) is a technical indicator that measures the difference between the current price and the historical average price.
When the CCI is above zero, it indicates the price is above the historic average. Conversely, when the CCI is below zero, the price is below the historic average.
The CCI is an unbounded oscillator, meaning it can go higher or lower indefinitely. For this reason, overbought and oversold levels are typically determined for each individual asset by looking at historical extreme CCI levels where the price reversed from
This script calculates Commodity Channel Index (CCI) value and fills background of price action chart with colors:
Green zone indicates oversold zone where you can enter position
Red zone indicates overbought zone where a positions should be closed

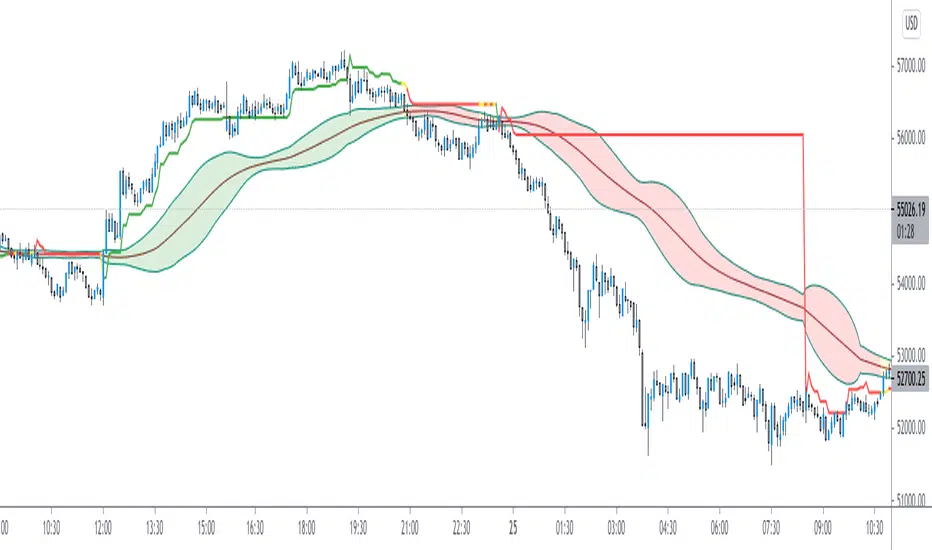
CCI Super BandsCCi Super Bands ,
Is an Indicator to plot Commodity Channel Index Projections over the Price Chart
It's offers interesting price Analysis
There are two major parts to the indicator!
1. The Optimal CCI Line
2. A CCI Standard Deviation Bands
Color Codes Meaning:
Red : Strength in Bearish Intent
Green : Strength in Bullish Intent
Yellow : Consolidation estimations
Try to play with this indicator
and Enjoy
PRIME - R.o.c.M Ind. W/ TrendsThis experimental script is a variant of a model that allows a separate indicator window to be opened, revealing data for on balance volume, rsi, consumer commodity index and momentum indications. By use of the settings key, you can change the parameter of the source input as well as the desired lengths. After data compilation, the indicator will automatically draw any trend lines applicable to what is presented. The additional code is an attempt to allow the system to apply pivot points for alerts within the indicator itself.
Disclaimer:
Trading success is all about following your trading strategy and the indicators should fit within your trading strategy, and not to be traded upon solely
The script is for informational and educational purposes only. Use of the script does not constitute professional and/or financial advice. You alone have the sole responsibility of evaluating the script output and risks associated with the use of the script. In exchange for using the script, you agree not to hold the publishing TradingView user liable for any possible claim for damages arising from any decision you make based on use of the script

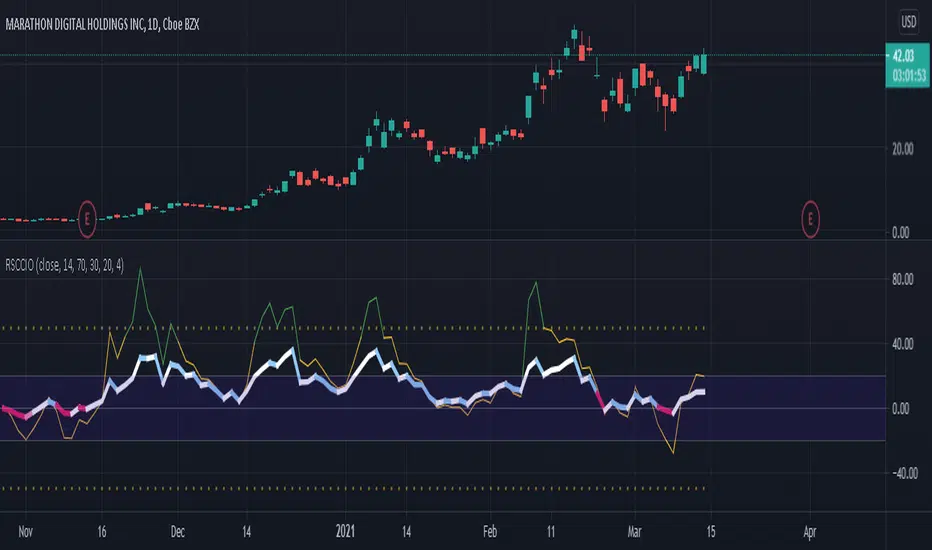
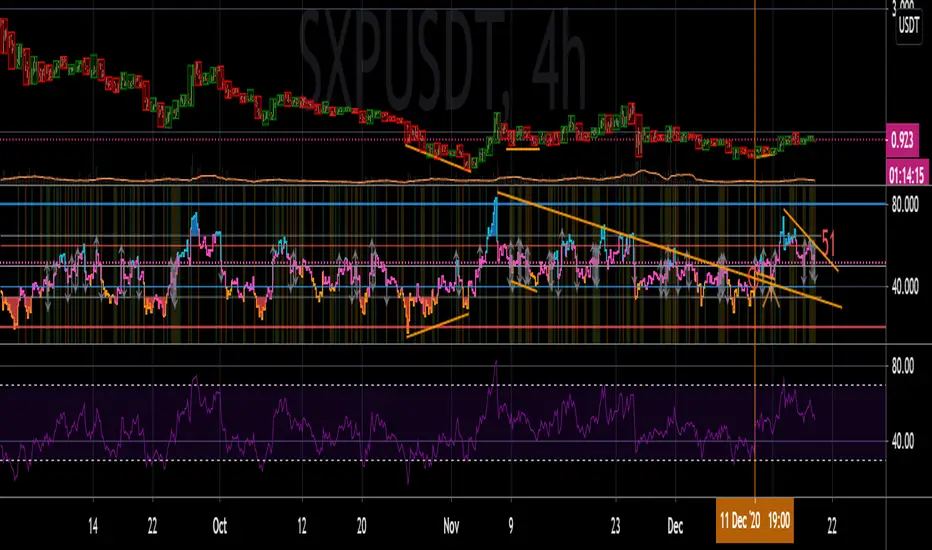
[SK] RSI/CCI Correlating OscillatorThe combination of RSI and CCI can be a powerful tool to efficiently signal the strength of the trend and upcoming reversals.
The magic comes when you're able to correlate both indicators correctly, this is the power I give you with the RSCCIO.
I've added additional features to each indicator that make signals more clear and easier to identify.
On the RSI
Directional color coding similar to what you can find on a MACD. This helps to identify the general trend ( above or below midline ) and the of the movement within.
For precise correlation the RSI is adjusted to a midline of 0. You can still enter the overbought/oversold levels as you'd expect on a regular RSI and it will be automatically adjusted.
On the CCI
Extreme strength / weakness color coding when the value exceeds the range makes signals more clear.
For precise correlation with the RSI, we need to scale down the value of the CCI with the Sensitivity Input. The default value works overall but feel free to play around to adjust the scale of the CCI movement.
---
RSI Relative Strength Index
The RSI is a momentum indicator that measures the magnitude of recent price changes. An asset is usually considered overbought when the RSI is above 70% and oversold when it is below 30%.
CCI Commodity Channel Index
The CCI was originally developed to spot trend changes. Use the CCI on the longer-term chart to establish the dominant trend and on the shorter-term chart to isolate pullbacks and generate trade signals.
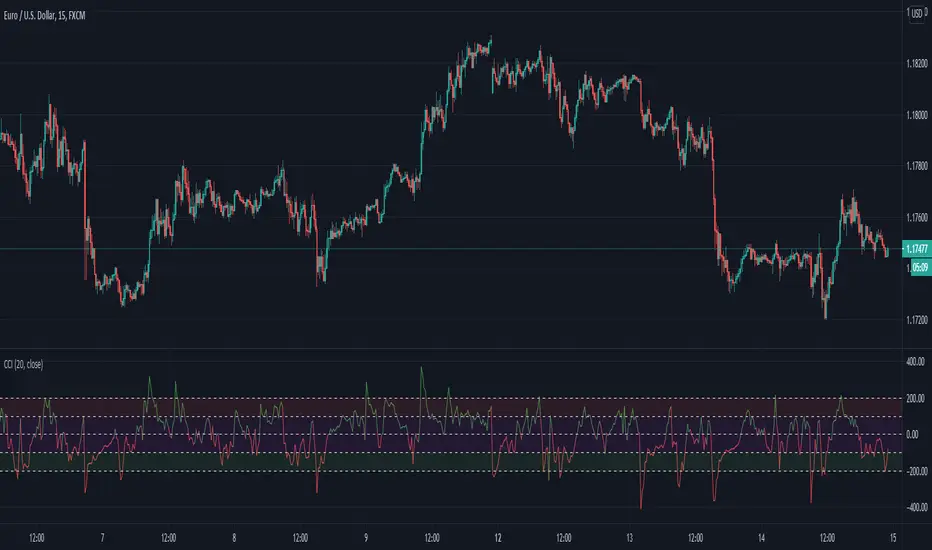
Commodity Channel Index + Relative Strength Index (Same Scale)Mashup, combining (adjusted) RSI and CCI.
These two indicators serve similar functions, but on different scales. I combined the two versions from the TradingView Built-In library into one chart, keeping the default setting for the CCI signal lines and fitting the RSI's default signal lines to them, so that they line up. I therefore adjusted the RSI to match the approximate range of the CCI and added additional lines to represent the maximum and minimum values of the RSI (0 - 100).
I did that by multiplying the RSI with 5, and subtracting 250.
Adjusted RSI = (RSI * 5) - 250
So the upper signal line (default: 70) now matches the line used for the CCI at 100. The lower signal line (default: 30) lines up with -100.
If you want to adjust them, you need to use the formula. I annotated the code if you want to dive deeper.
This indicator uses the original code and styling of the default Built-In RSI and CCI. Credit goes to the appropriate developers. My only intent is to mash up both of these indicators, making it easier to compare them.
Interpreting this indicator is the same as interpreting the underlying indicators. If you find any unexpected correlations, comment.
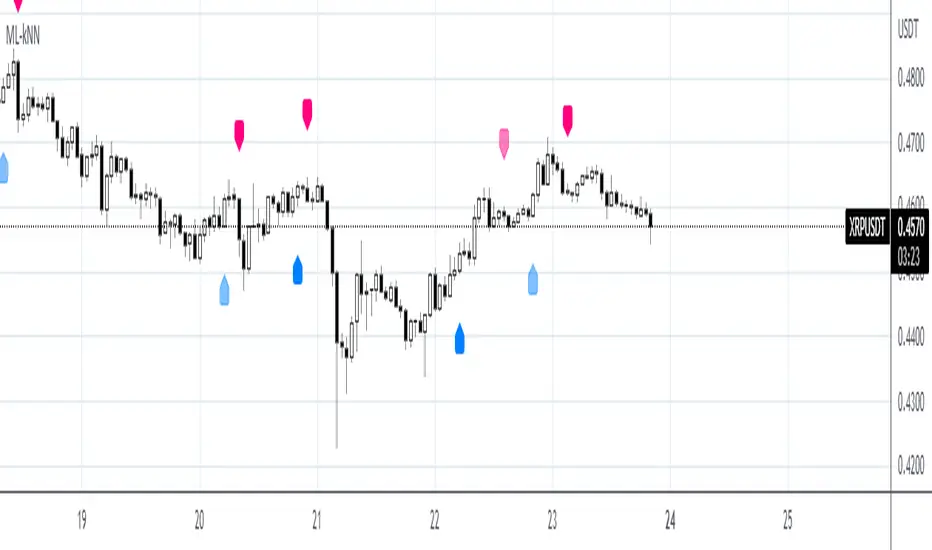
Machine Learning: kNN-based Strategy (update)kNN-based Strategy (FX and Crypto)
Description:
This update to the popular kNN-based strategy features:
improvements in the business logic,
an adjustible k value for the kNN model,
one more feature (MOM),
a streamlined signal filter and
some other minor fixes.
Now this script works in all timeframes !
I intentionally decided to publish this script separately
in order for the users to see the differences.

Trend MagicTrend Magic is originally a MT platform (MetaTrader) indicator and it can be used with any forex trading systems / strategies for additional confirmation of trading entries or exits. Converted the MT platform code to TradingView Pine version 4. Also you can use Multiple Time Frame.
It also works well with Crypto and Stock Markets.
Trend Magic consists of two main calculation parts as momentum and volatility:
First part is ATR based (like ATR Trailing Stop) logic, second part is all about CCI which also determines the color of Trend Magic.
Blue: when CCI is positive
Red: when CCI is negative
Also added alert condition regarding price crosses :
when LOW CrossesAbove TM
and HIGH CrossesBelow TM
Enjoy
Kıvanç Özbilgiç

The WWG Plan Indicator V2█ OVERALL
This indicator was specifically created for the Walsh Wealth Group.
In short it is a fusion of some of the most basic and widely used indicators to show overbought patterns and trend reversals.
Its best usage is with LTF scalping and agressive profit taking but can also be used to find HTF dips and buy-zones.
█ FEATURES
Buy Signal (Buy):
Printed only with all confirmations triggered
Small Buy Signal (B1 & B2)
Printed if some of the confirmations are triggered and can be treated as DCA entries or for further
confirmation with other indicators and basic TA.
Crayons (Color Bars):
Blue: RSI is oversold
Olive: RSI and Stoch RSI are oversold
Yellow: RSI, Stoch RSI are oversold and lower Bollinger Bands are crossed by Low
Orange: RSI, Stoch RSI and CCI are oversold
Trailing SL:
If activated in the config, a trailing SL can be displayed on the chart based on ATR.
█ SETTINGS
The underlying indicators used are RSI, Stoch RSI, Bollinger Bands, MACD and CCI.
All possible configs can be changed in the config settings.
█ GENERAL INFORMATION
Depending on the settings, the indicator performance will be highly affected.
This indicator is only displaying highly oversold areas and events of trend reversal it is not a *God*-Signal and will print false positives.
█ ALERTS
An alert for the main buy-signal is implemented and can be used via the TV alert functionality.

StochRSI x RSI x CCI x EMAsWanted to put this out there. Kind of a rough explanation but basically I wanted to build an indicator that takes out emotions and is easy to read. The indicator is basically RSI, stochRSI, CCI, and EMAs into an easy to read package. The traffic lights at the end will tell you if stochRSI/RSI and price action above according to EMA ribbon are in agreement. RSI with a period of 2 also always seemed very useful to me but it was just extremely distracting to look at it. I tried to make many rules in this indicator to find as much confluence between RSI, stochRSI, CCI, and EMAs to help you make better decisions. What is shown on the indicator is not necessarily a buy/sell signal. It should be seen as a way to view strength of price and possible momentum changes.
I find that one of the biggest distractions of indicators is taking your eyes off what is really happening at the chart above. This indicator uses popular and well used tools and helps you to get an easier visual of what is happening.
Purple lines at top and bottom: Short RSI ob/os
Red/orange and blue/green lines at top and bottom: When stochRSI kd and CCI also crosses +/- 100 or 200
Blue background: when stochRSI k > d and short RSI crosses above 30
Red background: when stochRSI k < d and short RSI crosses below 70
Green crosses: StochRSI is above 80 and making higher highs
Red X crosses: StochRSI is below 20 and making lower lows
Red/green fill of stochRSI and purple/blue dots on RSI: When short RSI and stochRSI are both ob/os
Red/green fill of RSI: Green when Long rsi > 50, red when Long rsi < 50
60/40 lines: Possible support/resistance for RSI
Traffic lights
1st light: Long RSI > EMA and stoch RSI k>d or vice versa
2nd light: Price above EMA 1 and 2 or vice versa
3rd light: when lights 1 and 2 are in agreement
Hope you enjoy!

Machine Learning: kNN-based StrategykNN-based Strategy (FX and Crypto)
Description:
This strategy uses a classic machine learning algorithm - k Nearest Neighbours (kNN) - to let you find a prediction for the next (tomorrow's, next month's, etc.) market move. Being an unsupervised machine learning algorithm, kNN is one of the most simple learning algorithms.
To do a prediction of the next market move, the kNN algorithm uses the historic data, collected in 3 arrays - feature1, feature2 and directions, - and finds the k-nearest
neighbours of the current indicator(s) values.
The two dimensional kNN algorithm just has a look on what has happened in the past when the two indicators had a similar level. It then looks at the k nearest neighbours,
sees their state and thus classifies the current point.
The kNN algorithm offers a framework to test all kinds of indicators easily to see if they have got any *predictive value*. One can easily add cog, wpr and others.
Note: TradingViews's playback feature helps to see this strategy in action.
Warning: Signals ARE repainting.
Style tags: Trend Following, Trend Analysis
Asset class: Equities, Futures, ETFs, Currencies and Commodities
Dataset: FX Minutes/Hours+++/Days
CCI colored RSIKnowing how to write code will hopefully be my saving grace with trading. Regardless, I have things to learn yet and the CCI indicator seems to get a lot of respect from chart-art minimalists.
On Investopedia, it says, “The CCI compares the current price to an average price over a period of time. The indicator fluctuates above or below zero, moving into positive or negative territory. While most values, approximately 75%, fall between -100 and +100, about 25% of the values fall outside this range, indicating a lot of weakness or strength in the price movement”
So I decided to have the regular RSI colored with information from the CCI that I just learned about. RSI color changes depending on whether or not the CCI was extended beyond the –100 and 100 extremities, as this indicates trend strength, and helps to not exit a trade early. Arrows are drawn for when the CCI crosses the 0 point of the CCI, which if overlaid, is the 50 on the RSI.
I have also added the option of having the background shaded according to CCI signals. Crosses OVER the –100 and 100 are the early and late bullish signals, while crosses UNDER the –100 and 100 are early and late bearish. I added to the RSI according to how Investopedia says to trade the CCI here.
www.investopedia.com
I added lines to the RSI to delineate the zones that Constance Brown talks about in her work with the RSI.
I kept the code simple to demonstrate my process, editing out lines instead of deleting, etc. I hope it helps somebody new to programming in Pine Script be able to hop right in.
Happy Turkey Day! Gobble Gobble. Say “Gobble Gobble” out loud. Do it.
Edit: Gratuity options removed. Try not to support terrorism this holiday season. And ffs turn off that race-baiting fact-destroying humanity threatening trash on your tv. We fight terrorism all day up in this mf. Savin stupid hoes and everything. Because it's the right thing to do. Not because Soros said so and paid TradingView enough.
Improved Commodity Channel IndexI took the normal CCI version and I made it better and more pleasantly visual.
At the same time now the CCI changes color based on the direction is going to take
We also have more levels, to define even better the current situation.
Details are simple :
green color cci = uptrend - > buy
red color cci = downtrend - > sell
Ehlers Adaptive Commodity Channel Index V1 [CC]The Adaptive Commodity Channel Index V1 was created by John Ehlers (Rocket Science For Traders pgs 236-237) and this is the typical Commodity Channel formula with the introduction of adaptive lengths based on his earlier work with indicators such as the Mother of Adaptive Moving Averages. For longer term signals you would get a bullish signal when CCI is above 0 and a bearish signal when CCI falls below 0. For shorter term signals you would get a bullish signal when crosses over it's overbought level or when it crosses above it's oversold level or vice versa. I have included both signals to make it easier.
Let me know if you want a custom script written or if you have a special request for me

CCI Strategy v2This was a strategy I found based on MT4. It takes CCI readings, then transforms them into a weighted moving average illustration. This is represented as:
Red Line - A six period moving average taken from CCI (NOT PRICE)
Green Line - A sixty-six period moving average taken from CCI (NOT PRICE)
Blue Line - CCI plotted
I have also added some levels and bollinger bands to highlight changes in activity.
The strategy is:
BUY - When the red line crosses upwards over green line.
SELL - When the red line crosses downwards over green line.
Extra confirmation is available by watching the blue line, it should be above red to buy, below red to sell. If the blue line drops in the opposite direction, this may be an opportunity to buy on a pull back.
If you wish for any modications to be applied, please do not hesitate to contact me.

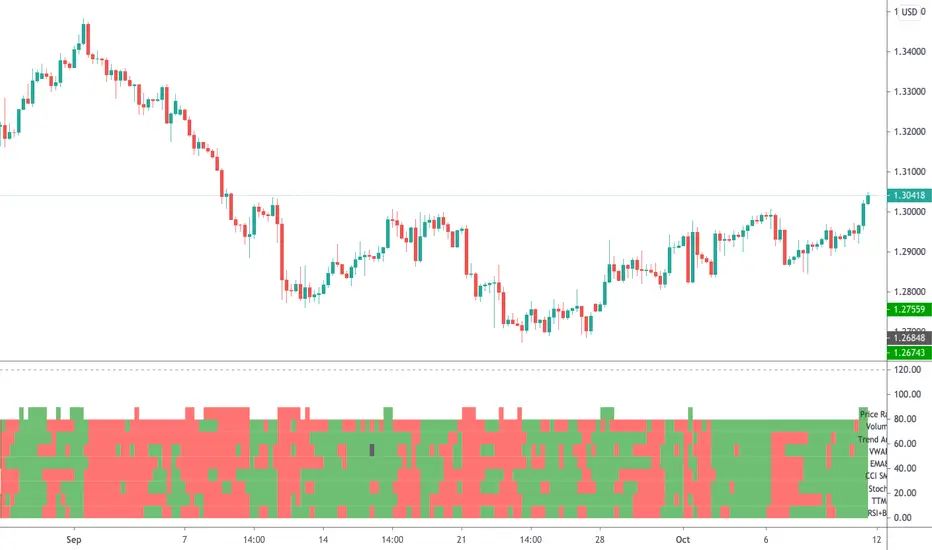
Radar Screen v3This is a combination of various indicators that very rarely conflict, thus giving us a good understanding:
- "Price Rally" detecting whether price is rallying, giving us confidence it will continue.
- Volume - knowing volume is going with the trend is a good confidence check.
- Trend Angle - This will go red or green depending on whether the price angle is going up or down, taken over three bars.
- VWAP for all of these stock traders.
- EMA8 is a very sensitive moving average, good for short term trades.
- CCI SMA is a strategy I commonly use, please check out my other indicators for a functional description.
- Stochastics is used throughout many systems.
- RSI BB shows where price is rebounding of the bollinger band and then moving up or down.
As per all of my indicators, the system is simple - The more green lines you see, the stronger the buy signal. The more red lines you see, the stronger the sell. If its a 50/50 mix of red and green, then don't trade.
I can customise this further or add other strategies, please message me.
CCI & EMA_CROSS_PaydarCCI & EMA_CROSS_Paydar
Hello everyone
This indicator is actually a very efficient oscillator,
This system is a unique combination of indicators CCI and EMA, which of course has special settings, these settings are adjusted as much as possible due to signaling.
As you can see in the picture:
CCI: the two colors line, green and red, are actually the same indicator CCI that I set to 20.
*Note that in index CCI I have set the lines +100 and -100 to +75 and -75 for less error and a stronger signal to sell or buy.
EMA: The white line, which is in the form of steps, is in fact the same indicator of EMA, which I have considered as a value of 9.
_________________________________________________________________________________________________________
Instructions
-> areas:
Zone +75 to +200 = positive range or incremental price or bullish
Zone +75 to -75 = Neutral range or almost constant price (no fluctuations or very wet fluctuations)
Zone -75 to -200 = single range or discount price or bearish
->How to use:
Buy = In the bearish range, if line CCI intersects line EMA upwards and goes to the neutral zone.
None = if the index (or index lines) collide in the neutral zone
Sell = In the bullish range, if line CCI intersects line EMA down and goes to the neutral zone.
-> Please comment on this system or if you have a good experience in changing the values of the indicators or it seems to you, please share.
With great respect to:
Who had published the main idea of this system.

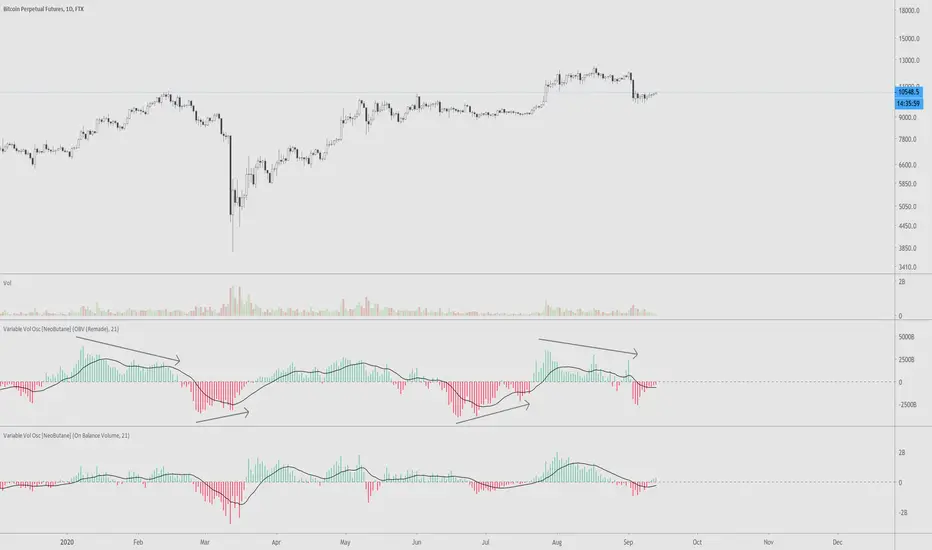
VVOscillator [nb]Multiple volume oscillators in one.
Description:
As Warren Guppet once said, be “fearful when others are buying less, and greedy when others are selling less.”
Divergences are the main point of usage of all bundled indicators.
OBV Oscillator, remade. The formula has been changed to smooth out the way OBV is calculated during a trending move
OBV Oscillator, original OBV formula.
Price Volume Trend Oscillator. Similar to OBV, except price is taken into account as well.
Price Volume Trend Oscillator, log.
Accumulation/Distribution. (close - low) - (high - close) / (high - low), then multiplied by volume
Chaikin Money Flow . Very similar to accum/dist except it was already made into an oscillator.
OBV just by itself. Change style to line for easier interpretation.
Experimental function that utilizes a part of CCI
This is the unedited "Variable Volume Oscillator v1" released for free use. In the time since I've created it, I've realized it's something I'd like to share because I like it and hope you will too.
CCI - SWIFF KNIFECCI indicator swiff knife.
A lot of different usages of CCI ae possible with this script :
- 2 CCI lines crossovers.
- CCI - 0 Line crossovers
- CCI + Moving Average crossovers (many types of MA are available)
Filters can be added.
CCI can be used as a confirmation indicator, a continuation indicator, an exit indicator, a chopiness indicator .... It can even make coffee, who knows.

CCI Indicator [SystemAlpha]This is a CCI indicator enhanced with:
- Show Alert
- Fill on oversold and overbought levels
- Show Regular and Hidden divergence
- Show Divergence Labels
