Auto Pitchfork, Fib Retracement and Zig Zag by DGTPitchfork is a technical indicator for a quick and easy way for traders to identify possible levels of support and resistance of an asset's price. It is presents and based on the idea that the market is geometric and cyclical in nature
Developed by Alan Andrews, so sometimes called Andrews’ Pitchfork
It is created by placing three points at the end of previous trends
Schiff and Modified Pitchfork is a technical analysis tool derived from Andrews' Pitchfork
In general, traders will purchase the asset when the price falls near the support of either the center trendline or the lowest trendline. Conversely, they'll sell the asset when it approaches the resistance of either the center line or the highest trendline.
█ Study OPTIONS
Auto Pitchfork , the main aim of the study
Pivots threshold can be customized by “Deviation” and “Depth” input options
Pitchfork Type selection, available options Andrews' Pitchfork (Original), Schiff and Modified Pitchfork
Ability to set ALERTs for the Pitchfork Levels
Ability to add customized levels (all level lines customizable)
Auto Fib Retracement – This is the build-in study of TradingView, slight changes applied to fit with Auto Pitchfork
Zig Zag – Derived from build-in Auto Fib Retracement with some customization options.
█ Usage Tips :
Andrews' Pitchfork (Original) best fit in a Strong Trending Market
Schiff and Modified Pitchfork better with Correcting or Sideways Market. Modified Pitchfork is almost identical to a Parallel Chanel
Disclaimer :
Trading success is all about following your trading strategy and the indicators should fit within your trading strategy, and not to be traded upon solely
The script is for informational and educational purposes only. Use of the script does not constitute professional and/or financial advice. You alone have the sole responsibility of evaluating the script output and risks associated with the use of the script. In exchange for using the script, you agree not to hold dgtrd TradingView user liable for any possible claim for damages arising from any decision you make based on use of the script
Grafik Formasyonları

Donchian Channels Trending Breakout StrategyThis script looks for two entry signals. Long is when the previous breakout of the donchian channels was a low, price is above the input EMA, current price is equal or higher than the upper band and we're not in a position yet. Short is the other way around, so previous breakout of the donchian channels was a high, price is below the input EMA, current price is equal or lower than the lower band.
I haven't found a script that does take the previous highs and lows into consideration. Works for any markets in any conditions because the stop loss and profit targets are based on the upper and lower band of the donchian channels, which means the stop loss and profit targets move with the trend.
For more details see the script itself, I wrote a ton of comments.

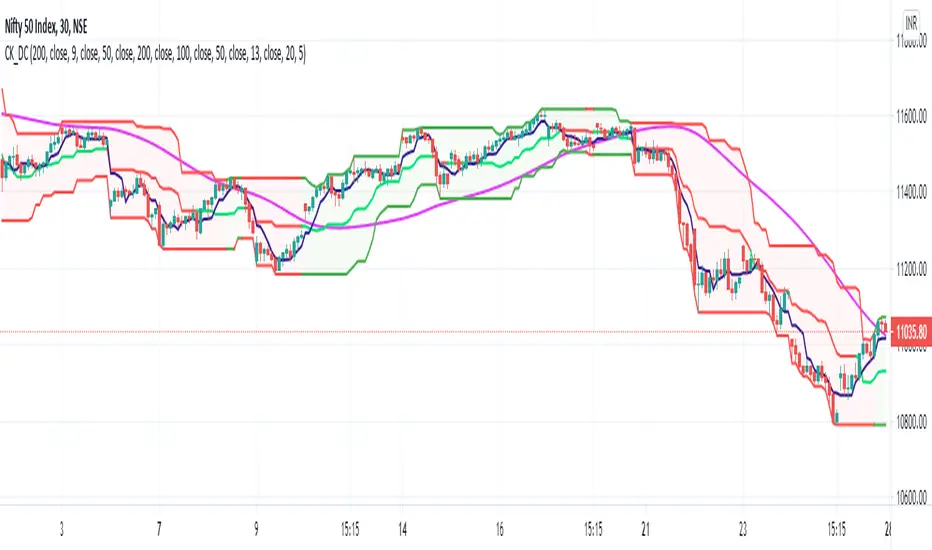
Modified Donchian ChannelRelease Note:
This indicator setup highly inspired by Donchian Channel and Hull Moving Average. Big thanks to both Richard Donchian and Alan Hull.
Back test and live test it and come to conclusion of how to use this indicator for live trading.
200 HMA:
200 Hull Moving Average plays major role in deciding the right trades using Donchian Channel. As part of this setup,
If price is below 200 HMA, then the Donchian Channel is highlighted in Red color
If price is above 200 HMA, then the Donchian Channel is highlighted in Green color
Donchian Channel:
Default 20 period is used for the Donchian channel. However, the color highlight as per 200 HMA position. Also, the middle basis color changes to Green and Red based on candle close of above or below.
Additionally, 5 period Donchian basis is used as tight stop loss. This can be used wisely or optionally based on trade decisions
Disclaimer:
//Idea of publishing this script is to identify the strength of the instrument using multiple confirmation.
//Using this indicator, changing inputs, and trading decisions are up to the users/traders.
//Courtesy: Thanks to Richard Donchian and Alan Hull as this indicator/script inspired by Donchian Channels and Hull Moving Average
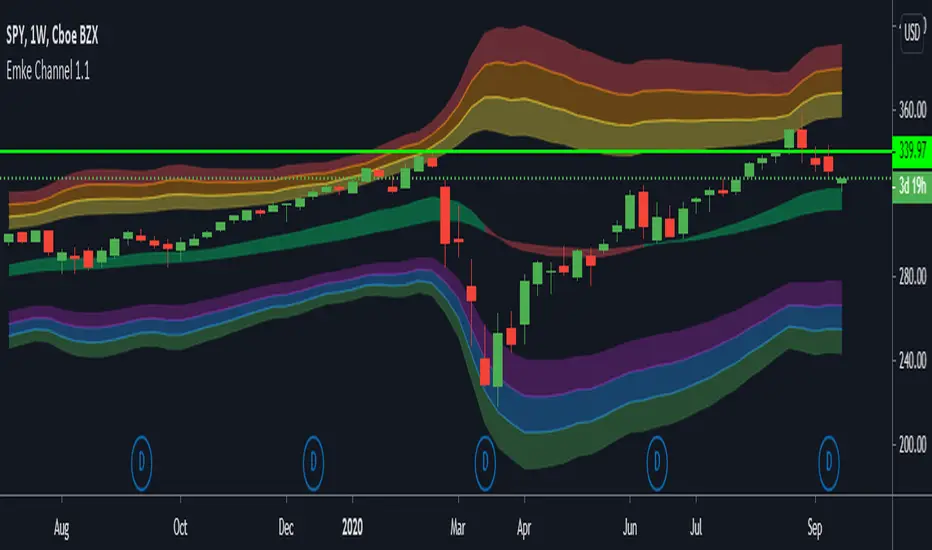
EMA Keltner Channel 1D100/200 EMAs, along with Keltner Bands based off them. Colors correspond to actions you should be ready to take in the area. Use to set macro mindset.
Uses the security function to display only the 1D values.
Red= Bad
Orange = Not as Bad, but still Bad.
Yellow = Warning, might also be Bad.
Purple = Dip a toe in.
Blue = Give it a shot but have a little caution.
Green = It's second mortgage time.
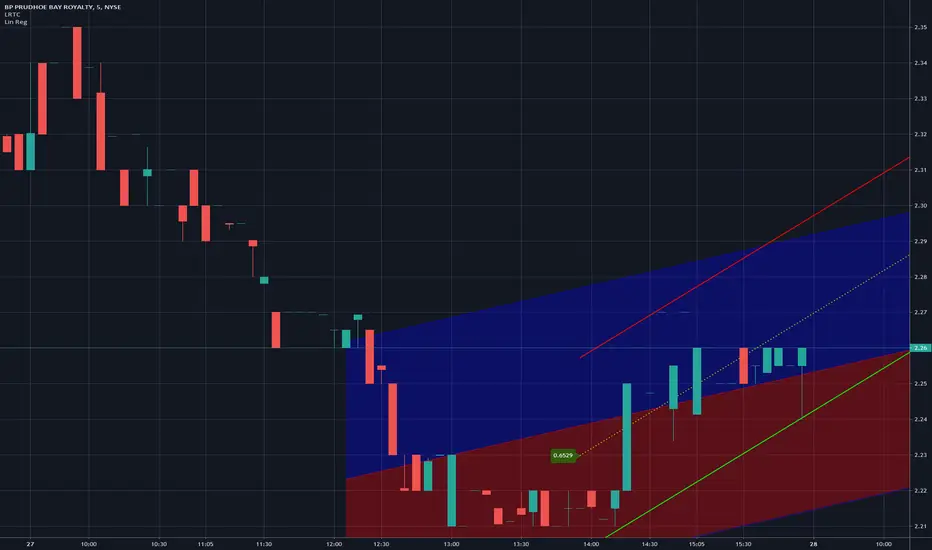
Optimized Linear Regression ChannelReturn a linear regression channel with a window size within the range (min, max) such that the R-squared is maximized, this allows a better estimate of an underlying linear trend, a better detection of significant historical supports and resistance points, and avoid finding a good window size manually.
Settings
Min : Minimum window size value
Max : Maximum window size value
Mult : Multiplicative factor for the rmse, control the channel width.
Src : Source input of the indicator
Details
The indicator displays the specific window size that maximizes the R-squared at the bottom of the lower channel.
When optimizing we want to find parameters such that they maximize or minimize a certain function, here the r-squared. The R-squared is given by 1 minus the ratio between the sum of squares (SSE) of the linear regression and the sum of squares of the mean. We know that the mean will always produce an SSE greater or equal to the one of the linear regression, so the R-squared will always be in a (0,1) range. In the case our data has a linear trend, the linear regression will have a better fit, thus having a lower SSE than the SSE of the mean, has such the ratio between the linear regression SSE and the mean SSE will be low, 1 minus this ratio will return a greater result. A lower R-squared will tell you that your linear regression produces a fit similar to the one produced by the mean. The R-squared is also given by the square of the correlation coefficient between the dependent and independent variables.
In pinescript optimization can be done by running a function inside a loop, we run the function for each setting and keep the one that produces the maximum or minimum result, however, it is not possible to do that with most built-in functions, including the function of interest, correlation , as such we must recreate a rolling correlation function that can be used inside loops, such functions are generally loops-free, this means that they are not computed using a loop in the first place, fortunately, the rolling correlation function is simply based on moving averages and standard deviations, both can be computed without using a loop by using cumulative sums, this is what is done in the code.
Note that because the R-squared is based on the SSE of the linear regression, maximizing the R-squared also minimizes the linear regression SSE, another thing that is minimized is the horizontality of the fit.
In the example above we have a total window size of 27, the script will try to find the setting that maximizes the R-squared, we must avoid every data points before the volatile bearish candle, using any of these data points will produce a poor fit, we see that the script avoid it, thus running as expected. Another interesting thing is that the best R-squared is not always associated to the lowest window size.
Note that optimization does not fix core problems in a model, with the linear regression we assume that our data set posses a linear trend, if it's not the case, then no matter how many settings you use you will still have a model that is not adapted to your data.

TF Segmented Linear RegressionFit a line at successive intervals, where the interval period is determined by a user-selected time frame, this allows the user to have an estimate of the intrinsic trend within various intervals.
Settings
Timeframe : Determine the period of the interval, if the timeframe is weekly then a new line will be fit at the start each weeks, by default "Daily"
Mult : Multiplication factor for the RMSE, determine the distance between the upper and lower extremities
Src : Input data for the indicator
Plot Extremities : Logical value, if true then the extremities of the channel are plotted, if false only the midline is plotted, true by default.
Usage
The timeframe setting should be higher than the current chart timeframe, note however that too large values of timeframe might return an error. Since the maximum number of lines that can be plotted is 54, using the extremities will only return 18 channels.
The indicator can be compared to the "regression trend" drawing tool
Main tf = 5 min with the indicator using a daily timeframe, the filled area is produced by the regression trend drawing tool using the same interval as the indicator, and coincide with it.
Main tf = 15 min with the indicator using a weekly timeframe, wider channel indicate that the values tend to be farther away from the fitted line.
A line with a significant slope indicates a strong trend, in that case, the width of the channel is determined by the amplitude of the retracements in the trend, with a narrower channel indicating a cleaner trend.
When the fitted line has a low slope value and the channel is wide, it means that there were two or more variations of opposite directions with large amplitudes within the interval, this also indicates that a linear model is not appropriate.
A slope approximately equal to 0 with a low channel width indicates a trendless market with cyclical variations of low amplitude in it.
Refrences
Determining the starting and ending points of the fitted line was done using a linear combination between the wma and sma
The wma and sma functions both use a series as period by making use of the Wma and Sum functions in the following script

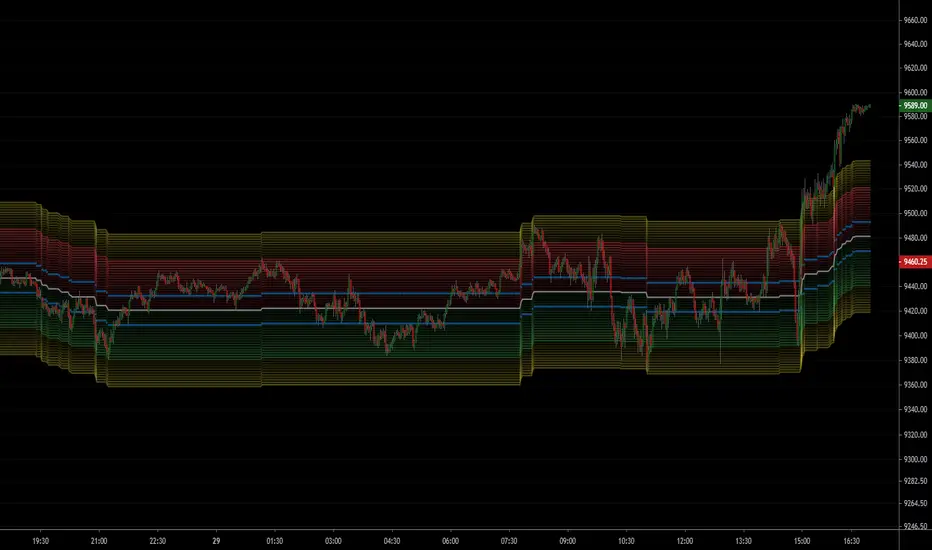
NSDT ES Midline Zones**DESIGNED FOR ES/MES** This script provides an easy visualization of potential reversion zones to take trades back to the intraday midline. A common use would be to enter a position once price reached the outer yellow zones and retreats to either the red zone (for a short toward the midline) or a green zone (for a long back to the midline).

NSDT NQ Midline Zones**DESIGNED FOR NQ/MNQ** This script provides an easy visualization of potential reversion zones to take trades back to the intraday midline. A common use would be to enter a position once price reached the outer yellow zones and retreats to either the red zone (for a short toward the midline) or a green zone (for a long back to the midline).
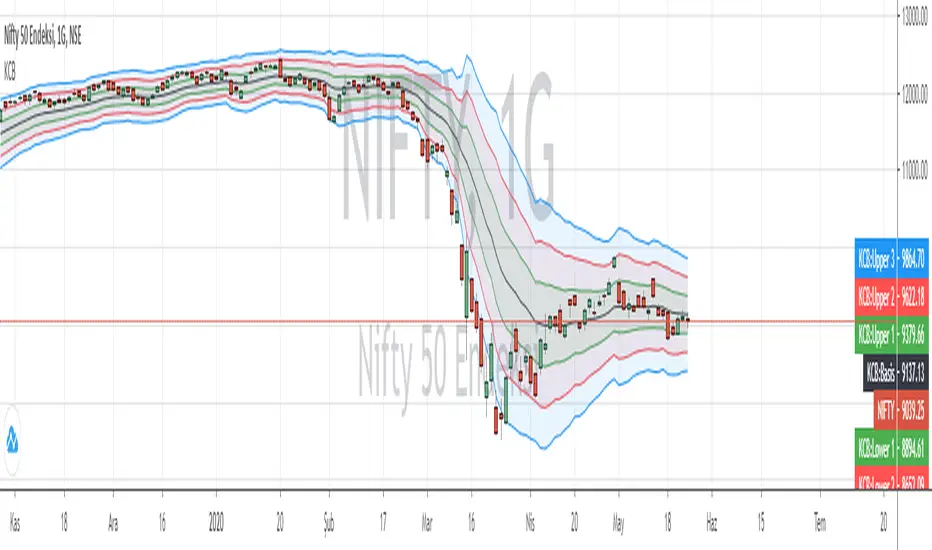
Bollinger Channels / EMA and SMAThis is written as a system to replace the BB strategy.
I think it will work well.
It looks pretty stylish.
Description / Usage:
Adjust the length and multiplier based on your location with Bollinger Bands.
The multiplier of 1 provides you with a basic channel with high and low-source EMA (or SMA).
And with the 8-day exponential moving average, you can observe short entries and exits.
I wish good luck to the friends who will use it.
You can support and track new indicators.
Bu, BB stratejisinin yerini alacak bir sistem olarak yazılmıştır.
Oldukça şık görünüyor.
Kullanım
Bollinger Bantları ile bulunduğunuz yere göre uzunluk ve çarpanı ayarlayın.
1 çarpanı size yüksek ve düşük kaynaklı EMA (veya SMA) içeren temel bir kanal sağlar.
Ve 8 günlük üstel hareketli ortalama ile kısa giriş ve çıkışları gözlemleyebilirsiniz.
Kullanacak arkadaşlara bol kazançlar diliyorum.
Yeni indikatör için destek olabilir ve takip edebilirsiniz.

Efficient Trend Step ChannelIntroduction
The efficient trend-step indicator is a trend indicator that make use of the efficiency ratio in order to adapt to the market trend strength, this indicator originally aimed to remain static during ranging states while fitting the price only when large variations occur. The trend step indicator family unlike most moving averages has a boxy appearance and could therefore not be classified as smooth, this makes it an indicator relatively uninteresting to use as input for other non-trending indicators such as oscillators.
Today a channel indicator making use of the efficient trend-step is proposed, the indicator has an upper and a lower extremity who can be used for breakout or support and resistance methodologies, however we will see that the indicator is sometimes able to return accurate support and resistance levels.
The Indicator
The indicator has the same settings has the efficient trend step indicator, length control the period of the efficiency ratio, fast control the period of the rolling standard deviation used for trending states, slow control the period of the rolling standard deviation used for ranging states, fast should be lower than slow , if both are equal then the indicator is equal to the classical trend step indicator and length does no longer affect the indicator output. Lower values of fast/slow will make the indicator more reactive to small variations thus changing direction more often.
The color changes you can see on the indicator are changed depending on the prior direction took by the indicator output, if the indicator where higher than its precedent value, then the color will be blue until the indicator is lower than its precedent value. Those colors help you have an estimate of the current trend direction.
Channel Calculation And Role
The extremities made from the efficient trend step allow for more advanced trading rules, they can act as stop/target level and can also give a rough estimate of the current market volatility, with wider extremities indicating a more volatile market.
The extremities are made directly from the dev element used by the efficient trend-step, the upper extremity is made by summing the efficient trend step with the value of dev when the efficient trend step change, the lower extremity is made the same way but the value is subtracted instead.
Is it a weird choice ? It sure is strange to see such approach, the absolute rolling average error between the price and the efficient trend step could have been a logical measure but using dev instead is more efficient and also allow for a more adaptive approach which can benefit the support and resistance methodology, the last reason is because i didn't wanted to "denature" the trend-step signature of the indicator.
The figure above represent the measurement used for making the extremities (in green).
Since the previously described measure change only when the efficient trend step change, we can conclude that such measure is representative of a relatively large variation, since the efficient trend step aim to only change when a large variations appear.
We can see that the upper extremity acted as an accurate resistance in this upper variation of AMD,
Here as well, however like other bands indicators it is safer to take into account the current trend direction, a strong uptrend will have less difficulties crossing the upper extremity, therefore it might be better to rely on the support (lower extremity) on an up-trending market (indicator in blue), and on the resistance (upper extremity) on an down-trending market (indicator in orange).
The figure above show support and resistances signals, a cross represent a false signal, while green arrows represent correct ones with their respective direction.
Conclusion
The presented indicator add more possibilities to the interpretation of the efficient trend step, the extremities can act as stop/target level, however this use has to be controlled, and the level should be in accordance to your risk/reward ratio.
Showcasing another trend-step indicator was a real pleasure. Thanks for reading :)

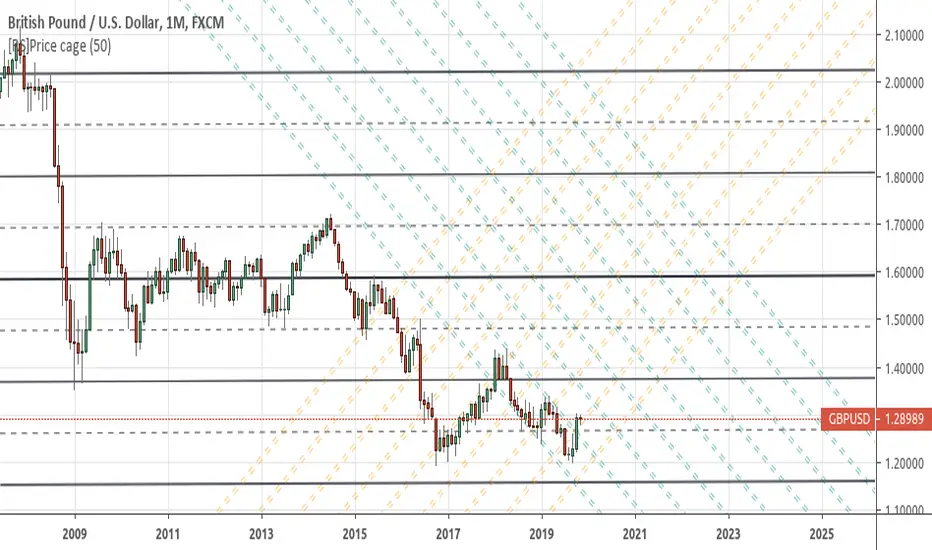
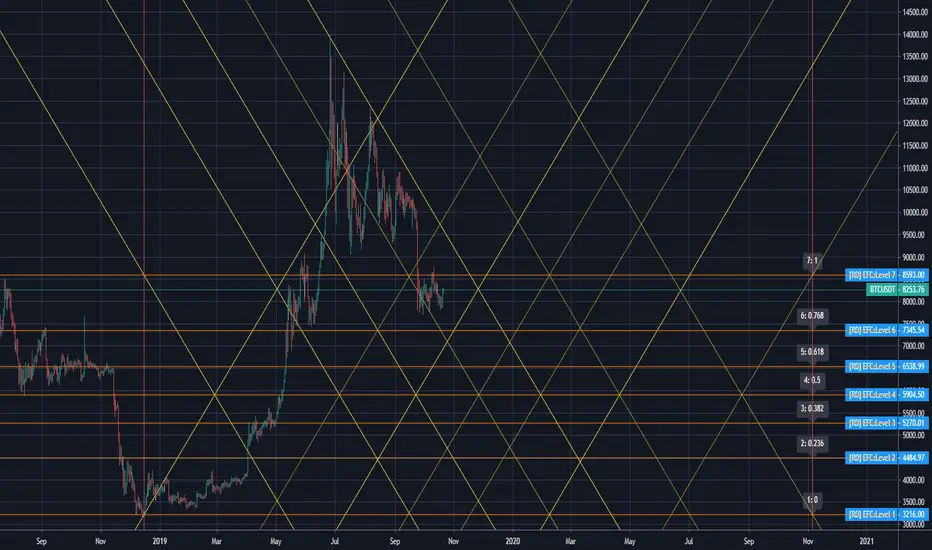
[RD] Easy Fibonacci Channels==================================================================
October 21 2019 - Easy Fibonacci Channels - by RootDuk
==================================================================
Easy adaptable fibonacci channels. By changing the levels you can adapt
the lines as needed. There's also global params to use for horizontal and
vertical scaling.
===================================================================
Notes
===================================================================
None so far
===================================================================
Updates
===================================================================
Non so far
Price-Curve ChannelIntroduction
Although many will use lines in order to make support and resistances, others might use curves, this is logical since trends are not always linear. Therefore it was also important to take this into consideration, and when i published the price-line channel indicator, i already started a curved version of it. Therefore i propose this new indicator based on the recursive bands framework that allow to return curved support and resistances. The benefits of this indicator are : a totally stable approach, user friendly, and extremities able to converge faster toward the price.
The Indicator
The indicator is way faster than the price-line channel one, this is due to the fast convergence toward the price of the extremities. Length control the reactivity of the indicator, while mult is more related to the rate of convergence, values of mult lower than 1 will make the curve converge slower,
mult = .5
Higher values of mult will make the extremities converge faster toward the price.
mult = 2
Unlike the price-line channel indicator this one is directly "readjusted", this is due to the fact that the extremities are no longer linear, of course a "perfectly" curved version could come in an update, but for the moment it wasn't really a necessity.
Comparison With Price-Line
The fact that the extremities converge faster toward the price allow to possibly capture more tops/bottoms/retracements. However the extremities of both indicator have the same behavior regarding their accuracy, for example the upper extremity have a higher chance to detect a retracement when on a downtrend, while the lower extremity have higher chance to detect a retracement while on a up-trend.
On The Indicator Construction
The recursive bands framework is the core of the indicator, it is important to use it. The curved effect is given by multiplying the correction factor by the barssince function, therefore the correction factor is no longer constant which in return allow for a non linear output.
The size is divided by the square of length in order to keep a certain logic between the output and the length period.
Conclusion
The recursive bands framework prove again to be quite interesting, lot of indicators can be made using it, i only posted a fraction of what can be done with it, which make the recursive bands indicator one of the best indicators i ever made in my opinion.
The proposed indicator is stable, and don't require nightmarish manipulations (unlike the linear channels indicator), its ability to detect possible support and resistances points, although subjective, remain a feature of the indicator. The use of recursion make the indicator efficient. I hope the indicator find some use in the community.
Thanks for reading !
Linear version.
Note
Respect the house rules, always request permission before publishing open source code. This is an original work, requesting permission is the least you can do.
I apologize for any grammatical/orthographic error in this post.

Price-Line Channel - A Friendly Support And Resistance IndicatorIntroduction
Lines are the most widely used figures in technical analysis, this is due to the linear trends that some securities posses (daily log SP500 for example), support and resistances are also responsible for the uses of lines, basically linear support and resistances are made with the assumption that the line connecting two local maximas or minimas will help the user detect a new local maxima or minima when the price will cross the line.
Technical indicators attempting to output lines have always been a concern in technical analysis, the mostly know certainly being the linear regression, however any linear models would fit in this category. In general those indicators always reevaluate their outputs values (repainting), others non repainting indicators returning lines are sometimes to impractical to set-up. This is what has encouraged me to make a simpler indicator based on the framework used in the recursive bands indicator that i published.
The proposed indicator aim to be extremely flexible and easy to use while returning linear support and resistances, an option that allow readjustment is also introduced, thus allowing for a "smarter" indicator.
The Indicator
The indicator return two extremities, the upper one aim to detect resistance points while the lower one aim to detect support points. The length setting control the steepness of the line, with higher values of length involving a lower slope, this make the indicator less reactive and interact with the price less often.
The name "price-line" comes from the fact that the channel is dependent on its own interaction with the price, therefore a breakout methodology can also be used, where price is up-trending when crossing with the upper extremity and down trending when crossing with the lower one.
Readjusted Option
The line steepness can be readjusted based on the market volatility, it make more sense for the line to be more steep when the market is more volatile, thus making it converge faster toward the price, this of course is done at the cost of some linearity. This is achieved by checking the "readjustment" option. The effects can be shown on BTCUSD, below the indicator without the readjusted option :
when the "readjustment" option is checked we have the following results :
The volatile down movement on BTCUSd make the upper extremity converge faster toward the price, this option can be great for volatile markets.
Conclusion
The recursive bands indicator prove to be an excellent framework that allow for the creation of lots of indicators, the proposed indicator is extremely efficient and provide an easy solution for returning linear support and resistances without much drawbacks, the readjusted option allow the indicator to adapt to the market volatility at the cost of linearity.
The performance of the indicator is relative to the motion of the price, however the indicator show signs of returning accurate support and resistances points. I hope the indicator find its use in the community.
Thanks for reading !
Note
Respect the house rules, always request permission before publishing open source code. This is an original work, requesting permission is the least you can do.

G-Channels - Efficient Calculation Of Upper/Lower ExtremitiesIntroduction
Channels indicators are widely used in technical analysis, they provide lot of information. In general, technical indicators giving upper/lower extremities are calculated by adding/subtracting a volatility component to a central tendency estimator. This is the case with Bollinger bands, using the rolling standard deviation as volatility estimator and the simple moving average as central tendency estimator, or the Keltner channels using the exponential moving average and the average true range.
Lots and lots and lots (i can go on) of those indicators have been made, they only really need a central tendency estimator, which can be obtained from pretty much any filter, however i find interesting to focus on the efficiency of those indicators, therefore i propose a super efficient channel indicator using recursion. The average resulting from the upper/lower extremity of the indicator provide a new efficient filter similar to the average highest/lowest.
The calculation - How Does It Works
Efficiency is often associated to recursion, this would allow us to use past output values as input, so how does the indicator is calculated? Lets look at the upper band calculation :
a := max(src,nz(a(1))) - nz(a(1) - b(1))/length
src is the closing price, a is upper extremity, b is the lower one. Here we only need 3 values, the previous values of a and b and the closing price. Basically a := max(src,nz(a(1))) mean :
if the closing price is greater than the precedent value of a then output the closing price, else output the precedent value of a
therefore a will never be inferior to its precedent value, this is useful for getting the maximum price value in our dataset however its not useful to make an upper band, therefore we subtract this to a correction factor defined as the difference between a and b , this force the upper band to have lower values thus acting like a band without loosing its "upper" property, a similar process is done with the lower band.
Of course we could only use 2 values for making the indicator, thus ending with :
a := max(src,nz(a(1))) - nz(abs(close - a(1))/length
In fact this implementation is the same as the one proposed in my paper "Recursive Bands - A New Indicator For Technical Analysis", its also what i used for making the indicator "Adaptive Trailing Stop", this would be more efficient but i used the difference between the upper and lower extremities for a reason.
The Central tendency Estimator
This is the reason why i didn't implemented a more efficient version. Basically this central tendency estimator is just the average between the upper and lower extremities, it behave like the average of the highest/lowest over length period, its central plot in the Donchian channel indicator. Below is a comparison of both with length = 100 :
But why is our average so "boxy"? The extremities are not boxy, so why the average is sometimes equal to its previous value? Explain!
Its super easy to understand, imagine two lines, if their absolute change is the same and they follow an opposite direction, then their average is constant.
the average of the green and red line is the orange line. If both lines follow the same direction then their average will also follow this direction.
When both extremities follow the same direction, the average will also do the same, when both follow an opposite direction then the average will be equal to its precedent value, this is also due to the fact that both extremities are based on the same correction factor (a-b) , else the average wouldn't act that way, now you understand why i made this choice.
Conclusion
I proposed an efficient implementation of a channel indicator that provide an interesting central tendency estimator. This simple implementation would allow for tons of interesting concepts, some of my indicators use a similar approach and allow for great outputs, you'll see them soon enough. I hope this indicator find its use in the community, remember to ask before using this indicator in a script you want to publish.
Thanks for reading !
If you want to discuss about anime stuff send me a pm but don't do it in the commend section.


Linear Regression Trend ChannelThis is my first public release of indicator code and my PSv4.0 version of "Linear Regression Channel", as it is more commonly known. It replicates TV's built-in "Linear Regression" without the distraction of heavy red/blue fill bleeding into other indicators. We can't fill() line.new() at this time in Pine Script anyways. I entitled it Linear Regression Trend Channel, simply because it seems more accurate as a proper description. I nicely packaged this to the size of an ordinary napkin within 20 lines of compact code, simplifying the math to the most efficient script I could devise that fits in your pocket. This is commonly what my dense intricate code looks like behind the veil, and if you are wondering why there is no notes, that's because the notation is in the variable naming. I excluded Pearson correlation because it doesn't seem very useful to me, and it would comprise of additional lines of code I would rather avoid in this public release. Pearson correlation is included in my invite-only advanced version of "Enhanced Linear Regression Trend Channel", where I have taken Linear Regression Channeling to another level of fully featured novel attainability using this original source code.
Features List Includes:
"Period" adjustment
"Deviation(s)" adjustment
"Extend Method" option to extend or not extend the upper, medial, and lower channeling
Showcased in the chart below is my free to use "Enhanced Schaff Trend Cycle Indicator", having a common appeal to TV users frequently. If you do have any questions or comments regarding this indicator, I will consider your inquiries, thoughts, and ideas presented below in the comments section, when time provides it. As always, "Like" it if you simply just like it with a proper thumbs up, and also return to my scripts list occasionally for additional postings. Have a profitable future everyone!
Kaufman Adaptive BandsIntroduction
Bands are quite efficient in technical analysis, they can provide support and resistance levels, provide breakouts points, trailing stop loss/take profits positions and can show the current market volatility to the user. Most of the time bands are made from a central tendency estimator like a moving average plus/minus a volatility indicator. Therefore bands can be made out of pretty much everything thus allowing for any kind of flavors.
So i propose a band indicator made from a Kaufman adaptive moving average using an estimate of the standard deviation.
Construction
The Kaufman moving average is an exponential averager using the efficiency ratio as smoothing variable, length control the period of kama and in order to provide more smoothness a power parameter has been introduced, higher values of power will return smoother results.
The volatility indicator is made from a biased estimation of the standard deviation by using the square root of the mean of the square minus the square of the mean method, except that we use kama instead of a mean.
The bands are made by adding/subtracting this volatility indicator with kama.
How To Use
The ability of the indicator to adapt to the current market state is what makes him a great tool for avoiding major exposition during ranging market, therefore the indicator will have a greater motion during trending market, or more simply the bands will move during trending markets while staying "flat" during ranging ones. Therefore the indicator might be more suited to breakouts, even if some cases will return what where turning points, this is particularly true during ranging markets.
Of course the efficiency ratio is not an "unbiased" trend metric indicator, it can consider high volatility markets as trending markets. Its one of his downsides.
High values of power will create smoother bands.
When using a low power parameter use an higher mult. In general using a low power value will make the bands move more freely as well as making them closer to each others.
Conclusion
At least the indicator is really nice to the eyes when using high power values, its ability to adapt to the market is a great addition to other more classical bands indicators, i also introduced a volatility estimator based on kama, some might have used the following estimation : kama(abs(price - kama)) which would have created a slower result. A trailing stop might be made from it if i see request about such addition.
If you are curious here are some more images of the indicator performing on different markets. Thanks for reading !

Combo Strategy 123 Reversal & CCI This is combo strategies for get a cumulative signal.
First strategy
This System was created from the Book "How I Tripled My Money In The
Futures Market" by Ulf Jensen, Page 183. This is reverse type of strategies.
The strategy buys at market, if close price is higher than the previous close
during 2 days and the meaning of 9-days Stochastic Slow Oscillator is lower than 50.
The strategy sells at market, if close price is lower than the previous close price
during 2 days and the meaning of 9-days Stochastic Fast Oscillator is higher than 50.
Second strategy
The Commodity Channel Index (CCI) is best used with markets that display cyclical or
seasonal characteristics, and is formulated to detect the beginning and ending of these
cycles by incorporating a moving average together with a divisor that reflects both possible
and actual trading ranges. The final index measures the deviation from normal, which indicates
major changes in market trend.
To put it simply, the Commodity Channel Index (CCI) value shows how the instrument is trading
relative to its mean (average) price. When the CCI value is high, it means that the prices are
high compared to the average price; when the CCI value is down, it means that the prices are low
compared to the average price. The CCI value usually does not fall outside the -300 to 300 range
and, in fact, is usually in the -100 to 100 range.
WARNING:
- For purpose educate only
- This script to change bars colors.