Double Tops & Bottoms [QuantVue]This indicator is designed to detect and plot Double Tops and Double Bottoms, by setting the initial high or low using standard pivot points.
Double Tops
A Double Top is a bearish reversal pattern, typically found when an uptrend returns back to a prior peak. It signifies a potential turning point or resistance level and could potentially reverse in direction.
The pattern is confirmed as a Double Top when the price breaks above the resistance level, but closes below it. A decisive close below this level is seen as a confirmation of the bearish trend.
Double Bottoms
A Double Bottom, on the other hand, is a bullish reversal pattern typically found after a downtrend. It signals a potential turning point or support level where the price has bottomed and could potentially reverse upwards.
The pattern is confirmed as a Double Bottom when the price breaks below the support level, but closes above it. A decisive close above this level is viewed as a confirmation of the bullish trend.
Indicator Features
🔹Double Top Detection: When a double top is identified, a downward-pointing triangle will be plotted above the bar, and if the alerts are enabled, a notification will be triggered.
🔹Double Bottom Detection: When a double bottom is identified, an upward-pointing triangle will be plotted below the bar, and if the alerts are enabled, a notification will be triggered.
🔹Pivot Lookback: Defines the number of bars to the left and right of the pivot that must be lower/higher to qualify as a pivot.
🔹Maximum Length Between Tops/Bottoms: Maximum number of bars between two tops/bottoms to be considered a double top or bottom.
🔹Style Settings: Allows the user to customize the appearance of the lines indicating the tops/bottoms. Options include color selection, line style (dotted, dashed, or solid), and line thickness.
🔹Alerts: The user can enable or disable alerts for Double Top and Double Bottom.
Give this indicator a BOOST and COMMENT your thoughts!
We hope you enjoy.
Cheers!
Grafik Formasyonları

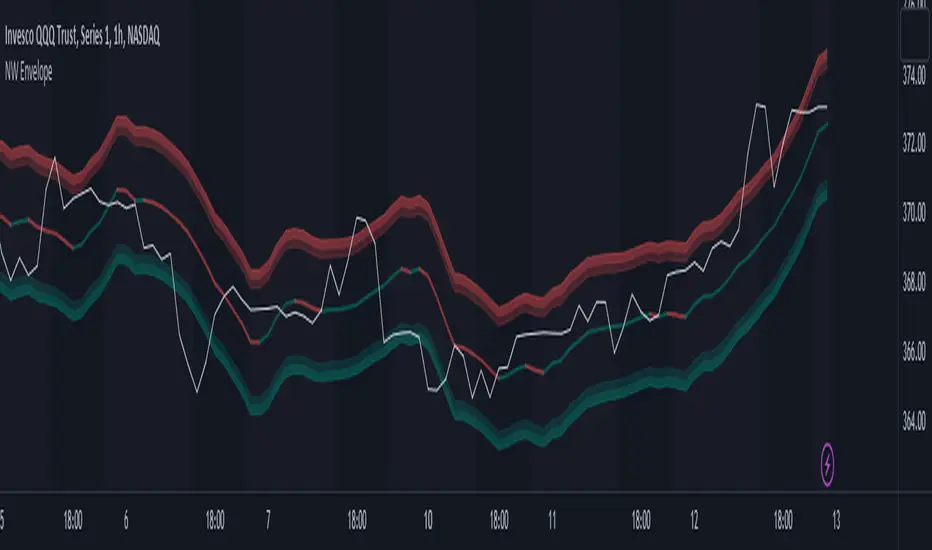
Nadaraya-Watson Envelope (Non-Repainting) Logarithmic ScaleIn the fast-paced world of trading, having a reliable and accurate indicator can make all the difference. Enter the Nadaraya-Watson Envelope Indicator, a cutting-edge tool designed to provide traders with valuable insights into market trends and potential price movements. In this article, we'll explore the advantages of this non-repainting indicator and how it can empower traders to make informed decisions with confidence.
Accurate Price Analysis:
The Nadaraya-Watson Envelope Indicator operates in a logarithmic scale, allowing for more accurate price analysis. By considering the logarithmic nature of price movements, this indicator captures the subtle nuances of market dynamics, providing a comprehensive view of price action. Traders can leverage this advantage to identify key support and resistance levels, spot potential breakouts, and anticipate trend reversals.
Non-Repainting Reliability:
One of the most significant advantages of the Nadaraya-Watson Envelope Indicator is its non-repainting nature. Repainting indicators can mislead traders by changing historical signals, making it difficult to evaluate past performance accurately. With the non-repainting characteristic of this indicator, traders can have confidence in the reliability and consistency of the signals generated, ensuring more accurate backtesting and decision-making.
Customizable Parameters:
Every trader has unique preferences and trading styles. The Nadaraya-Watson Envelope Indicator offers a range of customizable parameters, allowing traders to fine-tune the indicator to their specific needs. From adjusting the lookback window and relative weighting to defining the start of regression, traders have the flexibility to adapt the indicator to different timeframes and trading strategies, enhancing its effectiveness and versatility.
Envelope Bounds and Estimation:
The Nadaraya-Watson Envelope Indicator calculates upper and lower bounds based on the Average True Range (ATR) and specified factors. These envelope bounds act as dynamic support and resistance levels, providing traders with valuable reference points for potential price targets and stop-loss levels. Additionally, the indicator generates an estimation plot, visually representing the projected price movement, enabling traders to anticipate market trends and make well-informed trading decisions.
Visual Clarity with Plots and Fills:
Clear visualization is crucial for effective technical analysis. The Nadaraya-Watson Envelope Indicator offers plots and fills to enhance visual clarity and ease of interpretation. The upper and lower boundaries are plotted, along with the estimation line, allowing traders to quickly assess price trends and volatility. Fills between the boundaries provide a visual representation of different price regions, aiding in identifying potential trading opportunities and risk management.
Conclusion:
The Nadaraya-Watson Envelope Indicator is a powerful tool for traders seeking accurate and reliable insights into market trends and price movements. With its logarithmic scale, non-repainting nature, customizable parameters, and visual clarity, this indicator equips traders with a competitive edge in the financial markets. By harnessing the advantages offered by the Nadaraya-Watson Envelope Indicator, traders can navigate the complexities of trading with confidence and precision. Unlock the potential of this advanced indicator and elevate your trading strategy to new heights.
RAINBOW AVERAGES - INDICATOR - (AS) - 1/3
-INTRODUCTION:
This is the first of three scripts I intend to publish using rainbow indicators. This script serves as a groundwork for the other two. It is a RAINBOW MOVING AVERAGES indicator primarily designed for trend detection. The upcoming script will also be an indicator but with overlay=false (below the chart, not on it) and will utilize RAINBOW BANDS and RAINBOW OSCILLATOR. The third script will be a strategy combining all of them.
RAINBOW moving averages can be used in various ways, but this script is mainly intended for trend analysis. It is meant to be used with overlay=true, but if the user wishes, it can be viewed below the chart. To achieve this, you need to change the code from overlay=true to false and turn off the first switch that plots the rainbow on the chart (or simply move the indicator to a new pane below). By doing this, you will be able to see how all four conditions used to detect trends work on the chart. But let's not get ahead of ourselves.
-WHAT IS IT:
In its simplest form, this indicator uses 10 moving averages colored like a rainbow. The calculation is as follows:
MA0: This is the main moving average and can be defined with the type (SMA, EMA, RMA, WMA, SINE), length, and price source. However, the second moving average (MA1) is calculated using MA0 as its source, MA2 uses MA1 as the data source, and so on, until the last one, MA9. Hence, there are 10 moving averages. The first moving average is special as all the others derive from it. This indicator has many potential uses, such as entry/exit signals, volatility indication, and stop-loss placement, but for now, we will focus on trend detection.
-TREND DETECTION:
The indicator offers four different background color options based on the user's preference:
0-NONE: No background color is applied as no trend detection tools is being used (boring)
1-CHANGE: The background color is determined by summing the changes of all 10 moving averages (from two bars). If the sum is positive and not falling, the background color is GREEN. If the sum is negative and not rising, the background color is RED. From early testing, it works well for the beginning of a movement but not so much for a lasting trend.
2-RAINBW: The background color is green when all the moving averages are in ascending order, indicating a bullish trend. It is red when all the moving averages are in descending order, indicating a bearish trend. For example, if MA1>MA2>MA3>MA4..., the background color is green. If MA1 threshold, and red indicates width < -threshold.
4-DIRECT: The background color is determined by counting the number of moving averages that are either above or below the input source. If the specified number of moving averages is above the source, the background color is green. If the specified number of moving averages is below the source, the background color is red. If all ten MAs are below the price source, the indicator will show 10, and if all ten MAs are above, it will show -10. The specific value will be set later in the settings (same for 3-TSHOLD variant). This method works well for lasting trends.
Note: If the indicator is turned into a below-chart version, all four color options can be seen as separate indicators.
-PARAMETERS - SETTINGS:
The first line is an on/off switch to plot the skittles indicator (and some info in the tooltip). The second line has already been discussed, which is the background color and the selection of the source (only used for MA0!).
The line "MA1: TYP/LEN" is where we define the parameters of MA0 (important). We choose from the types of moving averages (SMA, EMA, RMA, WMA, SINE) and set the length.
Important Note: It says MA1, but it should be MA0!.
The next line defines whether we want to smooth MA1 (which is actually MA0) and the period for smoothing. When smoothing is turned on, MA0 will be smoothed using a 3-pole super smoother. It's worth noting that although this only applies to MA0, as the other MAs are derived from it, they will also be smoothed.
In the line below, we define the type and length of MAs for MA2 (and other MAs except MA0). The same type and length are used for MA1 to MA9. It's important to remember that these values should be smaller. For example, if we set 55, it means that MA1 is the average of 55 periods of MA0, MA2 will be 55 periods of MA1, and so on. I encourage trying different combinations of MA types as it can be easily adjusted for ur type of trading. RMA looks quirky.
Moving on to the last line, we define some inputs for the background color:
TSH: The threshold value when using 3-TSHOLD-BGC. It's a good idea to change the chart to a pane below for easier adjustment. The default values are based on EURUSD-5M.
BG_DIR: The value that must be crossed or equal to the MA score if using 4-DIRECT-BGC. There are 10 MAs, so the maximum value is also 10. For example, if you set it to 9, it means that at least 9 MAs must be below/above the price for the script to detect a trend. Higher values are recommended as most of the time, this indicator oscillates either around the maximum or minimum value.
-SUMMARY OF SETTINGS:
L1 - PLOT MAs and general info tooltip
L2 - Select the source for MA0 and type of trend detection.
L3 - Set the type and length of MA0 (important).
L4 - Turn smoothing on/off for MA0 and set the period for super smoothing.
L5 - Set the type and length for the rest of the MAs.
L6 - Set values if using 4-DIRECT or 3-TSHOLD for the trend detection.
-OTHERS:
To see trend indicators, you need to turn off the plotting of MAs (first line), and then choose the variant you want for the background color. This will plot it on the chart below.
Keep in mind that M1 int settings stands for MA0 and MA2 for all of the 9 MAs left.
Yes, it may seem more complicated than it actually is. In a nutshell, these are 10 MAs, and each one after MA0 uses the previous one as its source. Plus few conditions for range detection. rest is mainly plots and colors.
There are tooltips to help you with the parameters.
I hope this will be useful to someone. If you have any ideas, feedback, or spot errors in the code, LET ME KNOW.
Stay tuned for the remaining two scripts using skittles indicators and check out my other scripts.
-ALSO:
I'm always looking for ideas for interesting indicators and strategies that I could code, so if you don't know Pinescript, just message me, and I would be glad to write your own indicator/strategy for free, obviously.
-----May the force of the market be with you, and until we meet again,

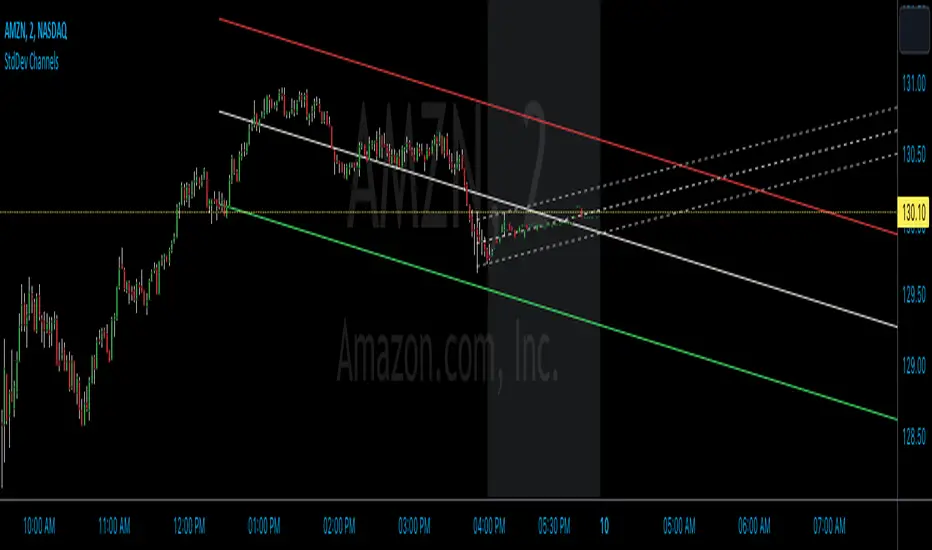
StdDev ChannelsThis script draws two sets of standard deviation channels on the price chart, providing a nuanced view of price volatility over different lengths.
The script starts by declaring a set of user-defined inputs allowing traders to customize the tool according to their individual requirements. The price input sets the source of the price data, defaulting to the closing price but customizable to use open, high, or low prices. The deviations parameter defines the width of the channels, with larger numbers resulting in wider channels. The length and length2 inputs represent the number of periods (in bars) that the script considers when calculating the regression line and standard deviation. Traders can also personalize the visual aspects of the indicator on the chart using the color, linewidth, and linestyle parameters.
Calculation of Standard Deviation:
The core of this script lies in calculating the regression line and standard deviation. This is where the InertiaAll function comes into play. This function calculates the linear regression line, which serves as the middle line of each channel. The function takes in two parameters: y (price data) and n (length for calculation). It returns an array containing the values for the regression line (InertiaTS), counter variable (x), slope of the line (a), and y-intercept (b). The standard deviation is then calculated using the built-in function ta.stdev, which measures the amount of variation or dispersion from the average.
After the calculation, the script proceeds to draw the channels. It creates two sets of lines (upper, middle, and lower) for each channel. These lines are initialized at the lowest price point on the chart (low). The coordinates for these lines get updated in the last section of the script, which runs only on the last bar on the chart (if barstate.islast). The functions line.set_xy1 and line.set_xy2 are used to adjust the starting and ending points for each line, forming the channels.
If the "full range" toggle is enabled, the script uses the maximum number of bars available on the chart to calculate the regression and standard deviation. This can give a broader perspective of the price's volatility over the entire available data range.
A Basic Strategy
The channels generated by this script may inform your trading decisions. If the price hits the upper line of a channel, it could suggest an 'overbought' condition indicating a potential selling opportunity. Conversely, if the price hits the lower line, it might signal an 'oversold' condition, suggesting a buying opportunity. The second channel, calculated over a different length, may serve to confirm these signals or identify longer-term trends.
Trend Channels With Liquidity Breaks [ChartPrime]Trend Channels
This simple trading indicator is designed to quickly identify and visualize support and resistance channels in any market. The primary purpose of the Trend Channels with Liquidity Breaks indicator is to recognize and visualize the dominant trend in a more intuitive and user-friendly manner.
Main Features
Automatically identifies and plots channels based on pivot highs and lows
Option to extend the channel lines
Display breaks of the channels where liquidity is deemed high
Inclusion of volume data within the channel bands (optional)
Market-friendly and customizable colors and settings for easy visual identification
Settings
Length: Adjust the length and lookback of the channels
Show Last Channel: Only shows the last channel
Volume BG: Shade the zones according to the volume detected
How to Interpret
Trend Channels with Liquidity Breaks indicator uses a combination of pivot highs and pivot lows to create support and resistance zones, helping traders to identify potential breakouts, reversals or continuations of a trend.
These support and resistance zones are visualized as upper and lower channel lines, with a dashed center line representing the midpoint of the channel. The indicator also allows you to see the volume data within the channel bands if you choose to enable this functionality. High volume zones can potentially signal strong buying or selling pressure, which may lead to potential breakouts or trend confirmations.
To make the channels more market-friendly and visually appealing, Trend Channels indicator also offers customizable colors for upper and lower lines, as well as the possibility to extend the line lengths for further analysis.
The indicator displays breaks of key levels in the market with higher volume.

Recursive Reversal Chart Patterns [Trendoscope]Caution: This algorithm is very heavy and bound to cause timeouts. If that happens, there are few settings you can change to reduce the load. (Will explain them in the description below)
🎲 Recursive Reversal Chart Patterns Indicator
Welcome to another exploration of Zigzag and Pattern ecosystem components. Previously we derived Pitchfork and Recursive Zigzag indicators. This indicator is designed to scan and highlight few popular "Reversal Chart Patterns". Similar to other indicators in the ecosystem, this too is built on recursive zigzags.
Double Taps
Triple Taps
Cup and Handles
Head and Shoulders
Indicator however names the patterns separately for bullish and bearish formations. So, the actual names you see on the screen are
Double Top
Double Bottom
Triple Top
Triple Bottom
Cup and Handle
Inverted Cup and Handle
Head and Shoulders
Inverse Head and Shoulders
Here is a snapshot on how each category of patterns look on the chart.
🎲 Architecture
Many of you may be cursing me for publishing too many libraries. But, these are all preparations for something big. Like other indicators in the Zigzag and Patterns Ecosystem, this too uses a bunch of libraries.
🎯Major direct dependencies
ZigzagTypes
ZigzagMethods
ReversalChartPatternLibrary
🎯Indirect dependencies
DrawingTypes
DrawingMethods
🎯Minor dependencies
Utils
TradeTracker
🎲 Indicator Settings
🎯Generic and Zigzag Settings.
Note: In case of timeout, please decrease the value of depth parameter
🎯Pattern Selection
Having all the patterns selected on chart may also cause timeouts and will make the chart look messy. It is better to limit one or two patterns on the chart to have clear picture.
🎯Scanner Settings
🎯Indicators.
These are options to use indicators as secondary confirmation to calculate divergence. If selected, the patterns are shown only if the divergence data is inline. Option also available to plugin external indicator. These calculations are not straightforward and not easy to measure by manual inspection. This feature at present is purely experimental.
Have a go and let me know how you feel :)

Pro Trading Art - Double Top & Bottom with alertThis indicator is based on ta.pivothigh and ta.pivotlow function. And with the help of different ph and pl I am detecting double top and double bottom.
Features
1. All signal are on realtime means no repaint
2. Able to detect precise double top & bottom
Input Field
Pivot Length : Default 10 => Use to detect pivot point

V Bottom & V Top Pattern [Misu]█ This indicator shows V bottom & V top patterns as well as potential V bottom & V top.
These V bottom & V top are chart powerful reversal patterns.
They appear in all markets and time-frames, but due to the nature of the aggressive moves that take place when a market reverses direction, it can be difficult to identify this pattern in real-time.
To address this problem, I added potential V pattern as well as the confirmed one.
█ Usages:
You can use V top & V bottoms for reversal zones.
You can use it for scalping strategies, as a main buy & sell signal.
Potential V patterns can be used to anticipate the market, in addition to volatility or momentum indicators, for example.
█ How it works?
This indicator uses pivot points to determine potential V patterns and confirm them.
Paramaters are available to filter breakouts of varying strengths.
Patterns also have a "max number bars" to be validated.
█ Why a Strategy type indicator?
Due to the many different parameters, this indicator is a strategy type.
This way you can overview the best settings depending on your pair & timeframe.
Parameters are available to filter.
█ Parameters:
Deviation: Parameter used to calculate parameters.
Depth: Parameter used to calculate parameters.
Confirmation Type: Type of signal used to confirme the pattern.
> Mid Pivot: pattern will confirm on mid pivot breakout.
> Opposit Pivot: pattern will confirm on opposit pivot breakout.
> No confirmation: no confirmation.
Lenght Avg Body: Lenght used to calculate the average body size.
First Breakout Factor: This factor multiplied by the "body avg" filters out the non-significant breakout of potential V pattern.
Confirmation Breakout Factor: This factor multiplied by the "body avg" filters out the non-significant breakout for the confirmation.
Max Bars Confirmation: The maximum number of bars needed to validate the pattern.

Hodrick-Prescott Channel [Loxx]Hodrick-Prescott Channel is a fast and slow moving average that moves inside a channel. Breakouts are when the fast ma crosses up over the slow ma and breakdowns are the opposite. The white moving average is the fast ma, the slow moving average is the red/green ma.
What is Hodrick–Prescott filter?
The Hodrick–Prescott filter (also known as Hodrick–Prescott decomposition) is a mathematical tool used in macroeconomics, especially in real business cycle theory, to remove the cyclical component of a time series from raw data. It is used to obtain a smoothed-curve representation of a time series, one that is more sensitive to long-term than to short-term fluctuations. The adjustment of the sensitivity of the trend to short-term fluctuations is achieved by modifying a multiplier Lambda.
The filter was popularized in the field of economics in the 1990s by economists Robert J. Hodrick and Nobel Memorial Prize winner Edward C. Prescott, though it was first proposed much earlier by E. T. Whittaker in 1923.
There are some drawbacks to use the HP filter than you can read here: en.wikipedia.org
Included
Bar coloring
Signals
Alerts

Adaptive ATR Keltner Channels [Loxx]Adaptive ATR Channels are adaptive Keltner channels. ATR is calculated using a rolling signal-to-noise ratio making this indicator flex more to changes in price volatility than the fixed Keltner Channels.
What is Average True Range (ATR)?
The average true range (ATR) is a technical analysis indicator, introduced by market technician J. Welles Wilder Jr. in his book New Concepts in Technical Trading Systems, that measures market volatility by decomposing the entire range of an asset price for that period.1
The true range is taken as the greatest of the following: current high less the current low; the absolute value of the current high less the previous close; and the absolute value of the current low less the previous close. The ATR is then a moving average, generally using 14 days, of the true ranges.
What are Keltner Channel (ATR)?
Keltner Channels are volatility-based bands that are placed on either side of an asset's price and can aid in determining the direction of a trend.
The Keltner channel uses the average-true range (ATR) or volatility, with breaks above or below the top and bottom barriers signaling a continuation.

Daily Scalping Moving AveragesThis is a technical analysis study based on the most fit leading indicators for short timeframes like EMA and SMA.
At the same time we have daily channel made from the last 2 weeks of ATR values, which will give us the daily top and bottom expected values(with 80%+ confidence)
We have 3 groups of lengths for short length, medium length and a bigger length.
At the same time we combine it with the daily vwap values .
In the end we are going to have a total of 7 indicators telling us the direction.
The way we can use it :
The max ratings that we can have are +7 for long and -7 for short
In general once we have at least 5 indicators(fast and medium ones) giving us a direction, there is a high chance that we can scalp that trend and then we can exit either when we will be at +7 or close to neutral point
At the same time is very important to be aware of the current position inside of the TOP/BOTTOM channel that we have.
For example lets assume we are at 40k on BTC and our top channel is around 41-42k while the bottom is around 38k. In this case the margin that we have for long is much smaller than for short, so we should be prepared to exit once we reach the top values and from there wait and see if there is a huge continuation or a reversal. If the top channel was hit and the market started the rebounce going downwards and the moving averages confirms it, then we have a huge advantage using the top points as a STOP LOSS and continue the short movements, giving us an amazing risk/reward ratio .
If you have any questions let me know !

Smarter MACD BandThe Smarter MACD displayed as a band instead of an oscillator. A classic MACD with average peak and dip lines. The lighter green and red horizontal lines are the average peak and dip of the entire span, respectively. The second, bolder of the two lines are the averages of the peaks and dips above and below the overall peak and dip averages. The filled in color is to help visualize these averages and possible trade setups.

Pivot Trend LevelsYou can use this indicator to detect the levels and trend.
I used the highest of the two last highest pivots and the lowest of the two last lowest pivots to calculate "max" and "min" or high level or low level.
I also calculate the average of the 4 values to reach the average line which could be a trend detector in higher lengths.
Default length is 3 but using 10 or 20 as length is really good as trending detector.
I need help to upgrade a trend detector system. please read the script for more information.
Thank you so much.

Volatility ChannelThis script is based on an idea I have had for bands that react better to crypto volatility. It calculates a Donchian Channel, SMMA-Smoothed True Range, Bollinger Bands (standard deviation), and a Keltner Channel (average true range) and averages the components to construct its bands/envelopes. This way, hopefully band touches are a more reliable indicator of a temporary bottom, and so on. Secondary coloring for strength of trend is given as a gradient based on RSI.

[_ParkF]RSI (+ichimoku cloud)RSI
Typical RSI indicators were plotted with candles and expressed wick to resemble a candle chart,
and linear regression was added to predict changes in force intensity,
which allowed us to confirm support and resistance within linear regression .
In addition, divergence signal was marked as an additional basis for the price fluctuation point due to support and resistance .
In other words,
if the diversity signal appears together when the rsi candle is supported and resisted within linear regression ,
this is the basis for predicting that it is a point of change in the existing trend.
Finally, the period value and standard deviation of linear regression can be arbitrarily modified and used.
I hope it will help you with your trading.
--------------------------------------------------------------------------------------------------------------------------------------------------------------
(+ichimoku cloud)
Clouds made of the preceding span 1 and the preceding span 2 of the balance table can predict the trend by displaying the current price balance ahead of the future.
In addition to the role of clouds in the above-described balance sheet, this indicator also shows the cloud band support and resistance of the current RSI value.
일반적인 RSI 지표를 캔들화 하였고 꼬리까지 포함하여 캔들 차트와 유사하게 표현 하고,
캔들화한 RSI 지표에 선형회귀(채널)를 추가 하여 RSI 지표 특유의 힘의 강도의 변화를 지지와 저항으로 확인할 수 있게 해봤습니다.
또한 다이버전스 신호를 추가하여 선형회귀(채널)로 인한 지지와 저항에 따른 가격 변동의 근거로 삼을 수 있습니다.
즉, 선형회귀(채널) 안에서 RSI 캔들이 지지와 저항을 받을 때 다이버전스 신호가 함께 나타난다면 이는 기존 추세의 변화 지점임을
예측해 볼 수 있는 근거가 됩니다.
마지막으로 선형회귀(채널)의 기간값과 표준편차는 임의로 수정하여 사용할 수 있습니다.
당신의 트레이딩에 도움이 되었으면 합니다.
--------------------------------------------------------------------------------------------------------------------------------------------------------------
(+일목균형표의 구름)
일목균형표의 선행스팬1과 선행스팬2로 만들어진 구름은 현재 가격의 균형을 미래에 선행하여 표시하여 추세를 예측해볼 수 있습니다.
본 지표에서는 위에서 설명한 일목균형표의 구름의 역할과 더불어 현 RSI 값의 구름대 지지, 저항 또한 확인해볼 수 있습니다.
* I would like to express my gratitude to zdmre for revealing the linear regression source.

BBands ChannelsBased on the Bollinger Bands system. This shows outer channels to the bollinger bands .

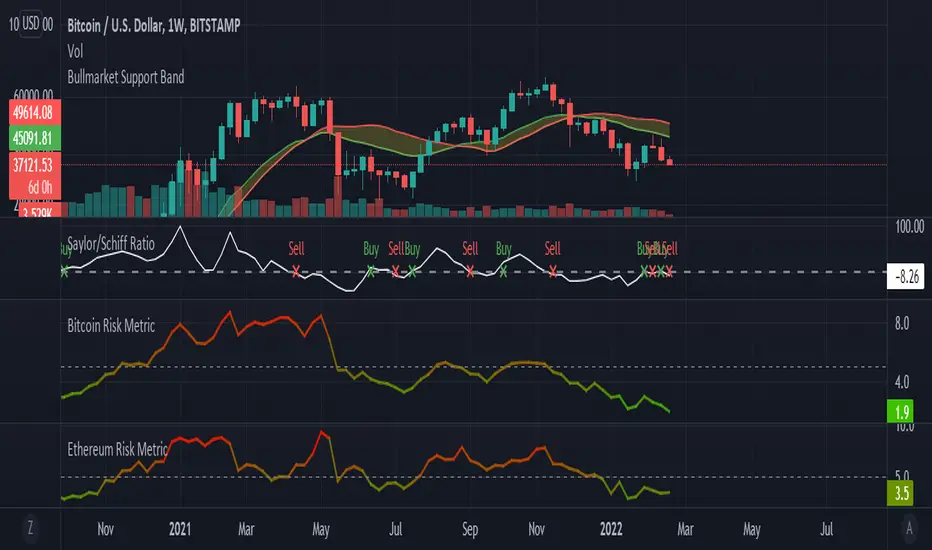
Saylor to Schiff RatioI'm reposting the Saylor to Schiff Ratio indicator that was originally developed by Michael Silva
This indicator may be used to predict key momentum shifts in the price of Bitcoin
I've set up this indicator for it to be used on the weekly timeframe as was intended.
The indicator plots in any BTCUSD spot, futures , BLX index and BTCEUR .
It paints in all time frames, but Weekly time frame is the correct one to interpret the 'official' read of it.
For that reason, I've enabled by default an option that forces the indicator to display on the Weekly value even though the time frame could be higher or lower.
Credit for this idea goes to Michael Silva: @mikepsilva
[TTI] ATR channelsHISTORY AND CREDITS
Used by John Carter in his indicator’s toolbox. The ATR channels or the Keltner Channels represent the railroads or the natural movement of stocks.
WHAT IT DOES
Movements between the the The first multiplier lines (white) represent standard movement for the timeframe you are trading. Movements between the second multiplier (green/red lines) represent a 2stdv move of the stock in a single direction. Once a stock starts reaching the 3rd multiplier lines there’s an exponential chance that it will revert to the mean (cyan line)
Additionally, we have added the Institutional lines. These are thought in a Small Account Mastery class 2019 by John Carter, as the levels heavily watched by institutions. The default settings represent what John is teaching but they can be further customised.
HOW TO USE IT
ATRs channels or Keltner Channels can be great source for target or stop losses and can be used as a indicator for confluence with other technical tools like the Fibonacci lines.

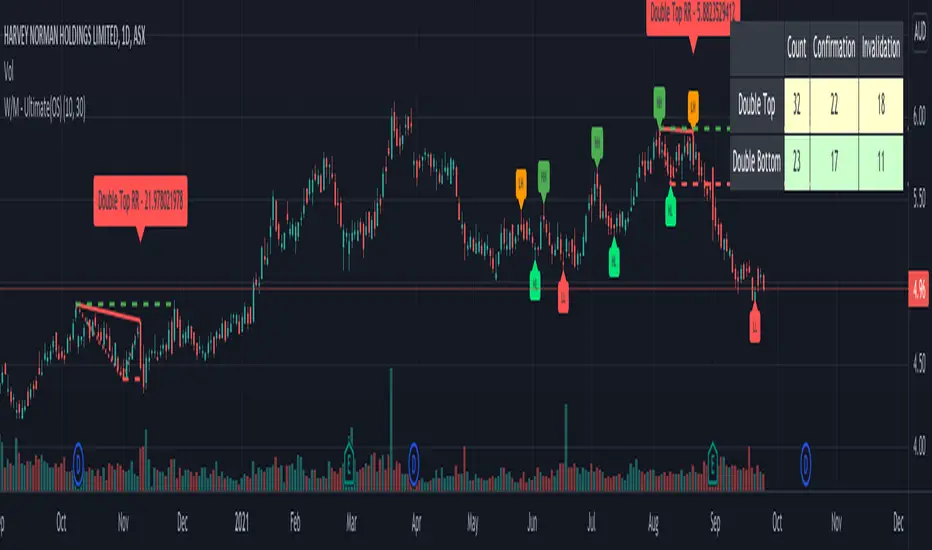
Double Top/Bottom - Ultimate (OS)This is zigzag based double top/bottom indicator. Code is same as : Double-Top-Bottom-Ultimate
But, republishing it to make it available open source.
Double Top:
Recognition - Checks on Zigzag if LH is followed by HH
Confirmation - When low crosses under last lower pivot point on zigzag
Invalidation - When high crosses over HH
Double Bottom:
Recognition - Checks on Zigzag if HL is followed by LL
Confirmation - When high crosses over last higher pivot point on zigzag
Invalidation - When low crosses under LL
Few input options:
Option to display risk per reward which defines how steep is the W-M triangle. This is simply the ratio of price difference between mid point to top most and bottom most points. In case of double top , downside is considered as reward and upside is considered as risk and with double bottom , downside is considered as risk and upside is considered as reward. Lower risk per reward signifies better trade.
Option to display stats which shows number of occurances of double top and bottom and how many times price crossed confirmation point and invalidation point (which are also marked with dashed lines) Stats are color coded. Higher confirmation rates are colored in shades of green, lower confirmation rates are colored in shades of orange whereas the neutral confirmation rates are coloed in light yellow.
Auto Harmonic Patterns - Open SourceI may not be able to spend much time on the harmonic patterns and realized that there are not much open source scripts on them either. Hence, decided to release open source version which can be used by other developers for reference and build things on top of it.
Original script is protected and can be found here:
Logical ratios of patterns are coded as below:
Notations:
Lines XABCD forms the pattern in all cases. (OXABCD in case of Three drives )
abc = BC retacement of AB, xab = AB retracement of XA and so on
ABCD Classic
0.618 <= abc <= 0.786
1.272 <= bcd <= 1.618
AB=CD
Price difference between AB and CD are equal
Time difference between AB and CD are equal
ABCD Extension
0.618 <= abc <= 0.786
1.272 <= AD/ BC (price) <= 1.618
Gartley
xab = 0.618
0.382 <= abc <= 0.886
1.272 <= bcd <= 1.618 OR xad = 0.786
Crab
0.382 <= xab <= 0.618
0.382 <= abc <= 0.886
2.24 <= bcd <= 3.618 OR xad = 1.618
Deep Crab
xab = 0.886
0.382 <= abc <= 0.886
2.0 <= bcd <= 3.618 OR xad = 1.618
Bat
0.382 <= xab <= 0.50
0.382 <= abc <= 0.886
1.618 <= bcd <= 2.618 OR xad = 0.886
Butterfly
xab = 0.786
0.382 <= abc <= 0.886
1.618 <= bcd <= 2.618 OR 1.272 <= xad <= 2.618
Shark
xab = 0.786
1.13 <= abc <= 1.618
1.618 <= bcd <= 2.24 OR 0.886 <= xad <= 1.13
Cypher
0.382 <= xab <= 0.618
1.13 <= abc <= 1.414
1.272 <= bcd <= 2.0 OR xad = 0.786
Three Drives
oxa = 0.618
1.27 <= xab <= 1.618
abc = 0.618
1.27 <= bcd <= 1.618
5-0
1.13 <= xab <= 1.618
1.618 <= abc <= 2.24
bcd = 0.5
This script contains everything which original script has apart from stats. Use the original script if you are not developer looking for code reference and prefer having stats table.
I have also developed a strategy based on harmonic patterns which can be found here:

Double Top/BottomHere is an attempt to identify double top/bottom based on pivot high/lows.
Logic is simple.
Double Bottom:
Last two pivot High Lows make W shape
Last Pivot Low is higher than previous Last Pivot Low.
Last Pivot High is lower than previous last Pivot High.
Price has not gone below Last Pivot Low
Price breaks out of last Pivot High to complete W shape
Double Top:
Last two pivot High Lows make M shape
Last Pivot Low is higher than previous Last Pivot Low.
Last Pivot High is lower than previous last Pivot High.
Price has not gone above Last Pivot High
Price breaks out of last Pivot Low to complete M shape
Prameters:
Parameters PvtLenL , PvtLenR and waitforclose determines pivot points.
FilterPivots clears repetitive pivots formed in same direction before calculating the possible double top/bottom.
For example:
CheckForAbsolutePeaks and AbsolutePeakLoopback works together. When CheckForAbsolutePeaks is enabled, script only generates double bottom or top signal if previous last pivot is absolute high or low for AbsolutePeakLoopback periods.
ConsiderMovingAverage does two things. First, it makes sure that fast moving average and slow moving averages are aligned with the direction we are going to forecast. Second, it makes sure that the crossover happend recently and with last BarCrossoverLimit bars. For example, to call it double bottom, Fast MA should be higher than Slow MA and crossover of FastMA above SlowMA should have happened in last 10 bars (BarCrossoverLimit)
PivotDisplayMode can be Actual, Filtered or None. Actual will display all pivot high low generated. Filtered will only display last 5 pivot high and pivot lows which are filtered . That means, it will remove the repetitive pivots formed without making pivots on the other side.
Welcome and suggestions and feedbacks.

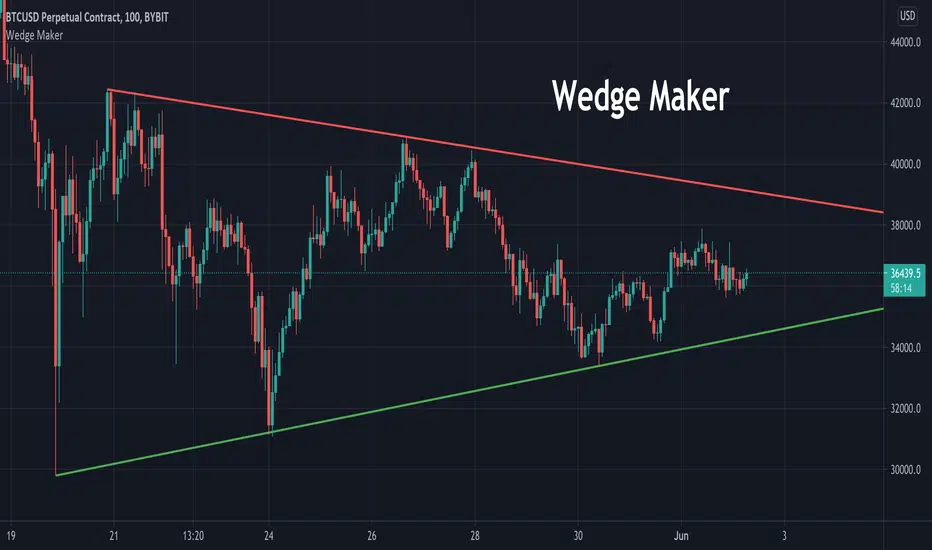
Wedge MakerThis tool is used to draw wedges. Traders can choose which pivot points to draw lines from in settings. Wedge Maker does not automatically detect current wedge and is required to be tweaked in settings.
Auto PitchFan, Fib Extension/Retracement and ZigZag by DGT Aᴜᴛᴏ PɪᴛᴄʜFᴀɴ, Fɪʙ Exᴛᴇɴꜱɪᴏɴ/Rᴇᴛʀᴀᴄᴇᴍᴇɴᴛ ᴀɴᴅ ZɪɢZᴀɢ
This study aim to automate PitchFan drawing tool and combines it with Fibonacci Extentions/Retracements and ZigZag.
Common setting options, applied to all components of the study
Deviation , is a multiplier that affects how much the price should deviate from the previous pivot in order for the bar to become a new pivot. Increasing its value is one way to get higher timeframe Levels
Depth , affects the minimum number of bars that will be taken into account when building
Historical PitchFan / Fibonacci Levels option will allow plotting of PitchFan / Fibonacci Levels on previous Pivot Highs/Lows
█ PɪᴛᴄʜFᴀɴ — is a set of rays spreading out of the point of a trend's beginning. These rays inclined with the coefficients formed by a Fibonacci number sequence. It is recommended to adjust the Pitchfan plottings to fit after the first wave of the trend has passed and the correction has clearly begun.
PitchFan rays corresponding to Fibonacci levels appear on a chart and represent inclined lines of support and resistance. Price areas near these rays are estimated areas from which the price can turn around or make a significant rebound. The whole logic of working with a pitchfan is based on one simple idea - if the price has bounced off the level, then the correction is likely to end, and the trend will continue. If the price has broken the first resistance, you should wait for the next level test
- Automatically plots PitchFan Rays, based on Pivot Lows/Highs.
- Ability to set ALERTs for each PitchFan Ray Level
- PitchFan Labels displays the price of the line at the last bar, the price value will be recalculated in each new bar
Please check the link provided below with the educational post of how to apply pitchfork, application of pitchfan is same keeping in mind the recommendation stated above
█ Fɪʙ Rᴇᴛʀᴀᴄᴇᴍᴇɴᴛs / Exᴛᴇɴꜱɪᴏɴꜱ
Fibonacci retracements is a popular instrument used by technical analysts to determine support and resistance areas. In technical analysis, this tool is created by taking two extreme points (usually a peak and a trough) on the chart and dividing the vertical distance by the key Fibonacci coefficients equal to 23.6%, 38.2%, 50%, 61.8%, and 100%.
Fibonacci extensions are a tool that traders can use to establish profit targets or estimate how far a price may travel AFTER a retracement/pullback is finished. Extension levels are also possible areas where the price may reverse.
IMPORTANT NOTE: Fibonacci extensions option may require to do further adjustment of the study parameters for proper usage. Extensions are aimed to be used when a trend is present and they aim to measure how far a price may travel AFTER a retracement/pullback. I will strongly suggest users of this study to check the education post for further details where to use extensions and where to use retracements
- Automatically plots possible Support and Resistance levels, based on Pivot Lows/Highs.
- Ability to set ALERTs for each Fibonacci Extension/Retracement Level
- Labels displays the level and the level price
█ Zɪɢ Zᴀɢ — The Zig Zag indicator is used to help identify price trends and changes in price trends. The Zig Zag indicator plots points on a chart whenever prices reverse by a percentage greater than a Deviation variable. Straight lines are then drawn, connecting these points. The Zig Zag indicator serves base for PitchFan and Fibonacci Retracements / Extensions
█ OTHER
PitchFan is often used in combination with the other indicators and/or drawing tools such as Fibonacci Retracement, Fibonacci Channels, Fibonacci Time Zone and others. It allows identify the most powerful areas from which price can turn and to get more accurate trading signal
Andrews’ Pitchfork, how to apply pitchfork and automated pitchfork study
Fibonacci Fans, how to apply fibonacci fans and automated fibonacci speed and resistance fans study
Fibonacci Extension / Retracement, where to use extensions and where to use retracements and automated fibonacci extension / retracement / pivot points study
Others
Fibonacci Channels, how to apply fibonacci channels and automated fibonacci channels study
Linear Regression Channels, , what linear regression channels are? and linear regression channel/curve/slope study
Disclaimer :
Trading success is all about following your trading strategy and the indicators should fit within your trading strategy, and not to be traded upon solely
The script is for informational and educational purposes only. Use of the script does not constitute professional and/or financial advice. You alone have the sole responsibility of evaluating the script output and risks associated with the use of the script. In exchange for using the script, you agree not to hold dgtrd TradingView user liable for any possible claim for damages arising from any decision you make based on use of the script
