Fibonacci Retracements & Trend Following Strategy V2This Pine Script strategy generates trading signals using Fibonacci levels and trend-following indicators.
1. Strategy Summary
This strategy analyzes price movements using a combination of Fibonacci levels and trend-following indicators, providing potential trading signals. The strategy includes Fibonacci levels as well as EMA (Exponential Moving Average) and ADX (Average Directional Index) indicators.
2. Indicators and Parameters
Fibonacci Levels
Fibonacci Level 1, Level 2, Level 3, Level 4: Used as Fibonacci retracement levels. These levels are typically set at 0.236, 0.382, 0.618, and 0.786. Users can adjust these values according to their preferences.
Trend-Following Indicator
Trend Length: The period for calculating the EMA used as the trend-following indicator. For example, if set to 20, the EMA will be calculated over 20 periods.
ADX (Average Directional Index)
ADX Length: The period for calculating the ADX. ADX measures the strength of the price trend and is usually set to 14 periods.
ADX Threshold: A threshold value for the ADX. This value determines when trading signals will be activated.
3. Usage Steps
Displaying the Indicator on the Chart:
On the TradingView platform, paste the code into the Pine Editor and click the "Add to Chart" button to add it to the chart.
Analyzing the Indicators:
Fibonacci Levels: Show retracement levels of price movements. When the price reaches one of these levels, potential reversals may occur.
Trend-Following Indicator: EMAs determine the direction of the trend. Green EMA represents an uptrend, while red EMA represents a downtrend.
ADX: Measures the strength of the trend. When ADX surpasses the threshold value, it indicates a strong trend.
Trading Signals:
Long Signal: Generated when the price is above the second Fibonacci level and the trend is upward. Additionally, the ADX value must be above the set threshold.
Short Signal: Generated when the price is below the second Fibonacci level and the trend is downward. Additionally, the ADX value must be above the set threshold.
Target Prices:
Long Targets: Determines upward targets based on Fibonacci levels. These targets indicate expected prices if the price reverses from Fibonacci levels.
Short Targets: Determines downward targets based on Fibonacci levels. These targets indicate expected prices if the price reverses from Fibonacci levels.
4. Chart Displays
Trend Up (Green Line): Shows the rising EMA.
Trend Down (Red Line): Shows the falling EMA.
Fibonacci Levels (Blue Lines): Shows Fibonacci retracement levels.
Long Targets (Green Circles): Shows targets for long positions.
Short Targets (Red Circles): Shows targets for short positions.
Long Signal (Green Label): Buy signal.
Short Signal (Red Label): Sell signal.
5. Important Notes
Retracement and Target Levels: Fibonacci levels can act as potential retracement or support/resistance levels. However, they should always be used in conjunction with other technical analysis tools.
Trend and ADX: ADX is used to determine the strength of the trend. Be aware that when ADX is low, trends may be weak.
6. Example Scenarios
Example 1: If the trend is upward (green EMA) and the price is above the second Fibonacci level, you may receive a long position signal. If the ADX value is above the threshold, the signal may be stronger.
Example 2: If the trend is downward (red EMA) and the price is below the second Fibonacci level, you may receive a short position signal. If the ADX value is above the threshold, the signal may be stronger.
This updated version contains significant improvements in both technical aspects and user experience. Innovations such as ADX calculations and dynamic Fibonacci levels make the strategy more robust and flexible. The code's readability and comprehensibility have been enhanced, and errors have been corrected.
This guide will help you understand the basic operation of the strategy. It is always recommended to conduct your own research and test the strategy before using it.
GOOD LUCK. // halilvarol
Chartanalysis

Comparative Relative Strength - HongQuanTraderThis script is designed to enhance your trading strategy by comparing the current symbol with another comparative symbol. The goal is to trade a symbol only when its Relative Strength (RS) value surpasses the long moving average of the RS value, ensuring more informed and strategic trading decisions.
Default Mode
In the default mode, the RS value is calculated by simply dividing the base symbol by the comparative symbol:
RS_SIMPLE = baseSymbol / comparativeSymbol
Period Mode
When you enable the “use period” option, the script uses the RS_PERIOD equation. This mode is particularly useful for comparing multiple symbols against the same comparative symbol, with the output normalized around 1.0 for easier comparison:
RS_PERIOD = baseSymbol / baseSymbol / (comparativeSymbol / comparativeSymbol )
By leveraging these calculations, you can gain deeper insights into the relative performance of different symbols, allowing you to make more precise and confident trading decisions. Whether you’re comparing stocks, currencies, or any other assets, this script provides a robust framework for enhancing your trading strategy.

Advanced Fully Reversed Candles with Reversed IchimokuThe "Advanced Fully Reversed Candles with Reversed Ichimoku" indicator is a sophisticated tool designed for traders who seek a unique perspective on market dynamics. This innovative indicator not only reverses the traditional candlestick chart but also inverts the Ichimoku Cloud components, providing a comprehensive view of the market's inverted behavior.
Key Features:
Reversed Candlestick Chart:
The indicator recalculates the OHLC (Open, High, Low, Close) prices by reversing them along the price axis. This means that what typically would be an upward movement is displayed as a downward movement, and vice versa. This reversal provides an alternative view that can help traders identify hidden patterns and potential reversal points that might not be obvious on a standard chart.
Reversed Ichimoku Cloud:
All components of the Ichimoku Cloud indicator are recalculated based on the reversed price data. This includes:
Tenkan-sen (Conversion Line): Reversed based on the highest and lowest prices over the specified period.
Kijun-sen (Base Line): Reversed in a similar manner to the Tenkan-sen, providing a medium-term perspective on price trends.
Senkou Span A (Leading Span A): Reversed to form one boundary of the Kumo (cloud), offering insight into future support and resistance levels.
Senkou Span B (Leading Span B): Reversed to form the other boundary of the Kumo, complementing Senkou Span A.
Chikou Span (Lagging Span): Reversed and plotted backward for additional confirmation of trend direction and strength.
Dynamic Price Range Calculation:
The indicator dynamically calculates the maximum and minimum prices over the last 500 bars (or the available range if fewer bars are present). This ensures that the reversal is always based on the most relevant data, providing accurate and up-to-date visualizations.
Visual Enhancements:
The reversed candlesticks are color-coded for easy interpretation: green for upward movements and red for downward movements, based on the reversed data.
The Ichimoku Cloud is filled with semi-transparent colors to clearly distinguish between bullish and bearish conditions even in its reversed state.
Debugging Aids:
For transparency and accuracy, the indicator plots the maximum and minimum price lines used for the reversal calculations. This allows users to verify the internal workings of the indicator and ensure the reversal logic is correctly applied.
Usage:
This indicator is ideal for advanced traders and analysts who want to explore market behavior from an unconventional angle. By reversing both the candlestick chart and the Ichimoku Cloud, it provides a unique perspective that can uncover new trading opportunities and enhance market analysis.
Customization:
Users can customize the periods for the Tenkan-sen, Kijun-sen, and Senkou Span B, as well as the displacement for the Ichimoku Cloud. This flexibility allows traders to adapt the indicator to their specific trading strategies and timeframes.
Conclusion:
The "Advanced Fully Reversed Candles with Reversed Ichimoku" indicator is a powerful tool that transforms traditional market analysis. By inverting both price movements and key technical indicators, it opens up a new dimension of trading insights, helping traders to see the market in a completely different light.
Parameters:
Tenkan-sen period (default: 9)
Kijun-sen period (default: 26)
Senkou Span B period (default: 52)
Displacement (default: 26)
How to Apply:
Add the script to your TradingView account via the Pine Editor.
Customize the parameters according to your trading strategy.
Analyze the reversed candlestick chart and Ichimoku Cloud to gain unique insights into market trends and potential reversal points.

Wave LineWave Line is a chart type obtained by plotting the High and Low values in each time interval according to their sequential order. This method produces a continuous line rather than bars, which is beneficial for analyzing changes within each interval rather than focusing on the price range and open/close values. E.g for Wave Analysis.
How to use:
1. Adjust the interval unit and multiplier for the main timeframe.
2. Ideally, select a lower timeframe on your chart, approximately 5 times smaller than the one specified for the script.
3. Lower Timeframe is the timeframe which will be the scripts reference when the high and low of the main timeframe align on a single bar of the opened chart. This timeframe may also be 5-10 times smaller than the main timeframe. It is important to note that this should not be excessively smaller as the script may fail in retrieving data. An alternative method is included to estimate the order if it is not clear in the fetched data.
4. Set a preferred value for Monowave Length, indicating the number of bars a monowave will cover horizontally. Set the value to be half of the Interval Multiplier for the Wave Line to align with the bar chart. However if the multiplier is an odd number, perfect alignment may not be achieved.
5. Ensure that the product of Max Polyline Segments and Monowave length does not exceed 5000, and adjust the value for Max Polyline Segments accordingly.

Enhanced Candle Sticks [AlgoAlpha]🚀🌟 Introducing the Enhanced Candle Sticks by AlgoAlpha, a Pine Script tool designed to provide traders with an enhanced view of market dynamics through candlestick analysis. This script aims to visualise if price has hit the high or low of the candle first, aiding in back-testing, and to identify smaller trends using market structure.📊🔍
Key Features:
Timeframe Flexibility: Users can select their desired timeframe for analysis, offering a range of options from M15 to H12. This flexibility allows for detailed and specific timeframe analysis.
Micro Trend Identification: The script includes an option to enable 'MicroTrends', giving traders insights into smaller movements and trends within the larger market context.
Customizable Visuals: Traders can customize the colors of bullish and bearish candlesticks, enhancing visual clarity and personalizing the chart to their preferences.
State Tracking: The script tracks the 'state' of the market on lower timeframes to detect if the high or the low was formed first.
Warning System: When the selected timeframe does not match the chart timeframe, the script generates a warning, ensuring accurate analysis and preventing potential misinterpretations.
Usages:
Enhanced Back-testing: Users can now get a more accurate interpretation of the candlesticks by know if the high or the low came first (denoted with ⩚ or ⩛), especially in scenarios where the high and the low of the larger timeframe candle is touching both the take-profit and stop-loss levels.
Squeeze Analysis: Users can identify squeezes in price when the microtrend shows both an uptrend and a downtrend, possibly giving more insight into the market.
Lower Timeframe Market Structure Analysis: Microtrends form when the low of the candle is consecutively increasing and the high is consecutively falling, which means on a lower timeframe, price is forming higher lows or lower highs.
Basic Logic Explanation:
- The script starts by setting up the necessary parameters and importing the required library. Users can customize the timeframe, colors, and whether to enable micro trends and candlestick plotting.
- It then calculates the lower timeframe (1/12th of the current timeframe) for more detailed analysis. The `minutes` function helps in converting the selected timeframe into minutes.
- The script tracks new bars and calculates the highest and lowest values within an hour, using `ta.highestSince` and `ta.lowestSince`.
- It determines the market 'state' by checking if the current high is breaking the previous high and if the current low is breaking the previous low on lower timeframes to determine if the high or the low was formed first.
- The script uses the `plotchar` and `plotcandle` functions to visually represent these trends and states on the chart. This visual representation is key for quick and effective analysis.
Alerts:
Alerts can be set for microtrend formations:
This script is a valuable tool for traders looking to deepen their market analysis with enhanced candlestick visualization and micro trend tracking. 📈🔶💡

Volume Heatmap 2024 | NXT2017 Christmas EditionHi big players around the world,
I wish you a merry christmas time.
Today I have a nice present for you: a new volume heatmap indicator for free using!
HISTORY
My first volume heatmap project got a lot of feedback and a big demand. You can find it here:
In this time pinescript version 4 was the newest one and I worked the first time with arrays.
Today we have pinescript version 5 and some new features. This is why I tried again with matrix function and the results are better than I expected.
HOW IT WORKS
The indicator calculates similar like the volume profile. It looks back and every volume where the close price is on the same row area, the volume will cumulated. How much rows the new chart view is showing, you can choose manually.
The mind behind this is to find high volume levels, where high volume catch the price in a range or get function as support/resistance line.
PICTURES
I hope it helps for your trading. You are welcome to give some comments.
Merry christmas and best regards
NXT2017

Flat Combo DetectorFlat Combo Detector (FCD)
Introduction:
The Flat Combo Detector is a unique tool crafted to aid traders in identifying potential trend reversals. Unlike standard indicators that primarily focus on moving averages or oscillators, the FCD bases its signals on specific candlestick patterns that manifest at crucial trend pivot points.
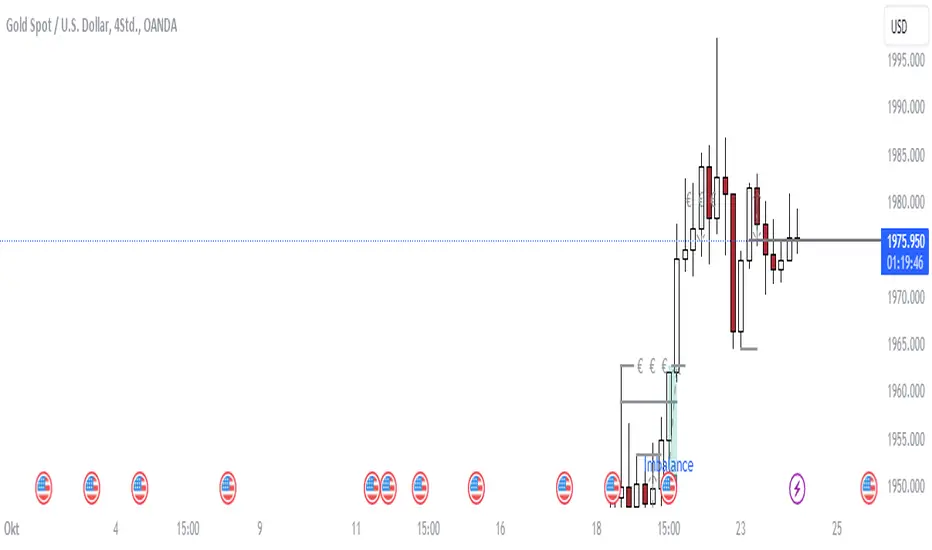
I use it mostly on OANDA:XAUUSD Gold
How It Works:
The logic of the Flat Combo Detector revolves around the formation of consecutive bearish and bullish candles with particular attributes:
Bearish to Bullish Transition:
Primary Candle : A bearish candle where the close is lower than the open and its close is equal to its low.
Following Candle: A bullish candle where the close is higher than the open, and the open approximates its low (within a user-defined tolerance).
Signal : A green triangle plotted below the price bar, indicating a potential shift from a bearish to bullish trend.
Bullish to Bearish Transition:
Primary Candle: A bullish candle where the close is higher than the open and equals its high.
Following Candle : A bearish candle where the close is lower than the open, and the open approximates its high (within a user-defined tolerance).
Signal : A red triangle plotted above the price bar, indicating a potential transition from a bullish to bearish trend.
Usage Guidance:
For traders unfamiliar with Pine Script, using this indicator is straightforward. Once added to the chart, look for the green and red triangle signals. A green triangle below a price bar suggests a possible bullish reversal, while a red triangle above a price bar hints at a potential bearish reversal. Always consider these signals in conjunction with other technical analysis tools and the broader market context to optimize decision-making.
Associated Strategy:
I've also developed a trading strategy that utilizes these specific entry points identified by the FCD. If you find the signals from this indicator helpful, you might also be interested in exploring the strategy for a comprehensive trading approach. Always remember to backtest and validate any strategy before live trading.
Chart Presentation:
The published chart associated with this script has been kept clean to ensure clarity. Users will only observe the main price bars/candles along with the green and red triangle signals generated by the FCD.
Conclusion:
The Flat Combo Detector provides traders with a fresh perspective on trend reversal points. Its focus on specific candlestick patterns makes it a valuable tool, especially when used in combination with other technical indicators. Always ensure to practice prudent risk management and consult multiple analysis methods before making trading decisions.
TrendLine CrossThis indicator "TrendLine Cross", is designed to plot trend lines so you can spot potential trend reversal points on the charts. The main function is to draw several lines on the chart and identify the crossings between these lines, which can be significant indicators for trading. The lines are based on different periods which can be changed in the settings tabs.
Let's see the characteristics of the trend lines:
_Low Line Color(Green Line): This line connects the lowest point of low prices in the "low_time" period with the lowest point of low prices in the "high_time" period. Indicates a possible short-term support level on the chart.
_Liquidity Up Line Color (Golden Line): This line connects the lowest point of low prices in the "low_time" period with the highest point of low prices in the same period. It represents a liquidity zone and an important resistance in the chart.
_Lower Line Color (Blue Line): This horizontal line connects the lowest point of low prices in the "LowerLine_period" with the lowest point of low prices in the "high_time" period. Indicates a possible long-term support level.
_Upper Line Colorr: This line represents a connection between the highest points of the "high_time" period and the lowest point of the "LowerLine_period". Indicates a possible long-term resistance level.
_Up Line Color (Red Line): This line connects the highest point of high prices in the "high_time" period with the highest point of high prices in the "LowerLine_period". It represents a possible long-term resistance level.
_Liquidity Down Line Color(Golden Line): This line connects the highest point of high prices in the "high_time" period with the highest point of low prices in the "low_time" period. It represents a liquidity point and an important support zone.
The indicator becomes particularly interesting when the lines make crossings. These crossovers could suggest a potential trend change in the market. For example:
Change from Bearish to Bullish: If the "long-term" line (black) crosses the "short- or long-term" line (green or blue) from top to bottom, it could indicate a shift from a bearish to a bullish market , suggesting the opportunity for long positions.
_Changing from Bullish to Bearish: If the "long-term" line (blue) crosses the "short-term" line (red or black) from bottom to top, it could indicate a shift from a bullish to a bearish market, suggesting the opportunity for short positions.
Generally speaking, crossings between these lines can be key points of interest for traders, as they can signal significant changes in price direction.

TrapZone ProThis script combines the concepts of Price Action, Trend and Momentum to identify Price Zones (Red and Green filled areas) and Price Bars (Red, Green and Gray) where traders can get trapped in the Market.
It will clearly mark the bars which favor the prevailing Trend and those bars which just don't have the momentum anymore. TrapZone moves with the market trend and will often provide it support. As the TrapZone changes direction & its color, traders can change their trade bias.
Features:
Identify strong & weak price action - By leveraging a regression calculation of price movement on Y axis against the x axis, we identify the strength of current bars. Increasing relative strength of bars indicate Bullish (Green Bars) & Bearish (Red Bars) price movement, respectively. As the relative strength starts to decrease in Bullish or Bearish price action, the indicator immediately changes the color of these bars to Gray (by default). We call these TrapBars .
Current price trend - By using the highs and lows of price in multiple periods, we are calculating the trend of the price. The Bullish trend is shown by the Green zone and Bearish trend is shown by the Red zone. These zones are the shaded areas which are plotted on the chart. If the price is in these Zones, Longs or Short trades are not advised as that price action is weak. We call these TrapZones .
Strength of the Momentum - the thickness of the TrapZone shows the strength of the current Bullish or Bearish trend. That means the wider the shaded area grows the stronger is the current market momentum. A Flat TrapZone indicates sideways price action.
Knowing when NOT to Trade is as important as when to Trade. While this indicator is designed to avoid taking bad trades such as FOMO, Catching a Falling Knife or Fighting The Trend , it successfully reveals the good trade setups!
How these features of this indicator helps Traders avoids common mistakes:
FOMO or Fear of Missing Out - If a Trader Sees TrapBars in a Bullish or Bearish Trend, they will avoid entry as the price action is weak at that time. This will avoid late entries.
Catching a Falling Knife (a.k.a. Picking a Bottom) - When Red TrapZone is being plotted, Traders can avoid taking Long Entries hoping for a price reversal.
Fighting The Trend (a.k.a Picking a Top) - When Green TrapZone is being plotted, Traders can avoid taking Short entries hoping for a price reversal.
TrapZone Pro does all this in a single panel of the chart irrespective of the market or timeframe.
How to use TrapZone Pro indicator for trading [
A. Market Analysis
Green TrapZone is Bullish and traders should not take Shorts. If Green TrapZone is moving higher, Market is Strong
Red TrapZone is Bearish and traders should not take Longs. If Red TrapZone is moving Lower, Market is Strong
No trades when TrapBars are forming
No trades inside the TrapZone
B. Trade Guidance System
Establish Market Bias - Bullish or Bearish using the TrapZone Color
Only Enter Long in Long Color Bars i.e. Green by default
Only Enter Short in Short Color Bars i.e. Red by default
3 Classes of Trades are Possible Class A, B & C. A being the best Reward : Risk ratio and C being the least rewarding. So use trade size accordingly.
Class A - Best bars are always the first & Second, close to the TrapZone
Class B - Long Bar or Short Bar Forming after TrapBar away from the TrapZone in a Strong Market
Class C - Long Bar or Short Bar Forming after TrapBar close to the TrapZone in a Flat Market (identified by Flat TrapZone )
Take profits when Price moves away from the TrapZone & TrapBars start forming OR Your Target is hit !
See a few examples of Trade Classes & Entries/ Exits for a better understanding
Recommendations
Select Session to “Electronic Trading Hours” in chart settings so you can see the Post & Pre Market trading as well. You can change the color of these sessions to the same color as chart background, so it is not distracting.
Start by Trading in the Hourly or Daily time frame to get used to the new indicator and its Trade Guidance System .
Position Size is the best form of Risk Management. Have a fixed dollar loss per trade pre-determined and adjust the size based on market volatility.
Even though this indicator is designed to work on any market or timeframe, trade the markets that you are familiar with and timeframe that matches your lifestyle. Your understanding of the instrument's behavior and knowledge of what makes it move is valuable.
Basic Set-Up
Add the Indicator to the chart
Open Chart Settings and in Symbol Section
Switch off “ Borders ”
Switch off “ Wick ” or Change the colors to a same non-distracting color like Black or Gray
Open TrapZone Pro Settings
Set the colors for the “ Long Bars ”, “ Short Bars ” & “ No Entry Bars ” if you wish to change the default colors
Change “ TrapZone ” colors to your Taste or leave the defaults
Green for “Color 0” that represents Bullish Price Action
Red for “Color 1” that represents Bearish Price Action
Important Advice & Disclaimer: This indicator does not guarantee that you will make money. It is a tool that performs market analysis for you and presents it in a easy to consume fashion. Markets are truly random and can change direction on a dime. You must use prudent risk and money management strategy based on your investor profile, investment objectives and risk appetite.
To Get Access - See Author’s instructions below

Candles In Row (Expo)█ Overview
The Candles In Row (Expo) indicator is a powerful tool designed to track and visualize sequences of consecutive candlesticks in a price chart. Whether you're looking to gauge momentum or determine the prevailing trend, this indicator offers versatile functionality tailored to the needs of active traders. The Candles In Row indicator can be an integral part of a multi-timeframe trading strategy, allowing traders to understand market momentum, and set trading bias. By recognizing the patterns and likelihood of future price movements, traders can make more informed decisions and align their trades with the overall market direction.
█ How to use
The indicator enhances traders' understanding of the consecutive candle patterns, helping them to uncover trends and momentum. Consecutive candles in the same direction may indicate a strong trend. The Candles In Row indicator can be an essential tool for traders employing a multiple timeframes strategy.
Analyzing a Higher Timeframe:
Understanding Momentum: By analyzing consecutive green or red candles in a higher timeframe, traders can identify the prevailing momentum in the market. A series of green candles would suggest an upward trend, while a series of red candles would indicate a downward trend.
Predicting Next Candle: The indicator's predictive feature calculates the likelihood of the next candle being green or red based on historical patterns. This probability helps traders gauge the potential continuation of the trend.
Setting the Trading Bias: If the likelihood of the next candle being green is high, the trader may decide to focus on long (buy) opportunities. Conversely, if the likelihood of the next candle being red is high, the trader may look for short (sell) opportunities.
In this example, we are using the Heikin Ashi candles.
Moving to a Lower Timeframe:
Finding Entry Points: Once the trading bias is set based on the higher timeframe analysis, traders can switch to a lower timeframe to look for entry points in the direction of the bias. For example, if the higher timeframe suggests a high likelihood of a green candle, traders may look for buy opportunities in the lower timeframe.
Combining Timeframes for a Comprehensive Strategy:
Confirmation and Alignment: By analyzing the higher timeframe and confirming the direction in the lower timeframe, traders can ensure that they are trading in alignment with the broader trend.
Avoiding False Signals: By using a higher timeframe to set the trading bias and a lower timeframe to find entries, traders can avoid false signals and whipsaws that might be present in a single timeframe analysis.
█ Settings
Price Input Selection: Choose between regular open and close prices or Heikin Ashi candles as the basis for calculation.
Data Window Control: Decide between displaying the full data window or only the active data. You can also enable a counter that keeps track of the number of candles.
Alert Configuration: Set the desired number and color of consecutive candles that must occur in a row to trigger an alert.
Table Display Customization: Customize the location and size of the display table according to your preferences.
-----------------
Disclaimer
The information contained in my Scripts/Indicators/Ideas/Algos/Systems does not constitute financial advice or a solicitation to buy or sell any securities of any type. I will not accept liability for any loss or damage, including without limitation any loss of profit, which may arise directly or indirectly from the use of or reliance on such information.
All investments involve risk, and the past performance of a security, industry, sector, market, financial product, trading strategy, backtest, or individual's trading does not guarantee future results or returns. Investors are fully responsible for any investment decisions they make. Such decisions should be based solely on an evaluation of their financial circumstances, investment objectives, risk tolerance, and liquidity needs.
My Scripts/Indicators/Ideas/Algos/Systems are only for educational purposes!

Lune Technical Analysis Premium⬛️ Overview
Lune Technical Analysis is a state-of-the-art TradingView indicator, meticulously designed to provide real-time market insights. Distinguished by its non-repainting features that operate in real-time, this tool brings enhanced accuracy and timeliness to your market analysis.
🟦 Features
Lune Technical Analysis equips traders with an array of innovative features:
🔹 Candle Coloring: The Candle Coloring feature introduces an innovative approach to visualizing market sentiment by coloring chart candles. It is devised to streamline your market analysis, offering a readily digestible snapshot of market trends. For example, if you aim to gauge the predominant market sentiment promptly, enable this feature for instant candle color-coding in accordance with prevailing bullish or bearish market structures. Though it currently supports only Market Structure-based Candle Coloring, its settings can be manipulated for enabling or disabling this feature. This feature operates by applying predefined algorithms that interpret market sentiment, coloring the candles accordingly.
🔹 Chart Pattern Detection: This sophisticated tool automatically detects and illustrates common chart patterns on your chart, simplifying the process of pattern identification. It identifies a range of patterns such as Head & Shoulders, Inverted Head & Shoulders, Ascending/Descending Wedges, Broadening Wedges, various Triangles, and Double Tops/Bottoms, enhancing your confluence detection in the market. For example, upon detecting a Double Top pattern, you could anticipate a potential price reversal due to this bearish signal. The sensitivity of this tool can be customized according to your trading style, with lower settings for short-term changes and higher for long-term. This feature leverages predefined formulas and price action analysis to identify these patterns.
🔹 Trendlines: With the Automatic Trendline Drawing tool, your technical analysis becomes significantly more efficient and precise. This feature is engineered to identify upward and downward Trendlines, aiding in locating potential pivots, and market support/resistance. For instance, if the price consistently rebounds off a Trendline, it may continue to do so, serving as a support/resistance level. However, a break through the Trendline could signal potential volatility and trend change. This feature's sensitivity to price changes can be adjusted to either short or long-term. It works by tracing Trendlines based on price action and wick formations to detect potential pivots.
🔹 Liquidity Bubbles: Liquidity Bubbles is an advanced tool that pinpoints key liquidity areas and large positions in real-time. This feature significantly contributes to effective trading strategy formulation by highlighting potential entry and exit points. It operates in real-time, ensuring zero repaint or lag, and supports two modes: Enhanced Bubbles and Basic Bubbles. For instance, the detection of multiple bullish Liquidity Bubbles during a ranging market could suggest an upward price movement due to dominant bullish volume. This feature's settings include thresholds for insignificant bubble filtering and a mode selection feature. Liquidity Bubbles operates by applying a proprietary formula to volume data, determining general volume direction and potential positions.
🔹 Market Structure: The Market Structure tool identifies key market structures such as Break of Structures (BoS) and Change of Character (ChoCh), thereby enhancing your ability to read market trends and sentiment. This smart money concept gives you a unique insight into short-term and long-term market trends. For instance, the appearance of a bullish Break of Structure and Change of Character after a predominantly bearish market sentiment could suggest a new bullish trend. This feature allows users to select which Market Structures to display and calculates these structures based on the market's high and low points.
🔹 Order Blocks: Order Blocks provide a visual representation of areas where large market participants are likely to place orders. These zones, where significant buying or selling activity has occurred in the past, offer insightful data for future price movements. The Order Blocks feature operates in real-time, providing real-time Order Blocks without any lag. For instance, if the price enters a large Order Block with predominantly bullish volume, an upward price movement can be anticipated. However, if the price breaks through the block, it could suggest the block's invalidation and a likely continued price fall. You can configure the settings to enable an additional Order Block, customize timeframes, overlap functions, and apply a quality filter. This feature calculates Order Blocks using the volume and candle size data.
🔹 Supply/Demand Zones: This real-time tool identifies crucial supply and demand zones, revealing potential price reaction points. These zones, where supply (selling pressure) and demand (buying pressure) have historically impacted price significantly, provide traders with insights into potential areas of strong support (demand) and resistance (supply). For example, if the price enters a large supply zone, a price rejection could be anticipated due to historical selling pressure at this zone. The settings enable users to add an additional Supply/Demand Zone, customize the timeframe, and apply a quality filter. This feature identifies common Supply/Demand Zones patterns based on volume and the size of the zone and displays them on the chart.
🔹 Fair Value Gaps: The Fair Value Gaps tool is designed to identify potential price correction zones or "gaps". These areas, where the market price sharply deviated from the fair value, suggest potential price adjustments in the future. For instance, the formation of a bullish Fair Value Gap could indicate a future price drop to fill this gap, potentially followed by an upward movement if the gap was of fair value. The settings allow users to enable additional Fair Value Gaps, customize the timeframe, and apply a quality filter. This feature measures large market gaps based on the size of the gap and its volume.
These features and tools collectively offer a comprehensive solution for traders to understand and navigate the financial markets. It's important to remember that they are designed to assist in making informed trading decisions and should be used as part of a balanced trading strategy.
🟧 Usage
Lune Technical Analysis's unique feature set can be leveraged both individually and synergistically. It is important to understand each feature and experiment with different configurations to best suit your unique trading needs.
🔸 Example #1: The following example demonstrates how the Order Block and Liquidity Bubbles feature can be used together to enhance your market analysis.
Order Blocks work in real-time to identify key order zones based on price action. These zones are often crucial for predicting price fluctuations. Meanwhile, Liquidity Bubbles act as real-time visual cues that detect significant market positions, facilitating an understanding of market accumulation, distribution, and trapped positions.
In this instance, at point 1, a bearish Basic and Enhanced Liquidity Bubble is visible within a crucial Order Block. The combination of these indicators augments the bearish sentiment, leading to a potential price decrease. Similarly, at point 2, the conjunction of two bullish Basic Liquidity Bubbles within an Order Block strengthens the bullish sentiment, culminating in a subsequent price increase.
🔸 Example #2: The following example demonstrates how Supply and Demand Zones can be used to detect strong and quality supports and resistance.
Supply and Demand Zones operate in real-time, detecting crucial zones based on price action and volume. This feature is invaluable for predicting potential price reaction points.
At point 1, the price enters a Supply Zone, a historical hotspot for selling activity, which usually leads to a price rejection and consequent decrease. At point 2, a Demand Zone indicating a bullish sentiment suggests a potential reversal when the price touches this level.
🔸 Example #3: The following example demonstrates how the Chart Pattern Detection feature is able to detect chart patterns to help enhance your trades.
Chart Pattern Detection employs formulas and price action analysis to identify common chart patterns as they form. Here, it successfully detects a 'Head and Shoulders' pattern, a conventionally bearish pattern, indicating a potential price drop.
🟥 Conclusion
Lune Technical Analysis stands as an exceptional blend of real-time insights into market activity. Its real-time, non-repainting features offer traders a more precise and timely approach to market analysis, promoting improved decision making in ever-changing market conditions.
🔻 Access
You can see the Author's instructions below to get instant access to this indicator & our Premium Suite.
🔻 Disclaimer
Lune Technical Analysis is a tool for aiding in market analysis and is not a guarantee of future market performance or individual trading success. We strongly recommend that users combine our tool with their trading strategies and do their due diligence before making any trading decisions.
Remember, past performance is not indicative of future results. Please trade responsibly.
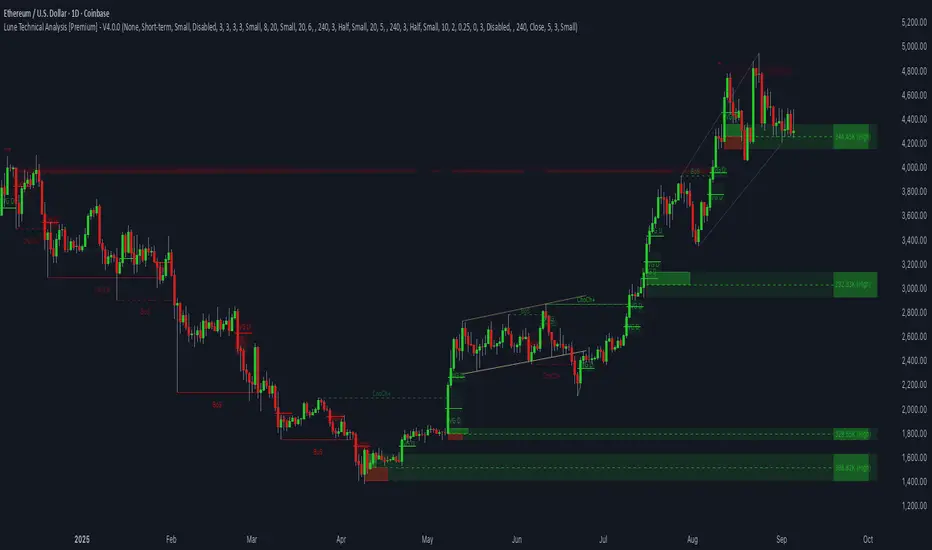
Chart Time and Price Range It is easy to loose track of time and price volatility when the chart automatically scales to the bars on the chart. This helps you keep track.
This is a very simple indicator that is designed to ensure that you're looking at a segment of the chart that is relevant to the trade you're considering in both price distance and time.
The Problem:
When looking at a chart the lowest price is at the bottom of the screen, the highest price is at the top. The time at the beginning of the chart is based on how many bars and what timeframe you're looking at.
But is the price difference between the two wide or narrow? Are you seeing minutes, hours, or days of price action?
You can get the measure tool out, but you'll change the zoom level and now its different. You change the timeframe and its different.
This Solution:
This indicator puts a table on the screen that will tell you the X/Y distance of everything that is on your chart. If your hold period is 5 minutes, why would you be looking at 3 days of price action to find s/r or make a decision on a trade?
This will show you how much price opportunity was available in the amount of time you are currently viewing. Using the PineCoders VisibleChart library, we're retrieving the time and bar_index of the beginning of the chart so that everything that is currently on the chart is measured and it adapts as that changes.
It will work with light and dark themes (you can change the colors) and can be positioned wherever you prefer to see the information.
Disclaimer: This was a quick release script. I wrote it and published the same day. There could be bugs, so send me a message or add a comment to report anything that isn't behaving correctly.

Breakout Probability (Expo)█ Overview
Breakout Probability is a valuable indicator that calculates the probability of a new high or low and displays it as a level with its percentage. The probability of a new high and low is backtested, and the results are shown in a table— a simple way to understand the next candle's likelihood of a new high or low. In addition, the indicator displays an additional four levels above and under the candle with the probability of hitting these levels.
The indicator helps traders to understand the likelihood of the next candle's direction, which can be used to set your trading bias.
█ Calculations
The algorithm calculates all the green and red candles separately depending on whether the previous candle was red or green and assigns scores if one or more lines were reached. The algorithm then calculates how many candles reached those levels in history and displays it as a percentage value on each line.
█ Example
In this example, the previous candlestick was green; we can see that a new high has been hit 72.82% of the time and the low only 28.29%. In this case, a new high was made.
█ Settings
Percentage Step
The space between the levels can be adjusted with a percentage step. 1% means that each level is located 1% above/under the previous one.
Disable 0.00% values
If a level got a 0% likelihood of being hit, the level is not displayed as default. Enable the option if you want to see all levels regardless of their values.
Number of Lines
Set the number of levels you want to display.
Show Statistic Panel
Enable this option if you want to display the backtest statistics for that a new high or low is made. (Only if the first levels have been reached or not)
█ Any Alert function call
An alert is sent on candle open, and you can select what should be included in the alert. You can enable the following options:
Ticker ID
Bias
Probability percentage
The first level high and low price
█ How to use
This indicator is a perfect tool for anyone that wants to understand the probability of a breakout and the likelihood that set levels are hit.
The indicator can be used for setting a stop loss based on where the price is most likely not to reach.
The indicator can help traders to set their bias based on probability. For example, look at the daily or a higher timeframe to get your trading bias, then go to a lower timeframe and look for setups in that direction.
-----------------
Disclaimer
The information contained in my Scripts/Indicators/Ideas/Algos/Systems does not constitute financial advice or a solicitation to buy or sell any securities of any type. I will not accept liability for any loss or damage, including without limitation any loss of profit, which may arise directly or indirectly from the use of or reliance on such information.
All investments involve risk, and the past performance of a security, industry, sector, market, financial product, trading strategy, backtest, or individual's trading does not guarantee future results or returns. Investors are fully responsible for any investment decisions they make. Such decisions should be based solely on an evaluation of their financial circumstances, investment objectives, risk tolerance, and liquidity needs.
My Scripts/Indicators/Ideas/Algos/Systems are only for educational purposes!

Road To DubaiROAD TO DUBAI
Useful for daily trading over all type of asset, from Stock to Crypto, Forex and Commodities. It works best with 5min to 1hr graphs, if you are a intraday trader.
This is not a simple mashup of indicators, because you can add them as your own.
This script is more like a tool to understand price action based on indicators position . Thanks to cross call based on MACD , RSI with EMA applied and few index realtime mapping, this tool will let you reduce time effort for graph analysis .
As extra feature it will let you to try different strategies , all fully customizable.
I've tried my best to keep it readble, and easy to use. The best way to learn to use it, is to disable all features from configuration and try one by one.
CONFIGURATION TIPS : Click "Settings Gear" in the Upper Right Corner and disable "Indicator Arguments"
HOW TO PROPER SETUP
Road to Dubai 3 is semiautomatic on finding best Long and Short areas, and plot on the chart.
From configuration menu you can set a Backtrace period and sensibility for RSI EMA10, RSI EMA80 and MACD on your Timeframe, 5min, 30min, 60min.
Usually when configured, those parameters works fine on almost every asset.
You only need to start understanding signals.
STANDARD FEATURES
VWAP : Green/Red line. It will reset everyday at 00.00.
EMA80 : White Line
BLUELINES : Positive and negative overextend value from VWap . This is based on a range of bar and it will extend on the opposite side the lower or higher candle. Useful for understading where price can arrive, expecially if a spike will appear.
Those indicators are quite useful for understading trends, price positions and maximum price range.
RSI EMA10 OVERBOUGHT / OVERSOLD
Yellow arrow marks where RSI arrived at his Top or Bottom. If on different timeframes (5min, 30min and 60min) something similar happen area is filled with Red or Green.
This is base on EMA10 applied to RSI (I usually refer at it as Yellow Line on my indicator HighFreq Trader)
To find good values please try High Freq Trader 1.3
RSI EMA80 CALL
Red Cross or Green Square advice for a really potential inversion of trend. When a Silver bar appear, this means the same call was triggered on different Timeframe in the sametime.
This is based on EMA80 applied to RSI (I usually refer at it as Blue Line on my indicator HighFreq Trader).
To find good values please try High Freq Trader 1.3
MACD CALL
Based on MACD with standard settings. When triggered, a lime Triangle appears. Differents size based on timeframe (5min smaller, 60min bigger). If the same call is triggered on the same place a Lime Bar appear on the opposite side of trend (this is a graphical contents, bacause with all enabled, standard use, can be difficult to read signals).
In Menu Settings you will be able to set your best parameter for your asset.
MACD FIBONACCI EXTRA FEATURE
If you want you can enable a Fibonacci draw based on MACD . This works at his best (on my opinion) with 30min MACD
EXAMPLE
NATURAL GAS
In this chart 30min you can see all calls triggered for a Short. Yellow RSI Arrow, Red Cross, Macd Triangle and Colored Red, Lime and Silver Bars are all calling for Short.
In this way you can see in notime if this can be a perfect moment for take position
VIX VXN DXY CALLS
If VIX , VXN is triggered a small Green Dot will appear. If both are in the same time a bigger Dot appear. Very useful to find trend inversion.
If DXY is triggered a Red Dot will appear (only on Daily Chart ). Very Useful to understand trend inversion on whole market.
VOLUMES REMINDERS
Find if there was an High Volume traded (HV) or Low Volume Traded (LV) in the near past. Useful to understand if some tricky situation could happen (like a sudden sell, an accumulation or distribution)

Text Price to Chart By MercalonaThis script was developed to visualize ideas of trades sent by groups on the internet. For example (Telegram, Whatsapp, Discord).
This is a trade idea:
XAUUSD BUY
Entry: 1766.40
SL: 1757.40
TP1: 1769.40
TP2: 1772.40
TP3: 1776.40
TP4: 1780.40
TP5: 1800
So what needs to be done?
1. Open this script in the "GBPNZD" chart.
2. Click on "configuration"
3. Copy the message.
4. Paste the message in the "Prices" field
5. Click "Ok"
What is the end result?
Then, if everything goes well, all lines compatible with the price informed in the message text will be displayed.
The lines can be green if the word "buy" or "Bought" exists, otherwise it will be red
It is also possible to configure 3 dates to be displayed on the graph.
Usually the first date is set to know the point that the entry was made in the trade.
Please feedback us.
We hope this helps you!

GAPS CheckerUsing this indicator allows you to indentify large GAPS directly in your stock chart at first glance.
It uses two different sorts for large GAPS (e.g. larger than 3%) and for very large GAPS (e.g. larger than 6%). These values can be changed in the indicator settings.
Hope this helps many of you to be more efficient in your chart analysis - have fun!

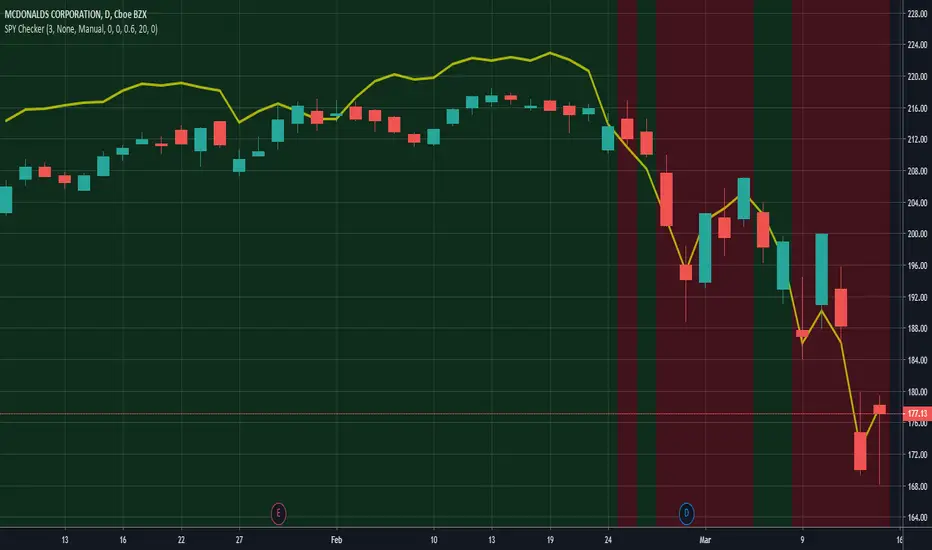
SPY CheckerUsing this indicator allows you to check the SPY for large gaps and candles (e.g. >1%) directly in your stock chart at first glance.
It is now also possible to use this indicator for all stock charts and to get the SPY indication on them visible without opening the SPY chart explicitly.
You are able to display the SPY trendline in the current chart as an overlay (yellow line) and configure the SPY trendline adjustment in the indicator settings. This will allow you to determine if the current stock chart is following the SPY or not. And you can also select a trading stop for several days in the indicator settings, which is visible through the green and red background color.
Hope this helps many of you to be more efficient in your SPY verification - have fun!
GAPS Checker v2 PROUsing this indicator allows you to indentify large GAPS directly in your stock chart at first glance. The algorithm of the indicator *Gaps Checker v2* was optimized in this new indicator as well as it using the new pine script version v4. For backwards compatibility reasons this indicator is published.
This indicator is available in two versions ‘Lite’ and ‘PRO’. The difference is the calculated precision and the percent inputs in integer numbers or more granular in float values.
It uses two different sorts for large GAPS (yellow, e.g. larger than 2%) and for very large GAPS (red, e.g. larger than 4%). These values can be changed in the indicator settings.
Hope this helps many of you to be more efficient in your chart analysis - have fun!

GAPS Checker v2 LiteUsing this indicator allows you to indentify large GAPS directly in your stock chart at first glance. The algorithm of the indicator *Gaps Checker v2* was optimized in this new indicator as well as it using the new pine script version v4. For backwards compatibility reasons this indicator is published.
This indicator is available in two versions ‘Lite’ and ‘PRO’. The difference is the calculated precision and the percent inputs in integer numbers or more granular in float values.
It uses two different sorts for large GAPS (yellow, e.g. larger than 2%) and for very large GAPS (red, e.g. larger than 4%). These values can be changed in the indicator settings.
Hope this helps many of you to be more efficient in your chart analysis - have fun!

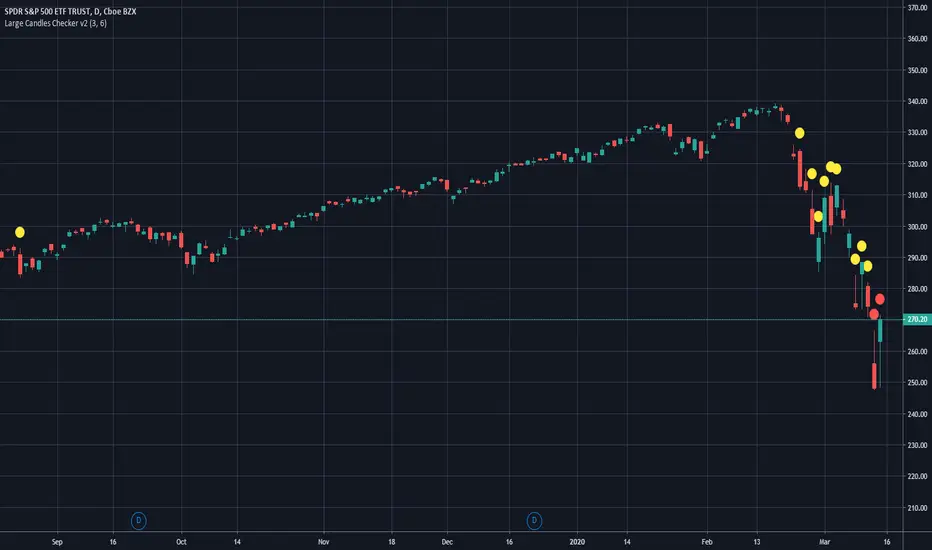
Large Candles Checker v2Using this indicator allows you to indentify large candles directly in your stock chart at first glance. The algorithm of the indicator *Large Candles Checker v2* was optimized in this new indicator as well as it using the new pine script version v4. For backwards compatibility reasons this indicator is published as v2.
Added tails and wicks (also referred to as long and short shadows) to the calculation algorithm. You will be able to configure the tails and wicks in the indicator settings. And the calculated percentage value of large candles will now also be displayed.
It uses two different sorts for large candles (yellow, e.g. larger than 3%) and for very large candles (red, e.g. larger than 6%). These values can be changed in the indicator settings.
Hope this helps many of you to be more efficient in your chart analysis - have fun!
SPY Checker v2Using this indicator allows you to check the SPY for large gaps and candles (e.g. >1%) directly in your stock chart at first glance. The algorithm of the * SPY Checker v2* indicator was optimized in this new indicator as well as it using the new pine script version v4. For backwards compatibility reasons this indicator is published as v2.
It is now also possible to use this indicator for all stock charts and to get the SPY indication on them visible without opening the SPY chart explicitly. Additionally added a several days trading stop feature, which is visible on the chart through the green and red background color. This configuration is available in the indicator settings.
Hope this helps many of you to be more efficient in your SPY indication - have fun!
