Major exchages total Open interest & Long/Short OI trends📊 Indicator: Major Exchanges Total OI & Long/Short Trends
This Pine Script™ indicator is designed to provide a comprehensive analysis of Open Interest (OI) and Long/Short position trends across major cryptocurrency exchanges (Binance, Bybit, OKX, Bitget, HTX, Deribit). It serves as a powerful tool for traders seeking to understand market liquidity, participant positioning, and overall market sentiment.
🔑 Key Features and Functionalities
Aggregated Multi-Exchange Open Interest (OI):
Consolidates real-time Open Interest data from user-selected major cryptocurrency exchanges.
Provides a unified view of the total OI, offering insights into the collective market liquidity and the aggregate size of participants' open positions.
Visualized Combined OI Candles:
Presents the aggregated total OI data in a candlestick chart format.
Displays the Open, High, Low, and Close of the combined OI, with color variations indicating increases or decreases from the previous period. This enables intuitive visualization of OI trend shifts.
Estimated Long/Short OI and Visualization:
Calculates and visualizes estimated Long and Short position Open Interest based on the total aggregated OI data.
Estimation Logic:
Employs a sophisticated logic that considers both price changes and OI fluctuations to infer the balance between Long and Short positions. For instance, an increase in both price and OI may suggest an accumulation of Long positions, while a price decrease coupled with an OI increase might indicate growing Short positions.
Initial 50:50 Ratio:
The estimation for Long/Short OI begins with an assumption of a 50:50 ratio at the initial data point available for the selected timeframe. This establishes a neutral baseline, from which subsequent price and OI changes drive the divergence and evolution of the estimated Long/Short balance.
Flexible Visualization Options:
Allows users to display Long/Short OI data in either line or candlestick styles, with customizable color schemes. This flexibility aids in clearly discerning bullish or bearish positioning trends.
💡 Development Background
The development of this indicator stems from the critical importance of Open Interest data in the cryptocurrency derivatives market. Recognizing the limitations of analyzing individual exchange OI in isolation, the primary objective was to integrate data from leading exchanges to offer a holistic perspective on market sentiment and overall positioning dynamics.
The inclusion of the Long/Short position estimation feature is crucial for deciphering the specific directional biases of market participants, which is often not evident from raw OI data alone. This enables a deeper understanding of how positions are being accumulated or liquidated, moving beyond simple OI change analysis.
Furthermore, a key design consideration was to leverage the characteristic where the indicator's data start point dynamically adjusts with the chart's timeframe selection. This allows for the analysis of short-term Long/Short trends on shorter timeframes and long-term trends on longer timeframes. This inherent flexibility empowers traders to conduct analyses across various time scales, aligning with their diverse trading strategies.
🚀 Trading Applications
Leveraging Combined Open Interest (OI):
Trend Confirmation: A sustained increase in total OI signifies growing market interest and capital inflow, potentially confirming the strength of an existing trend. Conversely, decreasing OI may suggest diminishing participant interest or widespread position liquidation.
Validation of Price Extremes: If price forms a new high but OI fails to increase or declines, it could signal a potential trend reversal (divergence). Conversely, a sharp increase in OI during a price decline might indicate a surge in short positions or renewed selling pressure.
Identifying Volatility Triggers: Monitoring rapid shifts in OI during significant news events or market catalysts can help assess immediate market reactions and liquidity changes.
📈Utilizing Long/Short OI Trends
Assessing Market Bias: A sustained dominance or rapid increase in Long OI suggests a prevalent bullish sentiment, which could inform decisions to enter or maintain long positions. The inverse scenario indicates bearish sentiment and potential short entry opportunities.
Anticipating Squeezes: The indicator can help identify scenarios conducive to short or long squeezes. Excessive short positioning followed by a price uptick can trigger a short squeeze, leading to rapid price appreciation. Conversely, an oversupply of long positions preceding a price drop can result in a long squeeze and sharp declines.
Divergence Analysis: Divergences between price action and Long/Short OI estimates can signal potential trend reversals. For example, if price is rising but the increase in Long OI slows down or Short OI begins to grow, it may suggest weakening buying pressure.
🕔Timeframe-Specific Trend Analysis:
Shorter Timeframes (e.g., 1m, 5m, 15m): Ideal for identifying short-term shifts in participant positioning, beneficial for day trading and scalping strategies. Provides insights into immediate market reactions to price movements.
Longer Timeframes (e.g., 1h, 4h, Daily): Valuable for evaluating broader positioning trends and the sustainability or potential reversal of medium-to-long-term trends. Offers a macro perspective on Long/Short dynamics, suitable for swing trading or long-term investment strategies.
This indicator integrates complex market data, provides nuanced Long/Short position estimations, and offers multi-timeframe analytical capabilities, empowering traders to make more informed and strategic decisions.
Chartanalysis

BTC Open interest (binance, bybit, okx, bitget, htx, deribit)📈 BTC Open Interest Candles (Binance, Bybit, OKX, Bitget, HTX, Deribit)
🌟 Overview
This Pine Script indicator fetches real-time Bitcoin (BTC) perpetual futures open interest (OI) data from major cryptocurrency exchanges (Binance, OKX, Bybit, Bitget, HTX, Deribit), aggregates it, and visualizes it as candlesticks on the chart. Each candlestick represents the combined OI values at the open, high, low, and close of that bar. Candlestick colors change based on whether the current bar’s close OI is higher or lower than the previous bar’s, allowing intuitive tracking of OI fluctuations.
✨ Key Features
Multi-exchange OI aggregation: Combines OI data from selected exchanges to create a unified OI candlestick series.
Candlestick visualization: Converts aggregated OI values into open, high, low, and close values to plot candlestick charts, clearly showing the range and trend of OI over time.
Color-coded OI change:
Close OI higher than previous bar → teal candlestick (OI increase)
Close OI lower than previous bar → red candlestick (OI decrease)
⚙️ Inputs
Show Binance true Include Binance OI in the aggregation.
Show OKX true Include OKX OI in the aggregation.
Show Bybit true Include Bybit OI in the aggregation.
Show Bitget true Include Bitget OI in the aggregation.
Show HTX true Include HTX OI in the aggregation.
Show Deribit true Include Deribit OI in the aggregation.
📊 Calculation Methodology
Requests OI open, high, low, close values for the specified exchange using request.security().
Missing data (na) is treated as 0 to prevent aggregation errors.
Returns OI values as arrays.
➕ Aggregation of individual OI
Variables combinedOiOpen, combinedOiHigh, combinedOiLow, combinedOiClose initialized to 0.
Calls getOI for each enabled exchange and adds returned values to the combined variables.
🎨 Candlestick color determination
oiColorCond checks whether combinedOiClose > combinedOiClose .
True → openInterestColor = color.teal (OI increase)
False → openInterestColor = color.red (OI decrease)
🕯 Candlestick plotting
plotCandles ensures at least one exchange is selected.
plotcandle() is called with na values if no exchanges are selected to avoid drawing candles.
Candle body, wick, and border colors follow openInterestColor.
💡 How to Use
🌐 Integrated market sentiment
Observe overall market OI changes using a unified candlestick chart rather than fragmented exchange data to understand market sentiment and capital flow.
🔍 Compare with price movements
Analyze price charts alongside OI candlesticks to see how OI changes affect (or are affected by) price.
🟢 Price rising + teal OI candlestick (OI increase): Indicates bullish momentum from new long entries or short covering.
🔴 Price falling + red OI candlestick (OI decrease): Suggests bearish momentum from long liquidations or increased short covering.
📈 Price rising + red OI candlestick (OI decrease): Could reflect a short squeeze or profit-taking in long positions.
📉 Price falling + teal OI candlestick (OI increase): May indicate new short positions or forced long liquidations (stop-loss triggers).
⚡ Volatility prediction
Large OI candles or consecutive candles of a certain color can indicate imminent or ongoing significant market moves.

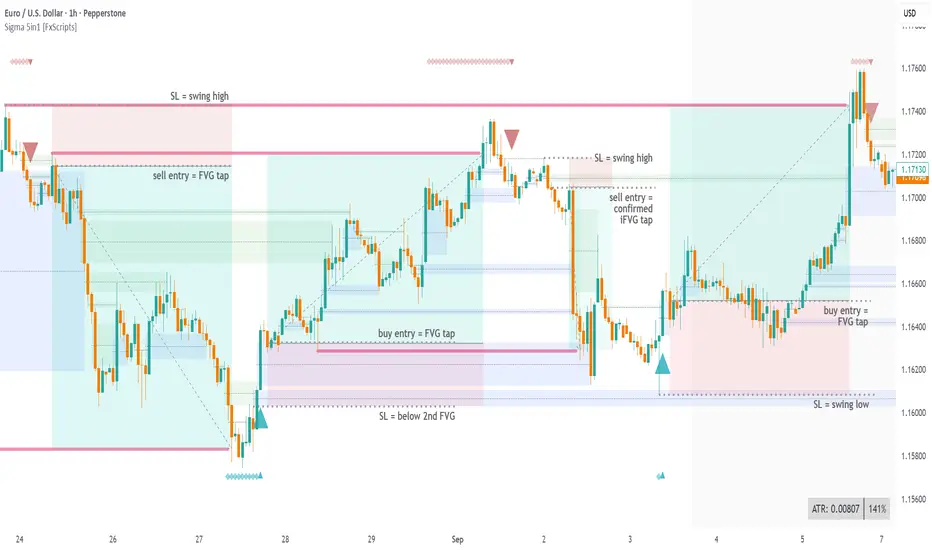
Sigma Reversal Print [FxScripts]Indicator Overview
The Sigma Reversal Print is a powerful tool designed for traders who like to trade reversal strategies plus trend traders looking to enter on strong pullbacks. It integrates advanced price action with volume analysis, highlighting areas where a trend reversal or pullback may be in progress, providing insights into where markets may be exhausted or about to surge.
Key Features and Functionality
Reversal Trading: Tailored primarily for reversal traders, the Sigma Reversal Print highlights zones where the market is likely to change direction. While this approach offers significant potential, it inherently carries a degree of risk due to the precision required in predicting market turning points. The Sigma Reversal Print uses advanced methodology to forecast such reversals with a high degree of accuracy.
Signal Generation Based on Reversal and Pullback Zones: The Reversal Print generates signals when price enters specific conditions, representing exhaustion followed by a change in order flow. These conditions allow the indicator to filter out low-probability signals and focus on those with higher potential for a trend change.
Settings
Sensitivity Control: The sensitivity setting allows traders to adjust the strength of the pattern required for a signal to be generated. The scale ranges from 2-10 with higher sensitivity demanding more confirmation, leading to fewer, generally more reliable, signals however backtesting is highly recommended. Adjusting the sensitivity enables traders to balance early entries with signal accuracy, accommodating both aggressive and more conservative strategies.
Customizable Length: The length setting allows users to fine-tune the calculation period, adjusting the indicator’s responsiveness to overall market conditions. Adjusting length allows the Reversal Print to adapt to the user’s trading style and timeframe of choice. Similar to the sensitivity control, the scale ranges from 2-10 with a higher length demanding more confirmation. This can lead to fewer, often more reliable, signals however, once again, backtesting is highly recommended.
Advanced Filters
Opening Gap Filter: Turning this on allows the system to avoid painting false signals that can be triggered by the daily or weekly opening gap at market open. This setting is toggled on by default.
Price Filter: This filter applies an additional weighted price action algorithm to the signal being painted thus further filtering out weaker signals. Warning dots will still paint however the larger break arrow will no longer paint if the filter is triggered. This setting is toggled on by default.
Volume Filter: This filters out low volume entries which have a lower probability of turning into successful trades. Variable from 1-10 with 1 being the most lenient and 10 the most stringent. Warning dots will still paint however the larger break arrow will no longer paint if the filter is triggered. This setting is toggled on by default.
Alerts
Configure alerts and receive notifications when the first warning dot in a sequence appears (the series of dots seen on the chart) and again when a breakpoint is triggered (the larger arrow on the chart). This feature is particularly beneficial for traders who like to monitor multiple instruments or prefer not to stare at a screen all day.
Performance and Optimization
Backtesting Results: The Reversal Print has undergone extensive backtesting across various instruments, timeframes and market conditions, demonstrating strong performance in identifying reversal points, particularly during volatile or overextended price movements. User backtesting is strongly encouraged as it allows traders to optimize settings for their preferred instruments and timeframes.
Optimization for Diverse Markets: The Reversal Print can be used on crypto, forex, indices, commodities or stocks. The Reversal Print's algorithmic foundation ensures consistent performance across a variety of instruments. Key settings such as Sensitivity and Length will require adjustment based on the volatility and characteristics of each market.
Educational Resources and Support
Users of the Sigma Reversal Print benefit from comprehensive educational resources and full access to FxScripts Support. This ensures traders can maximize the potential of the Reversal Print and other tools in the Sigma Indicator Suite by learning best practices and gaining insights from an experienced team of traders.
Summary
The Reversal Print is a powerful and adaptable tool for reversal and pullback traders, combining statistical analysis and price action to identify high-probability turning points. Its advanced customization options, flexible controls and integration with the Sigma Indicator Suite offer significant advantages over standard indicators. By pinpointing precise entry points, the Reversal Print enables traders to make informed trading decisions with confidence.
Market Spiralyst [Hapharmonic]Hello, traders and creators! 👋
Market Spiralyst: Let's change the way we look at analysis, shall we? I've got to admit, I scratched my head on this for weeks, Haha :). What you're seeing is an exploration of what's possible when code meets art on financial charts. I wanted to try blending art with trading, to do something new and break away from the same old boring perspectives. The goal was to create a visual experience that's not just analytical, but also relaxing and aesthetically pleasing.
This work is intended as a guide and a design example for all developers, born from the spirit of learning and a deep love for understanding the Pine Script™ language. I hope it inspires you as much as it challenged me!
🧐 Core Concept: How It Works
Spiralyst is built on two distinct but interconnected engines:
The Generative Art Engine: At its core, this indicator uses a wide range of mathematical formulas—from simple polygons to exotic curves like Torus Knots and Spirographs—to draw beautiful, intricate shapes directly onto your chart. This provides a unique and dynamic visual backdrop for your analysis.
The Market Pulse Engine: This is where analysis meets art. The engine takes real-time data from standard technical indicators (RSI and MACD in this version) and translates their states into a simple, powerful "Pulse Score." This score directly influences the appearance of the "Scatter Points" orbiting the main shape, turning the entire artwork into a living, breathing representation of market momentum.
🎨 Unleash Your Creativity! This Is Your Playground
We've included 25 preset shapes for you... but that's just the starting point !
The real magic happens when you start tweaking the settings yourself. A tiny adjustment can make a familiar shape come alive and transform in ways you never expected.
I'm genuinely excited to see what your imagination can conjure up! If you create a shape you're particularly proud of or one that looks completely unique, I would love to see it. Please feel free to share a screenshot in the comments below. I can't wait to see what you discover! :)
Here's the default shape to get you started:
The Dynamic Scatter Points: Reading the Pulse
This is where the magic happens! The small points scattered around the main shape are not just decorative; they are the visual representation of the Market Pulse Score.
The points have two forms:
A small asterisk (`*`): Represents a low or neutral market pulse.
A larger, more prominent circle (`o`): Represents a high, strong market pulse.
Here’s how to read them:
The indicator calculates the Pulse Strength as a percentage (from 0% to 100%) based on the total score from the active indicators (RSI and MACD). This percentage determines the ratio of circles to asterisks.
High Pulse Strength (e.g., 80-100%): Most of the scatter points will transform into large circles (`o`). This indicates that the underlying momentum is strong and It could be an uptrend. It's a visual cue that the market is gaining strength and might be worth paying closer attention to.
Low Pulse Strength (e.g., 0-20%): Most or all of the scatter points will remain as small asterisks (`*`). This suggests weak, neutral, or bearish momentum.
The key takeaway: The more circles you see, the stronger the bullish momentum is according to the active indicators. Watch the artwork "breathe" as the circles appear and disappear with the market's rhythm!
And don't worry about the shape you choose; the scatter points will intelligently adapt and always follow the outer boundary of whatever beautiful form you've selected.
How to Use
Getting started with Spiralyst is simple:
Choose Your Canvas: Start by going into the settings and picking a `Shape` and `Palette` from the "Shape Selection & Palette" group that you find visually appealing. This is your canvas.
Tune Your Engine: Go to the "Market Pulse Engine" settings. Here, you can enable or disable the RSI and MACD scoring engines. Want to see the pulse based only on RSI? Just uncheck the MACD box. You can also fine-tune the parameters for each indicator to match your trading style.
Read the Vibe: Observe the scatter points. Are they mostly small asterisks or are they transforming into large, vibrant circles? Use this visual feedback as a high-level gauge of market momentum.
Check the Dashboard: For a precise breakdown, look at the "Market Pulse Analysis" table on the top-right. It gives you the exact values, scores, and total strength percentage.
Explore & Experiment: Play with the different shapes and color palettes! The core analysis remains the same, but the visual experience can be completely different.
⚙️ Settings & Customization
Spiralyst is designed to be highly customizable.
Shape Selection & Palette: This is your main control panel. Choose from over 25 unique shapes, select a color palette, and adjust the line extension style ( `extend` ) or horizontal position ( `offsetXInput` ).
scatterLabelsInput: This setting controls the total number of points (both asterisks and circles) that orbit the main shape. Think of it as adjusting the density or visual granularity of the market pulse feedback.
The Market Pulse engine will always calculate its strength as a percentage (e.g., 75%). This percentage is then applied to the `scatterLabelsInput` number you've set to determine how many points transform into large circles.
Example: If the Pulse Strength is 75% and you set this to `100` , approximately 75 points will become circles. If you increase it to `200` , approximately 150 points will transform.
A higher number provides a more detailed, high-resolution view of the market pulse, while a lower number offers a cleaner, more minimalist look. Feel free to adjust this to your personal visual preference; the underlying analytical percentage remains the same.
Market Pulse Engine:
`⚙️ RSI Settings` & `⚙️ MACD Settings`: Each indicator has its own group.
Enable Scoring: Use the checkbox at the top of each group to include or exclude that indicator from the Pulse Score calculation. If you only want to use RSI, simply uncheck "Enable MACD Scoring."
Parameters: All standard parameters (Length, Source, Fast/Slow/Signal) are fully adjustable.
Individual Shape Parameters (01-25): Each of the 25+ shapes has its own dedicated group of settings, allowing you to fine-tune every aspect of its geometry, from the number of petals on a flower to the windings of a knot. Feel free to experiment!
For Developers & Pine Script™ Enthusiasts
If you are a developer and wish to add more indicators (e.g., Stochastic, CCI, ADX), you can easily do so by following the modular structure of the code. You would primarily need to:
Add a new `PulseIndicator` object for your new indicator in the `f_getMarketPulse()` function.
Add the logic for its scoring inside the `calculateScore()` method.
The `calculateTotals()` method and the dashboard table are designed to be dynamic and will automatically adapt to include your new indicator!
One of the core design philosophies behind Spiralyst is modularity and scalability . The Market Pulse engine was intentionally built using User-Defined Types (UDTs) and an array-based structure so that adding new indicators is incredibly simple and doesn't require rewriting the main logic.
If you want to add a new indicator to the scoring engine—let's use the Stochastic Oscillator as a detailed example—you only need to modify three small sections of the code. The rest of the script, including the adaptive dashboard, will update automatically.
Here’s your step-by-step guide:
#### Step 1: Add the User Inputs
First, you need to give users control over your new indicator. Find the `USER INTERFACE: INPUTS` section and add a new group for the Stochastic settings, right after the MACD group.
Create a new group name: `string GRP_STOCH = "⚙️ Stochastic Settings"`
Add the inputs: Create a boolean to enable/disable it, and then add the necessary parameters (`%K`, `%D`, `Smooth`). Use the `active` parameter to link them to the enable/disable checkbox.
// Add this code block right after the GRP_MACD and MACD inputs
string GRP_STOCH = "⚙️ Stochastic Settings"
bool stochEnabledInput = input.bool(true, "Enable Stochastic Scoring", group = GRP_STOCH)
int stochKInput = input.int(14, "%K Length", minval=1, group = GRP_STOCH, active = stochEnabledInput)
int stochDInput = input.int(3, "%D Smoothing", minval=1, group = GRP_STOCH, active = stochEnabledInput)
int stochSmoothInput = input.int(3, "Smooth", minval=1, group = GRP_STOCH, active = stochEnabledInput)
#### Step 2: Integrate into the Pulse Engine (The "Factory")
Next, go to the `f_getMarketPulse()` function. This function acts as a "factory" that builds and configures the entire market pulse object. You need to teach it how to build your new Stochastic indicator.
Update the function signature: Add the new `stochEnabledInput` boolean as a parameter.
Calculate the indicator: Add the `ta.stoch()` calculation.
Create a `PulseIndicator` object: Create a new object for the Stochastic, populating it with its name, parameters, calculated value, and whether it's enabled.
Add it to the array: Simply add your new `stochPulse` object to the `array.from()` list.
Here is the complete, updated `f_getMarketPulse()` function :
// Factory function to create and calculate the entire MarketPulse object.
f_getMarketPulse(bool rsiEnabled, bool macdEnabled, bool stochEnabled) =>
// 1. Calculate indicator values
float rsiVal = ta.rsi(rsiSourceInput, rsiLengthInput)
= ta.macd(close, macdFastInput, macdSlowInput, macdSignalInput)
float stochVal = ta.sma(ta.stoch(close, high, low, stochKInput), stochDInput) // We'll use the main line for scoring
// 2. Create individual PulseIndicator objects
PulseIndicator rsiPulse = PulseIndicator.new("RSI", str.tostring(rsiLengthInput), rsiVal, na, 0, rsiEnabled)
PulseIndicator macdPulse = PulseIndicator.new("MACD", str.format("{0},{1},{2}", macdFastInput, macdSlowInput, macdSignalInput), macdVal, signalVal, 0, macdEnabled)
PulseIndicator stochPulse = PulseIndicator.new("Stoch", str.format("{0},{1},{2}", stochKInput, stochDInput, stochSmoothInput), stochVal, na, 0, stochEnabled)
// 3. Calculate score for each
rsiPulse.calculateScore()
macdPulse.calculateScore()
stochPulse.calculateScore()
// 4. Add the new indicator to the array
array indicatorArray = array.from(rsiPulse, macdPulse, stochPulse)
MarketPulse pulse = MarketPulse.new(indicatorArray, 0, 0.0)
// 5. Calculate final totals
pulse.calculateTotals()
pulse
// Finally, update the function call in the main orchestration section:
MarketPulse marketPulse = f_getMarketPulse(rsiEnabledInput, macdEnabledInput, stochEnabledInput)
#### Step 3: Define the Scoring Logic
Now, you need to define how the Stochastic contributes to the score. Go to the `calculateScore()` method and add a new case to the `switch` statement for your indicator.
Here's a sample scoring logic for the Stochastic, which gives a strong bullish score in oversold conditions and a strong bearish score in overbought conditions.
Here is the complete, updated `calculateScore()` method :
// Method to calculate the score for this specific indicator.
method calculateScore(PulseIndicator this) =>
if not this.isEnabled
this.score := 0
else
this.score := switch this.name
"RSI" => this.value > 65 ? 2 : this.value > 50 ? 1 : this.value < 35 ? -2 : this.value < 50 ? -1 : 0
"MACD" => this.value > this.signalValue and this.value > 0 ? 2 : this.value > this.signalValue ? 1 : this.value < this.signalValue and this.value < 0 ? -2 : this.value < this.signalValue ? -1 : 0
"Stoch" => this.value > 80 ? -2 : this.value > 50 ? 1 : this.value < 20 ? 2 : this.value < 50 ? -1 : 0
=> 0
this
#### That's It!
You're done. You do not need to modify the dashboard table or the total score calculation.
Because the `MarketPulse` object holds its indicators in an array , the rest of the script is designed to be adaptive:
The `calculateTotals()` method automatically loops through every indicator in the array to sum the scores and calculate the final percentage.
The dashboard code loops through the `enabledIndicators` array to draw the table. Since your new Stochastic indicator is now part of that array, it will appear automatically when enabled!
---
Remember, this is your playground! I'm genuinely excited to see the unique shapes you discover. If you create something you're proud of, feel free to share it in the comments below.
Happy analyzing, and may your charts be both insightful and beautiful! 💛

Ralph Indicator - ZaraTrust Smart MoneyThe Ralph Indicator – ZaraTrust Smart Money is a powerful yet simple Smart Money Concepts (SMC) based tool designed for traders who want to trade like institutions. It auto-detects high-probability Buy/Sell zones, Support/Resistance levels, and Demand/Supply areas on the chart — giving you clear, visual, and actionable signals without the clutter.
⸻
🔍 Key Features:
✅ Smart Money Structure
• Uses pivot-based logic to identify potential structure points
• Helps you understand market flow (e.g., BOS, CHoCH simplified logic)
✅ Automatic Support & Resistance
• Plots major levels based on significant highs and lows
• Helps catch key reversal or breakout zones
✅ Demand & Supply Zones
• Visually shows areas where price may react strongly
• Based on smart pivot detection from recent swings
✅ Buy/Sell Trade Signals
• Highlights buy when price breaks resistance (possible bullish shift)
• Highlights sell when price breaks support (possible bearish shift)
✅ Clean & Easy UI
• Toggle features on/off from settings panel
• Labels and shapes are plotted clearly on the chart for instant reading
⸻
🛠️ Recommended Use:
• Use on 15min to 4H timeframe for intraday or swing trading
• Combine with price action (e.g., confirmation candles, liquidity grab)
• Works best when paired with institutional logic (OBs, FVG, liquidity)
⸻
⚠️ Disclaimer:
This indicator is a tool, not a signal service.
It does not guarantee 98% accuracy, but it’s designed to highlight smart money zones and high-probability areas. Always do your own risk management and backtest before using on a live account.

Opening Range Breakout🧭 Overview
The Open Range Breakout (ORB) indicator is designed to capture and display the initial price range of the trading day (typically the first 15 minutes), and help traders identify breakout opportunities beyond this range. This is a popular strategy among intraday and momentum traders.
🔧 Features
📊 ORB High/Low Lines
Plots horizontal lines for the session’s high and low
🟩 Breakout Zones
Background highlights when price breaks above or below the range
🏷️ Breakout Labels
Text labels marking breakout events
🧭 Session Control
Customizable session input (default: 09:15–09:30 IST)
📍 ORB Line Labels
Text labels anchored to the ORB high and low lines (aligned right)
🔔 Alerts
Configurable alerts for breakout events
⚙️ Adjustable Settings
Show/hide background, labels, session window, etc.
⏱️ Session Logic
• The ORB range is calculated during a defined session window (default: 09:15–09:30).
• During this window, the highest high and lowest low are recorded as ORB High and ORB Low.
📈 Breakout Detection
• Breakout Above: Triggered when price crosses above the ORB High.
• Breakout Below: Triggered when price crosses below the ORB Low.
• Each breakout can trigger:
• A background highlight (green/red)
• A text label (“Breakout ↑” / “Breakout ↓”)
• An optional alert
🔔 Alerts
Two built-in alert conditions:
1. Breakout Above ORB High
• Message: "🔼 Price broke above ORB High: {{close}}"
2. Breakout Below ORB Low
• Message: "🔽 Price broke below ORB Low: {{close}}"
You can create alerts in TradingView by selecting these from the Add Alert window.
📌 Best Use Cases
• Intraday momentum trading
• Breakout and scalping strategies
• First 15-minute range traders (NSE, BSE markets)

Super MTF Clouds (4x3 Pairs)Overview:
This script is based on Ripster's MTF clouds, which transcends the standard moving average cloud indicator by offering a powerful and deeply customizable Multi-Timeframe (MTF) analysis. Instead of being limited to the moving averages of your current charts from the current timeframe, this tool allows you to project and visualize the trend and key support/resistance zones from up to 4 different timeframes simultaneously. User can input up to 6 different EMA values which will form 3 pairs of EMA clouds, for each of the timeframes.
The primary purpose is to provide traders with immediate confluence. By observing how price interacts with moving average clouds from higher timeframes (e.g., Hourly, Daily, Weekly), you can make more informed decisions on your active trading timeframe (e.g., 10 Minute). It's designed as a complete MTF Cloud toolkit, allowing you to display all necessary MTFs in a single script to build a comprehensive view of the market structure without having to flick to different timeframe to look for cloud positions.
Key features:
Four Independent Multi-Timeframe Slots: Each slot can be assigned any timeframe available on TradingView (e.g., D, W, M, 4H).
Three MA Pairs Per Timeframe: For each timeframe, configure up to three separate MA clouds (e.g., a 9/12 EMA pair, a 20/50 EMA pair, and a 100/200 SMA pair).
Complete Customisation: For every single moving average (24 in total), you can independently control:
MA Type: Choose between EMA or SMA.
Length: Any period you require.
Line Color: Full colour selection.
Line Thickness: Adjust the visual weight of each line.
Cloud Control: For every pair (12 in total), you can set the fill colour and transparency.
How To Use This Script:
This tool is best used for confirmation and context. Here are some practical strategies that one can adopt:
Trend Confluence: Before taking a trade based on a signal on your current timeframe, glance at the higher timeframe clouds. If you see a buy signal on the 15-minute chart and the price is currently trading above a thick, bullish Daily cloud, the probability of that trade succeeding is significantly higher. Conversely, shorting into strong HTF support is a low-probability trade.
Dynamic Support & Resistance: The edges of the higher timeframe clouds often act as powerful, dynamic levels of support and resistance. A pullback to the 4-Hour 50 EMA on your 15-minute chart can be a prime area to look for entries in the direction of the larger trend.
Gauging Market Regimes: Use the toggles in the settings to quickly switch between different views. You can have a "risk-on" view with short-term clouds and a "macro" view with weekly and monthly clouds. This helps you adapt your trading style to the current market conditions.
Key Settings:
1. Global Setting
Source For All MAs: This determines the price data point used for every single moving average calculation.
Default: hl2 (an average of the High and Low of each bar). This gives a smooth midpoint price.
Options: You can change this to Close (the most common method), Open, High, Low, or ohlc4 (an average of the open, high, low, and close), among others.
Recommendation: For most standard trend analysis, the default hl2 is the common choice.
2. The Timeframe Group Structure
The rest of the settings are organized into four identical, collapsible groups: "Timeframe 1 Settings" through "Timeframe 4 Settings". Each group acts as a self-contained control panel for one multi-timeframe view.
Within each timeframe group, you have two master controls:
Enable Timeframe: This is the main power switch for the entire group. Uncheck this box to instantly hide all three clouds and lines associated with this timeframe. This is perfect for quickly decluttering your chart or focusing on a different set of analyses.
Timeframe: This dropdown menu is the heart of the MTF feature. Here, you select the higher timeframe you want to analyse (e.g., 1D for Daily, 1W for Weekly, 4H for 4-Hour). All calculations for the three pairs within this group will be based on the timeframe you select here.
3. Pair-Specific Controls
Inside each timeframe group, there are three sections for "Pair 1", "Pair 2", and "Pair 3". These control each individual moving average cloud.
Enable Pair: Just like the master switch for the timeframe, this checkbox turns a single cloud and its two MA lines on or off.
For each pair, the settings are further broken down:
Moving Average Lines (A and B): These two rows control the two moving averages that form the cloud. 'A' is typically used for the shorter-period MA and 'B' for the longer-period one.
Type (A/B): A dropdown menu to select either EMA (Exponential Moving Average) or SMA (Simple Moving Average). EMAs react more quickly to recent price changes, while SMAs are smoother and react more slowly.
Length (A/B): The lookback period for the moving average (e.g., 21, 50, 200).
Color (A/B): Sets the specific colour of the MA line itself on your chart.
Cloud Fill Settings
Fill Color: This controls the colour of the shaded area (the "cloud") between the two moving average lines. For a consistent look, you can set this to the same colour as your shorter MA line.
Transparency: Controls how see-through the cloud is, on a scale of 0 to 100. 0 is a solid, opaque colour, while 100 is completely invisible. The default of 85 provides a light, "cloud-like" appearance that doesn't obscure the price action.
----------------------------------------------------------------------
If anything is not clear please let me know!

Chart Patterns (PRO) [ActiveQuants]Unlock the full potential of chart pattern trading with Chart Patterns (PRO) ! This advanced indicator goes beyond basic detection, offering a comprehensive suite of tools for serious traders. Automatically identify an extensive range of reversal and continuation patterns, complete with projected price targets , visually appealing pattern fills , and a sophisticated multi-status alert system .
How It Works
The indicator employs a sophisticated multi-stage process:
Precision Pivot Detection: At its heart, the indicator identifies significant swing highs and lows (pivot points) using an optimized internal period. These pivots are the fundamental building blocks for all pattern recognition. ( Users can toggle visibility of these pivots ).
Advanced Pattern Recognition Engine: Sequences of these pivot points are meticulously analyzed against a vast library of predefined geometric conditions to identify chart patterns. This includes checks for relative pivot heights/lows, slope analysis of trendlines, and ATR-based proportionality for patterns like Head & Shoulders.
Dynamic Status Tracking & Invalidation:
- Active: A pattern's initial structure is identified (e.g., two tops of a Double Top, or the converging trendlines of a Pennant). The pattern is developing.
- Confirmed: The pattern completes, and price breaks out/down from a key level (e.g., neckline, trendline) in the expected direction. Price targets are plotted upon confirmation.
- Invalidated: If price breaks out/down in the opposite direction of what's expected for an "Active" pattern, or if a new pivot forms that structurally compromises an "Active" Double Top/Bottom or Head & Shoulders before its confirmation, the pattern is marked "Invalid".
Price Target Projection: For confirmed patterns (excluding simple HH/LL structures), the indicator automatically calculates and plots potential price targets based on common technical analysis principles (e.g., pattern height projected from the breakout point).
█ DETECTED CHART PATTERNS
Chart Patterns (PRO) identifies a comprehensive list of 20 patterns, categorized for clarity:
I. Simple Market Structures:
Lower Low (LL): Indicates bearish pressure, potentially forming part of a larger downtrend.
Lower Low & Lower High (LL & LH): Stronger confirmation of a bearish trend.
Higher High (HH): Signals bullish strength, potentially part of an uptrend.
Higher High & Higher Low (HH & HL): Stronger confirmation of a bullish trend.
II. Reversal Patterns:
These patterns typically signal a potential end of the current trend and the beginning of a new one in the opposite direction.
Double Top (DT): Bearish reversal. Two distinct peaks at similar levels.
Double Bottom (DB): Bullish reversal. Two distinct troughs at similar levels.
Head and Shoulders (H&S): Bearish reversal. A central peak (head) flanked by two smaller peaks (shoulders).
Inverse Head and Shoulders (Inv H&S): Bullish reversal. A central trough (head) flanked by two smaller troughs (shoulders).
Rising Wedge From Uptrend (RW From UT): Bearish reversal. Converging trendlines with an upward slant during an uptrend.
Falling Wedge From Downtrend (FW From DT): Bullish reversal. Converging trendlines with a downward slant during a downtrend.
Bearish Ascending Triangle (Reversal): Bearish reversal. A horizontal resistance line with rising support, typically occurring after a downtrend.
Bullish Descending Triangle (Reversal): Bullish reversal. A horizontal support line with falling resistance, typically occurring after an uptrend.
III. Continuation Patterns:
These patterns typically suggest a temporary pause in the prevailing trend, after which the trend is likely to resume.
Rising Wedge From Downtrend (RW From DT): Bearish continuation. An upward-slanted consolidation during a downtrend.
Falling Wedge From Uptrend (FW From UT): Bullish continuation. A downward-slanted consolidation during an uptrend.
Bearish Pennant: Bearish continuation. A small symmetrical triangle (converging trendlines) after a sharp downward move.
Bullish Pennant: Bullish continuation. A small symmetrical triangle (converging trendlines) after a sharp upward move.
Bearish Flag: Bearish continuation. A short, rectangular consolidation (parallel trendlines, often upward sloping) after a sharp downward move.
Bullish Flag: Bullish continuation. A short, rectangular consolidation (parallel trendlines, often downward sloping) after a sharp upward move.
Bearish Descending Triangle: Bearish continuation. Horizontal support and a descending resistance line during a downtrend.
Bullish Ascending Triangle: Bullish continuation. Horizontal resistance and an ascending support line during an uptrend.
█ KEY FEATURES
- Automatic Price Target Projection:
Once a pattern is "Confirmed," a price target is automatically plotted on the chart.
Targets are calculated based on established technical methods, typically measuring the height of the pattern and projecting it from the breakout point.
Includes a label displaying the target price level. Toggle with Show Price Targets .
- Advanced Multi-Status Alerts:
Never miss an opportunity with highly configurable alerts.
Receive notifications when a pattern is:
- Developing (Active): Get an early heads-up.
- Confirmed: Act on breakout signals.
- Invalidated: Re-assess your strategy quickly.
Alerts automatically include the pattern type and its status (e.g., "Double Top - Confirmed ✅").
Additional contextual information included by default: Ticker Symbol, Chart Timeframe, Current Price, and Projected Target Price (for confirmed patterns).
Enable/disable all alerts via the Enable Alerts setting.
- Comprehensive Pattern Validation & Invalidation:
Patterns like Wedges, Triangles, Pennants, and Flags are monitored for breakouts. A breakout in the expected direction confirms the pattern; a breakout in the opposite direction invalidates it.
Double Tops/Bottoms and Head & Shoulders have pre-confirmation invalidation logic: if a new pivot forms that compromises the pattern's structure before the neckline breaks, the pattern is marked "Invalid". This helps filter out weaker setups.
ATR is used internally for proportional checks in patterns like Head & Shoulders, ensuring more reliable formations.
- Superior Visualizations:
Pattern Fills: Wedges, Triangles, Pennants, and Flags are visually enhanced with a semi-transparent fill between their trendlines, making them easy to spot.
Clear Necklines & Trendlines: Critical lines for patterns are drawn clearly.
Distinct Labels: Each pattern receives a main label (e.g., "H&S", "BullP"). Double Tops/Bottoms and H&S also get individual component labels (Top 1/2, Shoulder 1/Head/Shoulder 2).
Customizable Colors: Set distinct colors for bullish and bearish patterns.
- Pattern Display Control:
Toggle visibility for each of the 20 individual pattern types.
Filter displayed patterns by their status: All , Active , Confirmed , or Invalid .
Control historical depth with Show Last History (Bars) .
- Pivot Point Engine:
The indicator uses an optimized internal lookback period for robust pivot detection.
Optionally display these pivot high and low markers on your chart, with customizable colors.
█ USER INPUTS
Visibility and Common Styling
- Show Last History (Bars):
Number of recent bars the indicator will analyze and plot patterns on.
Default: 3000. Min: 10.
- Patterns (Visibility Filter):
Filters displayed patterns based on their status.
Options: All, Active, Confirmed, Invalid.
Default: All.
- Show Price Targets:
Toggles the display of calculated price targets for confirmed patterns.
Default: Enabled.
- Bearish Color:
Sets the color for bearish patterns and their components.
Default: Red.
- Bullish Color:
Sets the color for bullish patterns and their components.
Default: Green.
Pivot Points
- Show Pivot Highs:
Toggles the visibility of detected pivot high markers.
Default: Enabled.
- Show Pivot Lows:
Toggles the visibility of detected pivot low markers.
Default: Enabled.
- Pivot Highs Color:
Color for pivot high markers.
Default: #ff5252 (Reddish).
- Pivot Lows Color:
Color for pivot low markers.
Default: #089981 (Greenish).
Pattern Toggles (Grouped by Type)
- Simple Structures:
Lower Low (Default: Enabled)
Lower Low & Lower High (Default: Enabled)
Higher High (Default: Enabled)
Higher High & Higher Low (Default: Enabled)
- Reversal Patterns:
Double Tops (Default: Enabled)
Double Bottoms (Default: Enabled)
Head and Shoulders (Default: Enabled)
Inverse Head and Shoulders (Default: Enabled)
Rising Wedges From Uptrend (Default: Enabled)
Falling Wedges From Downtrend (Default: Enabled)
Bearish Ascending Triangles (Reversal context) (Default: Enabled)
Bullish Descending Triangles (Reversal context) (Default: Enabled)
- Continuation Patterns:
Rising Wedges From Downtrend (Default: Enabled)
Falling Wedges From Uptrend (Default: Enabled)
Bearish Pennants (Default: Enabled)
Bullish Pennants (Default: Enabled)
Bearish Flags (Default: Enabled)
Bullish Flags (Default: Enabled)
Bearish Descending Triangles (Continuation context) (Default: Enabled)
Bullish Ascending Triangles (Continuation context) (Default: Enabled)
Alerts
- Enable Alerts:
Master switch to enable or disable all alert notifications from this indicator.
Default: Enabled. ( Alert messages are pre-configured to include Pattern Type, Status, Symbol, Timeframe, Price, and Target Price when applicable and confirmed ).
█ UNDERSTANDING PATTERN INVALIDATION
Trendline Patterns (Wedges, Triangles, Pennants, Flags): An "Active" pattern is invalidated if price breaks its trendlines in the direction opposite to the expected breakout before a confirmation occurs. E.g., an Active Bullish Pennant is invalidated if price breaks below its lower trendline.
Neckline Patterns (Double Tops/Bottoms, H&S): An "Active" pattern can be invalidated before a neckline break if a new pivot point forms that violates the pattern's structural integrity.
Example (Double Top): If Top 1, Neckline (P5), and Top 2 form (Active status), but before price breaks below P5, a new swing low forms at or above P5, the Double Top is invalidated. This indicates a failure to break support and potential renewed strength.
█ ALERTS GUIDE
Add the " Chart Patterns (PRO) " indicator to your chart.
Ensure Enable Alerts is checked in the indicator settings.
In TradingView, click the "Alert" icon (clock) in the right toolbar or press ALT + A .
In the "Create Alert" dialog:
- Condition: Select " Chart Patterns (PRO) ".
- For the condition dropdown below it, choose " Any alert() function call ". This will trigger for any alert generated by the script.
- Interval: Choose whatever interval you want the alert to be triggered.
- Expiration: Choose the expiration date.
Customize your alert notification preferences (popup, email, webhook, etc.) and click " Create ".
You will now receive alerts for pattern status changes (Developing, Confirmed, Invalidated) with detailed information.
█ CONCLUSION
The Chart Patterns (PRO) indicator is an indispensable tool for traders aiming to optimize their workflow. By automatically identifying and drawing classical chart patterns, it eliminates the need for manual chart analysis, thereby enabling users to dedicate substantially less time to chart monitoring. Its comprehensive detection, coupled with actionable insights like price targets and a meticulous status tracking system with alerts, provides a significant analytical edge. Automate your pattern recognition and drawing, and concentrate on making informed trading decisions with enhanced efficiency.
█ IMPORTANT NOTES
⚠ Confirmation is Crucial: While "Active" patterns provide early warnings, always await "Confirmed" status (e.g., neckline/trendline breaks) and consider volume and broader market context.
⚠ Non-Repainting Logic: Pattern detection and status updates are based on confirmed price bars and pivot points. Once a pattern is fully formed and its status set (Active, Confirmed, Invalid), it will not repaint its historical state. Initial drawing of "Active" patterns extends to the current bar and updates dynamically.
⚠ Combine with Other Tools: No indicator is a standalone solution. Use Chart Patterns (PRO) in conjunction with other forms of analysis (e.g., fundamental analysis, other indicators, volume analysis) and robust risk management .
⚠ Historical Data: Ensure sufficient historical data on your chart for patterns to form and be detected accurately. The Show Last History (Bars) setting can manage this.
⚠ Lagging Nature: By their very definition, chart patterns are lagging indicators as they require a sequence of price action and several pivot points to complete their formation.
█ RISK DISCLAIMER
Trading involves substantial risk of loss and is not suitable for all investors. The Chart Patterns (PRO) indicator and its generated information are for educational and informational purposes only. It does not constitute financial advice or a recommendation to buy or sell any security. Chart patterns and projected targets indicate potential price movements based on historical tendencies but do not guarantee future results. Always conduct your own due diligence, consider multiple factors, and consult with a qualified financial advisor before making investment decisions. Past performance is not indicative of future results.
📈 Happy trading! 🚀
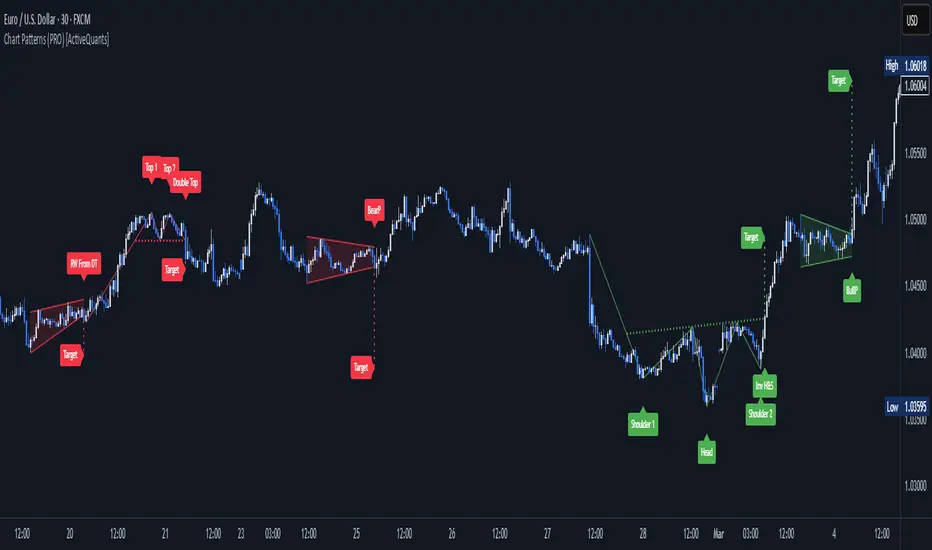
Chart Patterns [ActiveQuants]The Chart Patterns indicator is a comprehensive tool designed to automatically identify a variety of common chart patterns directly on your price chart. By detecting sequences of pivot highs and lows , this indicator helps traders spot potential trend continuations , reversals , and key market structures such as Double Tops and Double Bottoms . Enhance your technical analysis by quickly recognizing these formations as they emerge.
How It Works
The indicator operates in a two-stage process:
Pivot Point Detection: It first identifies significant swing highs and swing lows (pivot points) based on a user-defined Period . These pivots form the fundamental building blocks for pattern recognition.
Pattern Recognition: Using the sequence of these detected pivot points, the script then applies logical rules to identify the following patterns:
Lower Low (LL)
Lower Low & Lower High (LL & LH)
Higher High (HH)
Higher High & Higher Low (HH & HL)
Double Tops
Double Bottoms
Patterns are drawn on the chart with connecting lines and labeled for easy identification. Double Tops and Double Bottoms also feature a status system: " Active " while forming, " Confirmed " upon neckline breakout, or " Invalid " if specific conditions negate the pattern before confirmation.
█ KEY FEATURES
Comprehensive Pattern Detection: Identifies six distinct types of chart patterns, offering insights into both trend continuation and potential reversals.
Pivot-Based Analysis: Uses a robust method of identifying pivot highs and lows as the foundation for pattern formation.
Pattern Status for Double Tops/Bottoms:
- Active: A Double Top or Double Bottom pattern has formed its two peaks/troughs and the intervening neckline point, but the price has not yet broken beyond the neckline. The pattern is developing .
- Confirmed: The price has decisively closed beyond the neckline (below for Double Top, above for Double Bottom), signaling a potential entry or validation of the pattern.
- Invalid: An " Active " Double Top or Double Bottom pattern can be invalidated if, before a neckline breakout occurs, a new pivot point forms that negates the pattern’s structural integrity. For example, if a new pivot low forms above or at the neckline of an Active Double Top, the pattern is considered invalid because the market failed to break down and instead showed relative strength.
Customizable Visuals: Allows users to define colors for bullish and bearish patterns, line widths, and the visibility of pivot points.
Selective Pattern Display: Users can choose to display all patterns or filter by status (Active, Confirmed, Invalid) for Double Tops/Bottoms. Individual pattern types can also be toggled on or off.
Historical Analysis Control: The Show Last History (Bars) input allows users to specify how far back the indicator should plot patterns, optimizing performance and chart readability.
Clear Labeling: Patterns are clearly labeled on the chart, with Double Tops/Bottoms also showing " Top 1 ," " Top 2 ," or " Bottom 1 ," " Bottom 2 " labels.
█ PATTERNS DETECTED
Lower Low (LL): Indicates a potential bearish continuation or the start of a downtrend. Forms when price makes a lower low during an uptrend.
Lower Low & Lower High (LL & LH): A stronger confirmation of a bearish trend, where the market forms a lower low followed by a lower high .
Higher High (HH): Signals a potential bullish continuation or the start of an uptrend. Forms when price makes a higher high during a downtrend.
Higher High & Higher Low (HH & HL): A stronger confirmation of a bullish trend, where the market forms a higher high followed by a higher low .
Double Top: A bearish reversal pattern characterized by two distinct peaks at roughly the same price level, separated by a trough (neckline). Confirmation occurs when price breaks below the neckline.
Double Bottom: A bullish reversal pattern featuring two distinct troughs at roughly the same price level, separated by a peak (neckline). Confirmation occurs when price breaks above the neckline.
█ EXAMPLE: DOUBLE TOP INVALIDATION
Understanding how a Double Top or Double Bottom can be invalidated is crucial. Here's an example for a Double Top:
Formation: The indicator identifies two peaks (Top 1, Top 2) at a similar price level, with a corrective trough (Neckline Pivot P5) in between. The pattern is labeled " Double Top " and is in an " Active " state. ( Imagine points P4 and P6 are the two tops, and P5 is the low point of the neckline between them ).
Pre-Breakout Condition: The price action continues, but before it breaks decisively below the P5 neckline level, a new significant swing low (a new pivot low) forms.
Invalidation Check: The indicator checks the price level of this new pivot low. If this new pivot low occurs at a price equal to or higher than the P5 neckline level, the " Active " Double Top pattern is re-labeled as " Invalid Double Top ". ( See image below for a visual representation of this scenario )
In this example, the Double Top formed with Top 1 (P4) and Top 2 (P6). The neckline is at P5. Before price broke below P5, a new pivot low formed at the red circle. Since this new pivot low is above the P5 neckline, the Double Top is marked " Invalid ".
The logic is that the market failed to break the neckline support and instead established a higher low (or a low at the support level), suggesting that the immediate bearish pressure has waned, thus invalidating the bearish reversal implication of the Double Top before it could confirm. A similar logic applies to Double Bottoms (a new pivot high forming below or at the neckline before an upside breakout).
█ USER INPUTS
Visibility and Common Styling
- Show Last History (Bars):
Specifies the number of recent bars the indicator will analyze and plot patterns on.
Default: 3000 bars. Min: 10.
- Patterns:
Filters which patterns are displayed based on their status.
Options: All, Active, Confirmed, Invalid.
Default: All.
- Pattern Line Width:
Sets the thickness of the lines used to draw the patterns.
Default: 1. Min: 1, Max: 10.
- Bearish Color:
Color for bearish patterns (LL, LL & LH, Double Tops).
Default: Red.
- Bullish Color:
Color for bullish patterns (HH, HH & HL, Double Bottoms).
Default: Green.
Pivot Points
- Period:
The lookback period on either side of a bar to qualify it as a pivot high or low. Higher values detect more significant pivots.
Default: 10 bars. Min: 2.
- Show Pivot Highs:
Toggles the visibility of detected pivot high markers.
Default: Enabled.
- Show Pivot Lows:
Toggles the visibility of detected pivot low markers.
Default: Enabled.
- Pivot Highs Color:
Color for the pivot high markers.
Default: #ff5252 (Reddish).
- Pivot Lows Color:
Color for the pivot low markers.
Default: #089981 (Greenish).
Patterns (Toggles)
- Lower Low:
Enable/disable detection and display of Lower Low patterns.
Default: Enabled.
- Lower Low & Lower High:
Enable/disable detection and display of Lower Low & Lower High patterns.
Default: Enabled.
- Higher High:
Enable/disable detection and display of Higher High patterns.
Default: Enabled.
- Higher High & Higher Low:
Enable/disable detection and display of Higher High & Higher Low patterns.
Default: Enabled.
- Double Tops:
Enable/disable detection and display of Double Top patterns.
Default: Enabled.
- Double Bottoms:
Enable/disable detection and display of Double Bottom patterns.
Default: Enabled.
█ CONCLUSION
The Chart Patterns indicator is a versatile and powerful assistant for traders who utilize classical chart pattern analysis. By automating the detection of key formations and providing clear visual cues along with status updates for patterns like Double Tops and Bottoms, it allows traders to focus on strategy development and execution. With its customizable settings, it can be adapted to various instruments and timeframes, making it a valuable addition to any technical trader's toolkit.
█ IMPORTANT NOTES
⚠ Pivot Period Sensitivity: The Period setting for pivot detection is crucial. A shorter period will identify more frequent, smaller swings, while a longer period will focus on more significant turning points. Adjust this setting based on the asset's volatility, the timeframe you are trading and your trading style.
⚠ Confirmation is Key: While the indicator identifies patterns, always wait for pattern confirmation (e.g., neckline breaks for Double Tops/Bottoms) and consider other factors like volume and market context before making trading decisions.
⚠ Confirmed Bars for Detection: Patterns are identified based on confirmed pivot points, which means a pivot is recognized period bars after it has formed. Status updates for Double Tops/Bottoms (Active, Confirmed, Invalid) also occur on confirmed bars. This approach enhances reliability and reduces the likelihood of repainting based on intra-bar price fluctuations.
⚠ Not a Standalone System: Chart patterns provide valuable insights, but they should be used in conjunction with other technical analysis tools (e.g., trendlines, moving averages, oscillators) and a sound risk management plan.
⚠ Lagging Nature: By their very definition, chart patterns are lagging indicators as they require a sequence of price action and several pivot points to complete their formation.
█ RISK DISCLAIMER
Trading involves a substantial risk of loss and is not suitable for every investor. The information provided by the Chart Patterns indicator is for educational and informational purposes only. It should not be considered as financial advice or a recommendation to buy or sell any security. Chart patterns indicate potential price movements but do not guarantee future results. Always perform your own due diligence and consult with a qualified financial advisor before making any investment decisions. Past performance is not indicative of future results.
📈 Happy trading! 🚀

Future Candle Reversal Projection (Mastersinnifty)Overview
This tool identifies potential future market reversal zones by dynamically projecting pivot-based swing patterns forward in time. Unlike traditional ZigZag indicators that only reflect past movements, this indicator anticipates probable future turning points based on historical swing periodicity.
---
Key Features
- Forward Projections: Calculates and projects future swing zones based on detected pivot distances.
- Customizable Detection: Adjust the ZigZag depth for different trading styles (scalping, swing, position).
- Dynamic Updates: Real-time recalibration as new pivots form.
- Clean Visual Markers: Projects reversal estimates as intuitive labels and dotted lines.
---
How it Works
The indicator identifies significant swing highs and lows using a user-defined ZigZag depth setting. It measures the time (bars) and price characteristics of the latest swing movement. Using this pattern, it projects forward estimated reversal points at consistent intervals. Midpoint price levels between the last high and low are used for each future projection.
---
Who Can Benefit
- Intraday and swing traders seeking advanced planning zones.
- Technical analysts relying on pattern periodicity.
- Traders who wish to combine projected reversal markers with their own risk management strategies.
---
Disclaimer
This tool is an analytical and educational utility. It does not predict markets with certainty. Always combine it with your own analysis and risk management. Past behavior does not guarantee future results.

Liquidity Fracture DetectorThe Liquidity Fracture Detector is an advanced tool designed to identify micro-liquidity traps and structural fakeouts on intraday charts. These occur when the market appears to break out, only to quickly reverse — often triggered by stop hunts, inefficient fills, or manipulated order flow.
The script combines volume spikes, volatility anomalies, and price structure breaks to signal "fractures" — points where the market temporarily breaks its behavior, often followed by strong reversals or trend accelerations.
Detection logic in the script:
Volume spike greater than 2x the average (adjustable)
Volatility spike: candle range is > 1.5x the average
Extreme wicks: wick is larger than the candle body (a classic trap signal)
Structure break: price breaks previous high/low but closes back within the old range
Combine these elements → a “fracture” is marked
Visual representation:
Red background = potential bull trap (fake breakout to the upside)
Green background = potential bear trap (fake breakdown to the downside)
A label appears at each fracture: “Echo” with the number of previous hits
Ideal use cases:
Intraday trading (1m, 5m, 15m)
Crypto, indices, futures, and forex
Detecting reactive zones where the market takes a false direction
Confluence with S/R zones, order blocks, or liquidity pools
Fully customizable:
Volume and range sensitivity
Heatmap intensity
Toggle labels on/off
Note:
This script is intended to support discretionary analysis. It does not provide buy or sell signals and is not an automated strategy. Combine it with your own price action or order flow setup for optimal results.

CISD [TradeWithRon]The CISD (Change in State of Delivery) indicator helps traders identify significant price action events by tracking liquidity sweeps and CISD events. It highlights key market structure shifts by marking liquidity levels and failed breakouts, offering insights into potential reversals and breakout confirmations.
Features:
CISD Detection: Identifies high and low CISD events with customizable display settings.
Customizable Display: Users can control how many CISD lines and liquidity lines are shown.
Customization:
- Adjust the number of CISD and liquidity lines displayed.
- Modify the swing length and back-checking period for greater flexibility.
- Choose different colors and line styles to match your charting preferences.
Use Cases:
- Spot traps and reversals.
- Identify breakout confirmations.
- Enhance market structure analysis.
- Combine with other technical indicators for improved decision-making.
🔶 Disclaimer
Use with Caution: This indicator is provided for educational and informational purposes only and should not be considered as financial advice. Users should exercise caution and perform their own analysis before making trading decisions based on the indicator's signals.
Not Financial Advice: The information provided by this indicator does not constitute financial advice, and the creator (Tradewithron) shall not be held responsible for any trading losses incurred as a result of using this indicator.
Backtesting Recommended: Traders are encouraged to backtest the indicator thoroughly on historical data before using it in live trading to assess its performance and suitability for their trading strategies.
Risk Management: Trading involves inherent risks, and users should implement proper risk management strategies, including but not limited to stop-loss orders and position sizing, to mitigate potential losses.
No Guarantees: The accuracy and reliability of the indicator's signals cannot be guaranteed, as they are based on historical price data and past performance may not be indicative of future
Sentiment OscillatorIn the complex world of trading, understanding market sentiment can be like reading the emotional pulse of financial markets. Our Sentiment Oscillator is designed to be your personal market mood translator, helping you navigate through the noise of price movements and market fluctuations.
Imagine having a sophisticated tool that goes beyond traditional price charts, diving deep into the underlying dynamics of market behavior. This indicator doesn't just show you numbers – it tells you a story about market sentiment, combining multiple financial signals to give you a comprehensive view of potential market directions.
The Sentiment Oscillator acts like a sophisticated emotional barometer for stocks, cryptocurrencies, or any tradable asset. It analyzes price changes, market volatility, trading volume, and long-term trends to generate a unique sentiment score. This score ranges from highly bullish to deeply bearish, providing traders with an intuitive visual representation of market mood.
Green zones indicate positive market sentiment, suggesting potential buying opportunities. Red zones signal caution, hinting at possible downward trends. The oscillator's gray neutral zone helps you identify periods of market uncertainty, allowing for more calculated trading decisions.
What sets this indicator apart is its ability to blend multiple market factors into a single, easy-to-understand indicator. It's not just about current price – it's about understanding the deeper currents moving beneath the surface of market prices.
Traders can use this oscillator to:
- Identify potential trend reversals
- Understand market sentiment beyond price movement
- Spot periods of market strength or weakness
- Complement other technical analysis tools
Whether you're a day trader, swing trader, or long-term investor, the Sentiment Oscillator provides an additional layer of insight to support your trading strategy. Remember, no indicator is a crystal ball, but this tool can help you make more informed decisions in the dynamic world of trading.

EZ_Algo Copyright label
This script overlays a fully adjustable watermark on your chart, featuring:
A bold Main Title (e.g., your brand or name) and Subtitle (e.g., a tagline or ID).
Optional extras like a copyright notice, logo symbol, warning message, and chart info (symbol, timeframe, timestamp, or close price).
A subtle repeating overlay pattern to deter theft.
Flexible positioning, sizing, and color options to match your vib
e
It’s built for traders who want to protect their charts and make them stand out, all in a few clicks.
How to Use It
Add to Chart: Click "Add to Chart" and watch the default watermark appear (e.g., "EZ ALGO" at the top).
Customize It:
Main Title: Set your brand (e.g., "EZ ALGO") under "Main Title". Tweak color, size, and alignment.
Subtitle: Add a tagline (e.g., "Algo Trading") and trader ID (e.g., "@EZ_Algo
") with matching style options.
Text Opacity: Adjust "Text Opacity" in "Appearance" to control title and subtitle transparency (0 = solid, 100 = invisible).
Chart Info: Toggle "Show Chart Info" to display symbol and timestamp, or add "Show Close Price" for extra data.
Extras: Enable "Show Copyright" for a © notice, "Show Logo" for a symbol (e.g., ★), or "Show Warning" to shout "DO NOT COPY".
Overlay Pattern: Turn on "Show Overlay Pattern" to repeat a phrase (e.g., "EZ Algo") across the chart.
Positioning: Pick vertical/horizontal spots (top, middle, bottom; left, center, right) or try "Randomize Main Position" for a surprise placement.
Appearance: Set a "Background Color" and "Background Opacity" for the watermark’s backdrop.
Cell Size: Adjust "Cell Width (%)" and "Cell Height (%)" to resize the watermark (0 = auto-fit).
Apply & Share: Hit "OK" to save settings, then screenshot or share your branded chart with confidence!
Tips
Use a semi-transparent background (e.g., 50 opacity) to keep the chart readable.
Experiment with "Randomize Main Position" for a dynamic look.
Pair a bold logo with a faint overlay pattern for max branding power.
Credits
Inspired by @KristaKT
thanks for the great ideas!
Enjoy marking your charts with flair and protection! Questions? Drop a comment below.

Multi-Timeframe Parabolic SAR Strategy ver 1.0Multi-Timeframe Parabolic SAR Strategy (MTF PSAR) - Enhanced Trend Trading
This strategy leverages the power of the Parabolic SAR (Stop and Reverse) indicator across multiple timeframes to provide robust trend identification, precise entry/exit signals, and dynamic trailing stop management. By combining the insights of both the current chart's timeframe and a user-defined higher timeframe, this strategy aims to improve trading accuracy, reduce risk, and capture more significant market moves.
Key Features:
Dual Timeframe Analysis: Simultaneously analyzes the Parabolic SAR on the current chart and a higher timeframe (e.g., Daily PSAR on a 1-hour chart). This allows you to align your trades with the dominant trend and filter out noise from lower timeframes.
Configurable PSAR: Fine-tune the PSAR calculation with adjustable Start, Increment, and Maximum values to optimize sensitivity for your trading style and the asset's volatility.
Independent Timeframe Control: Choose to display and trade based on either or both the current timeframe PSAR and the higher timeframe PSAR. Focus on the most relevant information for your analysis.
Clear Visual Signals: Distinct colors for the current and higher timeframe PSAR dots provide a clear visual representation of potential entry and exit points.
Multiple Entry Strategies: The strategy offers flexible entry conditions, allowing you to trade based on:
Confirmation: Both current and higher timeframe PSAR signals agree and the current timeframe PSAR has just flipped direction. (Most conservative)
Current Timeframe Only: Trades based solely on the current timeframe PSAR, ideal for when the higher timeframe is less relevant or disabled.
Higher Timeframe Only: Trades based solely on the higher timeframe PSAR.
Dynamic Trailing Stop (PSAR-Based): Implements a trailing stop-loss based on the current timeframe's Parabolic SAR. This helps protect profits by automatically adjusting the stop-loss as the price moves in your favor. Exits are triggered when either the current or HTF PSAR flips.
No Repainting: Uses lookahead=barmerge.lookahead_off in the security() function to ensure that the higher timeframe data is accessed without any data leakage, preventing repainting issues.
Fully Configurable: All parameters (PSAR settings, higher timeframe, visibility, colors) are adjustable through the strategy's settings panel, allowing for extensive customization and optimization.
Suitable for Various Trading Styles: Applicable to swing trading, day trading, and trend-following strategies across various markets (stocks, forex, cryptocurrencies, etc.).
How it Works:
PSAR Calculation: The strategy calculates the standard Parabolic SAR for both the current chart's timeframe and the selected higher timeframe.
Trend Identification: The direction of the PSAR (dots below price = uptrend, dots above price = downtrend) determines the current trend for each timeframe.
Entry Signals: The strategy generates buy/sell signals based on the chosen entry strategy (Confirmation, Current Timeframe Only, or Higher Timeframe Only). The Confirmation strategy offers the highest probability signals by requiring agreement between both timeframes.
Trailing Stop Exit: Once a position is entered, the strategy uses the current timeframe PSAR as a dynamic trailing stop. The stop-loss is automatically adjusted as the PSAR dots move, helping to lock in profits and limit losses. The strategy exits when either the Current or HTF PSAR changes direction.
Backtesting and Optimization: The strategy automatically backtests on the chart's historical data, allowing you to evaluate its performance and optimize the settings for different assets and timeframes.
Example Use Cases:
Trend Confirmation: A trader on a 1-hour chart observes a bullish PSAR flip on the current timeframe. They check the MTF PSAR strategy and see that the Daily PSAR is also bullish, confirming the strength of the uptrend and providing a high-probability long entry signal.
Filtering Noise: A trader on a 5-minute chart wants to avoid whipsaws caused by short-term price fluctuations. They use the strategy with a 1-hour higher timeframe to filter out noise and only trade in the direction of the dominant trend.
Dynamic Risk Management: A trader enters a long position and uses the current timeframe PSAR as a trailing stop. As the price rises, the PSAR dots move upwards, automatically raising the stop-loss and protecting profits. The trade is exited when the current (or HTF) PSAR flips to bearish.
Disclaimer:
The Parabolic SAR is a lagging indicator and can produce false signals, particularly in ranging or choppy markets. This strategy is intended for educational and informational purposes only and should not be considered financial advice. It is essential to backtest and optimize the strategy thoroughly, use it in conjunction with other technical analysis tools, and implement sound risk management practices before using it with real capital. Past performance is not indicative of future results. Always conduct your own due diligence and consider your risk tolerance before making any trading decisions.

Multi-Timeframe PSAR Indicator ver 1.0Enhance your trend analysis with the Multi-Timeframe Parabolic SAR (MTF PSAR) indicator! This powerful tool displays the Parabolic SAR (Stop and Reverse) from both the current chart's timeframe and a higher timeframe, all in one convenient view. Identify potential trend reversals and set dynamic trailing stops with greater confidence by understanding the broader market context.
Key Features:
Dual Timeframe Analysis: Simultaneously visualize the PSAR on your current chart and a user-defined higher timeframe (e.g., see the Daily PSAR while trading on the 1-hour chart). This helps you align your trades with the dominant trend.
Customizable PSAR Settings: Fine-tune the PSAR calculation with adjustable Start, Increment, and Maximum values. Optimize the indicator's sensitivity to match your trading style and the volatility of the asset.
Independent Timeframe Control: Choose to display either or both the current timeframe PSAR and the higher timeframe PSAR. Focus on the information most relevant to your analysis.
Clear Visual Representation: Distinct colors for the current and higher timeframe PSAR dots make it easy to differentiate between the two. Quickly identify potential entry and exit points.
Configurable Colors You can easily change colors of Current and HTF PSAR.
Standard PSAR Logic: Uses the classic Parabolic SAR algorithm, providing a reliable and widely-understood trend-following indicator.
lookahead=barmerge.lookahead_off used in the security function, there is no data leak or repainting.
Benefits:
Improved Trend Identification: Spot potential trend changes earlier by observing divergences between the current and higher timeframe PSAR.
Enhanced Risk Management: Use the PSAR as a dynamic trailing stop-loss to protect profits and limit potential losses.
Greater Trading Confidence: Make more informed decisions by considering the broader market trend.
Reduced Chart Clutter: Avoid the need to switch between multiple charts to analyze different timeframes.
Versatile Application: Suitable for various trading styles (swing trading, day trading, trend following) and markets (stocks, forex, crypto, etc.).
How to Use:
Add to Chart: Add the "Multi-Timeframe PSAR" indicator to your TradingView chart.
Configure Settings:
PSAR Settings: Adjust the Start, Increment, and Maximum values to control the PSAR's sensitivity.
Multi-Timeframe Settings: Select the desired "Higher Timeframe PSAR" resolution (e.g., "D" for Daily). Enable or disable the display of the current and/or higher timeframe PSAR using the checkboxes.
Interpret Signals:
Current Timeframe PSAR: Dots below the price suggest an uptrend; dots above the price suggest a downtrend.
Higher Timeframe PSAR: Provides context for the overall trend. Agreement between the current and higher timeframe PSAR strengthens the trend signal. Divergences may indicate potential reversals.
Trade Management:
Use PSAR dots as dynamic trailing stop.
Example Use Cases:
Confirming Trend Strength: A trader on a 1-hour chart sees the 1-hour PSAR flip bullish (dots below the price). They check the MTF PSAR and see that the Daily PSAR is also bullish, confirming the strength of the uptrend.
Identifying Potential Reversals: A trader sees the current timeframe PSAR flip bearish, but the higher timeframe PSAR remains bullish. This divergence could signal a potential pullback within a larger uptrend, or a warning of a more significant reversal.
Trailing Stops: A trader enters a long position and uses the current timeframe PSAR as a trailing stop, moving their stop-loss up as the PSAR dots rise.
Disclaimer: The Parabolic SAR is a lagging indicator and may produce false signals, especially in ranging markets. It is recommended to use this indicator in conjunction with other technical analysis tools and risk management strategies. Past performance is not indicative of future results.

3 Drive Harmonic Pattern [TradingFinder] Three Drive Reversal🔵 Introduction
The Three Drive harmonic pattern closely resembles other price structures such as Wedge Pattern and Three Push Pattern, yet it stands out due to its precise use of Fibonacci ratios and symmetrical price movements.
This pattern comprises three consecutive and symmetrical price drives, each validated by key Fibonacci ratios (1.27 and 1.618), which help identify critical Potential Reversal Zones (PRZ).
Unlike the Wedge, which relies on converging trend lines and can indicate either continuation or reversal, and the Three Push, which lacks defined Fibonacci ratios and symmetry, the Three Drive pattern defines PRZ with greater accuracy, providing traders with high-probability trading opportunities.
This pattern appears in both bullish and bearish trends. After the completion of the third drive (Drive 3), it signals the market's readiness to reverse direction. The PRZ in this pattern serves as a crucial zone where price is highly likely to reverse, offering a strategic point for entering or exiting trades. Professional traders utilize the Three Drive pattern and PRZ as essential tools for analyzing and capitalizing on potential market reversals.
Bullish Pattern :
Bearish Pattern :
🔵 How to Use
The Three Drive harmonic pattern is an effective tool for identifying potential reversal points in the market. By utilizing Fibonacci extension levels (1.27 and 1.618) and focusing on the pattern’s symmetry, traders can pinpoint Potential Reversal Zones (PRZ) where the price is likely to change direction. This pattern works in both bearish and bullish scenarios, each with distinct characteristics and trading opportunities.
🟣 Bullish Three Drive Pattern
The bullish Three Drive pattern develops during a downtrend, indicating a potential reversal to the upside. Similar to its bearish counterpart, this pattern features three consecutive downward price movements (drives) with retracements in between. The third drive concludes within the PRZ, which serves as a strong support zone where the price is expected to reverse upwards.
The first drive begins with a downward movement, followed by a retracement to the 0.618 Fibonacci level. The second drive continues downward to reach a 1.27 or 1.618 Fibonacci extension of the retracement. Finally, the third drive aligns with the PRZ, where a confluence of Fibonacci levels creates a high-probability support zone.
In the PRZ, traders look for bullish confirmation signals such as bullish candlestick patterns (e.g., bullish engulfing or pin bars) or increasing trading volume. Once confirmation is observed, the PRZ becomes an ideal entry point for a buy position. Stop-loss orders are placed slightly below the PRZ to minimize risk, while take-profit targets are set at key resistance levels or Fibonacci retracement levels.
🟣 Bearish Three Drive Pattern
The bearish Three Drive pattern forms during an uptrend, signaling a potential reversal to the downside. This pattern consists of three consecutive upward price movements (drives) and intermediate retracements. Each drive aligns with Fibonacci extension levels, and the third drive ends within the PRZ, indicating a high probability of a bearish reversal.
In the first drive, the price moves upward and then retraces to approximately the 0.618 Fibonacci retracement level, forming the base for the second drive. The second drive then extends upward to the 1.27 or 1.618 Fibonacci extension of the preceding retracement. This process repeats for the third drive, which reaches the PRZ, typically defined by the convergence of Fibonacci levels from previous drives.
Once the PRZ is identified, traders look for confirmation signals such as bearish candlestick patterns (e.g., bearish engulfing or pin bars) or declining trading volume. If confirmation is present, the PRZ becomes an optimal zone for entering a sell position. Stop-loss levels are typically placed slightly above the PRZ to protect against pattern failure, and take-profit targets are set at key support levels or Fibonacci retracement levels of the overall structure.
🟣 Three Drive Vs Wedge Pattern Vs 3 Push pattern
The Three Drive, Wedge, and Three Push patterns are all used to identify potential price reversal points, but they differ significantly in structure and application. The Three Drive pattern is based on three consecutive and symmetrical price movements, validated by precise Fibonacci ratios (1.27 and 1.618), to define Potential Reversal Zones (PRZ).
In contrast, the Wedge pattern relies on converging trend lines and does not require Fibonacci ratios; it can act as either a reversal or continuation pattern. Meanwhile, the Three Push pattern shares similarities with Three Drive but lacks precise symmetry and Fibonacci-based validation.
Instead of a PRZ, Three Push focuses on identifying areas of support and resistance, often signaling weakening momentum in the current trend. Among these, the Three Drive pattern is more reliable for pinpointing high-probability reversal zones due to its strict Fibonacci-based and symmetrical structure.
🔵 Setting
🟣 Logical Setting
ZigZag Pivot Period : You can adjust the period so that the harmonic patterns are adjusted according to the pivot period you want. This factor is the most important parameter in pattern recognition.
Show Valid Format : If this parameter is on "On" mode, only patterns will be displayed that they have exact format and no noise can be seen in them. If "Off" is, the patterns displayed that maybe are noisy and do not exactly correspond to the original pattern.
Show Formation Last Pivot Confirm : if Turned on, you can see this ability of patterns when their last pivot is formed. If this feature is off, it will see the patterns as soon as they are formed. The advantage of this option being clear is less formation of fielded patterns, and it is accompanied by the latest pattern seeing and a sharp reduction in reward to risk.
Period of Formation Last Pivot : Using this parameter you can determine that the last pivot is based on Pivot period.
🟣 Genaral Setting
Show : Enter "On" to display the template and "Off" to not display the template.
Color : Enter the desired color to draw the pattern in this parameter.
LineWidth : You can enter the number 1 or numbers higher than one to adjust the thickness of the drawing lines. This number must be an integer and increases with increasing thickness.
LabelSize : You can adjust the size of the labels by using the "size.auto", "size.tiny", "size.smal", "size.normal", "size.large" or "size.huge" entries.
🟣 Alert Setting
Alert : On / Off
Message Frequency : This string parameter defines the announcement frequency. Choices include: "All" (activates the alert every time the function is called), "Once Per Bar" (activates the alert only on the first call within the bar), and "Once Per Bar Close" (the alert is activated only by a call at the last script execution of the real-time bar upon closing). The default setting is "Once per Bar".
Show Alert Time by Time Zone : The date, hour, and minute you receive in alert messages can be based on any time zone you choose. For example, if you want New York time, you should enter "UTC-4". This input is set to the time zone "UTC" by default.
🔵 Conclusion
The Three Drive pattern is a highly effective harmonic tool for identifying potential reversal points in the market. By leveraging its symmetrical structure and precise Fibonacci ratios (1.27 and 1.618), this pattern provides traders with clear entry and exit signals, enhancing the accuracy of their trades.
Whether in bullish or bearish scenarios, the identification of the Potential Reversal Zone (PRZ) serves as a critical aspect of this pattern, enabling traders to anticipate price movements with greater confidence.
Compared to similar patterns like Wedge and Three Push, the Three Drive pattern stands out for its stringent reliance on Fibonacci levels and symmetrical price movements, making it a more robust choice for forecasting reversals. However, as with any technical analysis tool, its effectiveness increases when combined with confirmation signals, such as candlestick patterns, volume analysis, and broader market context.
Mastering the Three Drive pattern requires practice and attention to detail, especially in accurately defining the PRZ and ensuring the pattern adheres to its criteria. Traders who consistently apply this pattern as part of a comprehensive trading strategy can capitalize on high-probability opportunities and improve their overall performance in the market.

Support/Resistance Strength [UAlgo]The Support/Resistance Strength indicator is a tool designed for traders seeking a precise understanding of key support and resistance levels in the market. This tool dynamically identifies and visualizes support and resistance zones based on pivot points and strength criteria, providing traders with actionable insights for better decision-making.
By incorporating features such as ATR-based or percentage-based channel calculations, customizable strength thresholds, and intuitive visualization of key levels, the indicator caters to traders of various skill levels and strategies. It also adapts dynamically to market conditions, allowing users to identify frequently tested zones with minimal manual input.
🔶 Key Features
Dynamic Support and Resistance Zones
Automatically detects significant support and resistance levels using pivot high and low calculations.
Offers ATR-based or percentage-based channel customization to cater to diverse trading styles.
Customizable Parameters
Lookback period for pivot calculations, strength threshold, and maximum stored pivots are fully adjustable.
Display options for showing specific numbers of recent support/resistance lines.
Intuitive Visualization
Highlights key support and resistance levels with color-coded lines and labels.
Includes percentage deviation from the current price for quick assessment.
Interactive Updates
Continuously updates support and resistance levels to reflect changing market dynamics.
Displays pivot points visually for enhanced clarity.
Can be used effectively on various timeframes, from intraday to daily and weekly charts.
🔶 Interpreting the Indicator
Identifying Key Levels
Support levels are indicated by green (lime) lines and resistance levels by red lines. The transparency of colors is adjustable for visual preference.
Labels display the exact price level and the percentage difference from the current price.
Strength Threshold
The "Minimum S/R Strength" parameter defines how frequently a level must be tested to be considered significant.
Higher strength values indicate zones that have been tested more frequently, suggesting stronger support or resistance.
Pivot Points
The indicator marks pivot high and low points on the chart to provide a visual representation of the calculated levels.
Dynamic Updates
The indicator adapts to the most recent price action. If the price moves above a resistance level or below a support level, the color of the lines and labels will dynamically change to reflect the current price positioning.
🔶 Disclaimer
Use with Caution: This indicator is provided for educational and informational purposes only and should not be considered as financial advice. Users should exercise caution and perform their own analysis before making trading decisions based on the indicator's signals.
Not Financial Advice: The information provided by this indicator does not constitute financial advice, and the creator (UAlgo) shall not be held responsible for any trading losses incurred as a result of using this indicator.
Backtesting Recommended: Traders are encouraged to backtest the indicator thoroughly on historical data before using it in live trading to assess its performance and suitability for their trading strategies.
Risk Management: Trading involves inherent risks, and users should implement proper risk management strategies, including but not limited to stop-loss orders and position sizing, to mitigate potential losses.
No Guarantees: The accuracy and reliability of the indicator's signals cannot be guaranteed, as they are based on historical price data and past performance may not be indicative of future results.

STANDARD DEVIATION INDICATOR BY WISE TRADERWISE TRADER STANDARD DEVIATION SETUP: The Ultimate Volatility and Trend Analysis Tool
Unlock the power of STANDARD DEVIATIONS like never before with the this indicator, a versatile and comprehensive tool designed for traders who seek deeper insights into market volatility, trend strength, and price action. This advanced indicator simultaneously plots three sets of customizable Deviations, each with unique settings for moving average types, standard deviations, and periods. Whether you’re a swing trader, day trader, or long-term investor, the STANDARD DEVIATION indicator provides a dynamic way to spot potential reversals, breakouts, and trend-following opportunities.
Key Features:
STANDARD DEVIATIONS Configuration : Monitor three different Bollinger Bands at the same time, allowing for multi-timeframe analysis within a single chart.
Customizable Moving Average Types: Choose from SMA, EMA, SMMA (RMA), WMA, and VWMA to calculate the basis of each band according to your preferred method.
Dynamic Standard Deviations: Set different standard deviation multipliers for each band to fine-tune sensitivity for various market conditions.
Visual Clarity: Color-coded bands with adjustable thicknesses provide a clear view of upper and lower boundaries, along with fill backgrounds to highlight price ranges effectively.
Enhanced Trend Detection: Identify potential trend continuation, consolidation, or reversal zones based on the position and interaction of price with the three bands.
Offset Adjustment: Shift the bands forward or backward to analyze future or past price movements more effectively.
Why Use Triple STANDARD DEVIATIONS ?
STANDARD DEVIATIONS are a popular choice among traders for measuring volatility and anticipating potential price movements. This indicator takes STANDARD DEVIATIONS to the next level by allowing you to customize and analyze three distinct bands simultaneously, providing an unparalleled view of market dynamics. Use it to:
Spot Volatility Expansion and Contraction: Track periods of high and low volatility as prices move toward or away from the bands.
Identify Overbought or Oversold Conditions: Monitor when prices reach extreme levels compared to historical volatility to gauge potential reversal points.
Validate Breakouts: Confirm the strength of a breakout when prices move beyond the outer bands.
Optimize Risk Management: Enhance your strategy's risk-reward ratio by dynamically adjusting stop-loss and take-profit levels based on band positions.
Ideal For:
Forex, Stocks, Cryptocurrencies, and Commodities Traders looking to enhance their technical analysis.
Scalpers and Day Traders who need rapid insights into market conditions.
Swing Traders and Long-Term Investors seeking to confirm entry and exit points.
Trend Followers and Mean Reversion Traders interested in combining both strategies for maximum profitability.
Harness the full potential of STANDARD DEVIATIONS with this multi-dimensional approach. The "STANDARD DEVIATIONS " indicator by WISE TRADER will become an essential part of your trading arsenal, helping you make more informed decisions, reduce risks, and seize profitable opportunities.
Who is WISE TRADER ?
Wise Trader is a highly skilled trader who launched his channel in 2020 during the COVID-19 pandemic, quickly building a loyal following. With thousands of paid subscribed members and over 70,000 YouTube subscribers, Wise Trader has become a trusted authority in the trading world. He is known for his ability to navigate significant events, such as the Indian elections and stock market crashes, providing his audience with valuable insights into market movements and volatility. With a deep understanding of macroeconomics and its correlation to global stock markets, Wise Trader shares informed strategies that help traders make better decisions. His content covers technical analysis, trading setups, economic indicators, and market trends, offering a comprehensive approach to understanding financial markets. The channel serves as a go-to resource for traders who want to enhance their skills and stay informed about key market developments.

Atlantean Bitcoin Weekly Market Condition - Top/Bottom BTC Overview:
The "Atlantean Bitcoin Weekly Market Condition Detector - Top/Bottom BTC" is a specialized TradingView indicator designed to identify significant turning points in the Bitcoin market on a weekly basis. By analyzing long-term and short-term moving averages across two distinct resolutions, this indicator provides traders with valuable insights into potential market bottoms and tops, as well as the initiation of bull markets.
Key Features:
Market Bottom Detection: The script uses a combination of a simple moving average (SMA) and an exponential moving average (EMA) calculated over long and short periods to identify potential market bottoms. When these conditions are met, the script signals a "Market Bottom" label on the chart, indicating a possible buying opportunity.
Bull Market Start Indicator: When the short-term EMA crosses above the long-term SMA, it signals the beginning of a bull market. This is marked by a "Bull Market Start" label on the chart, helping traders to prepare for potential market upswings.
Market Top Detection: The script identifies potential market tops by analyzing the crossunder of long and short-term moving averages. A "Market Top" label is plotted, suggesting a potential selling point.
Customizable Moving Averages Display: Users can choose to display the moving averages used for detecting market tops and bottoms, providing additional insights into market conditions.
How It Works: The indicator operates by monitoring the interactions between the specified moving averages:
Market Bottom: Detected when the long-term SMA (adjusted by a factor of 0.745) crosses over the short-term EMA.
Bull Market Start: Detected when the short-term EMA crosses above the long-term SMA.
Market Top: Detected when the long-term SMA (adjusted by a factor of 2) crosses under the short-term SMA.
These conditions are highlighted on the chart, allowing traders to visualize significant market events and make informed decisions.
Intended Use: This indicator is best used on weekly Bitcoin charts. It’s designed to provide long-term market insights rather than short-term trading signals. Traders can use this tool to identify strategic entry and exit points during major market cycles. The optional display of moving averages can further enhance understanding of market dynamics.
Originality and Utility: Unlike many other indicators, this script not only highlights traditional market tops and bottoms but also identifies the aggressive start of bull markets, offering a comprehensive view of market conditions. The unique combination of adjusted moving averages makes this script a valuable tool for long-term Bitcoin traders.
Disclaimer: The signals provided by this indicator are based on historical data and mathematical calculations. They do not guarantee future market performance. Traders should use this tool as part of a broader trading strategy and consider other factors before making trading decisions. Not financial advice.
Happy Trading!
By Atlantean

Fibonacci Retracements & Trend Following Strategy V2This Pine Script strategy generates trading signals using Fibonacci levels and trend-following indicators.
1. Strategy Summary
This strategy analyzes price movements using a combination of Fibonacci levels and trend-following indicators, providing potential trading signals. The strategy includes Fibonacci levels as well as EMA (Exponential Moving Average) and ADX (Average Directional Index) indicators.
2. Indicators and Parameters
Fibonacci Levels
Fibonacci Level 1, Level 2, Level 3, Level 4: Used as Fibonacci retracement levels. These levels are typically set at 0.236, 0.382, 0.618, and 0.786. Users can adjust these values according to their preferences.
Trend-Following Indicator
Trend Length: The period for calculating the EMA used as the trend-following indicator. For example, if set to 20, the EMA will be calculated over 20 periods.
ADX (Average Directional Index)
ADX Length: The period for calculating the ADX. ADX measures the strength of the price trend and is usually set to 14 periods.
ADX Threshold: A threshold value for the ADX. This value determines when trading signals will be activated.
3. Usage Steps
Displaying the Indicator on the Chart:
On the TradingView platform, paste the code into the Pine Editor and click the "Add to Chart" button to add it to the chart.
Analyzing the Indicators:
Fibonacci Levels: Show retracement levels of price movements. When the price reaches one of these levels, potential reversals may occur.
Trend-Following Indicator: EMAs determine the direction of the trend. Green EMA represents an uptrend, while red EMA represents a downtrend.
ADX: Measures the strength of the trend. When ADX surpasses the threshold value, it indicates a strong trend.
Trading Signals:
Long Signal: Generated when the price is above the second Fibonacci level and the trend is upward. Additionally, the ADX value must be above the set threshold.
Short Signal: Generated when the price is below the second Fibonacci level and the trend is downward. Additionally, the ADX value must be above the set threshold.
Target Prices:
Long Targets: Determines upward targets based on Fibonacci levels. These targets indicate expected prices if the price reverses from Fibonacci levels.
Short Targets: Determines downward targets based on Fibonacci levels. These targets indicate expected prices if the price reverses from Fibonacci levels.
4. Chart Displays
Trend Up (Green Line): Shows the rising EMA.
Trend Down (Red Line): Shows the falling EMA.
Fibonacci Levels (Blue Lines): Shows Fibonacci retracement levels.
Long Targets (Green Circles): Shows targets for long positions.
Short Targets (Red Circles): Shows targets for short positions.
Long Signal (Green Label): Buy signal.
Short Signal (Red Label): Sell signal.
5. Important Notes
Retracement and Target Levels: Fibonacci levels can act as potential retracement or support/resistance levels. However, they should always be used in conjunction with other technical analysis tools.
Trend and ADX: ADX is used to determine the strength of the trend. Be aware that when ADX is low, trends may be weak.
6. Example Scenarios
Example 1: If the trend is upward (green EMA) and the price is above the second Fibonacci level, you may receive a long position signal. If the ADX value is above the threshold, the signal may be stronger.
Example 2: If the trend is downward (red EMA) and the price is below the second Fibonacci level, you may receive a short position signal. If the ADX value is above the threshold, the signal may be stronger.
This updated version contains significant improvements in both technical aspects and user experience. Innovations such as ADX calculations and dynamic Fibonacci levels make the strategy more robust and flexible. The code's readability and comprehensibility have been enhanced, and errors have been corrected.
This guide will help you understand the basic operation of the strategy. It is always recommended to conduct your own research and test the strategy before using it.
GOOD LUCK. // halilvarol

Comparative Relative Strength - HongQuanTraderThis script is designed to enhance your trading strategy by comparing the current symbol with another comparative symbol. The goal is to trade a symbol only when its Relative Strength (RS) value surpasses the long moving average of the RS value, ensuring more informed and strategic trading decisions.
Default Mode
In the default mode, the RS value is calculated by simply dividing the base symbol by the comparative symbol:
RS_SIMPLE = baseSymbol / comparativeSymbol
Period Mode
When you enable the “use period” option, the script uses the RS_PERIOD equation. This mode is particularly useful for comparing multiple symbols against the same comparative symbol, with the output normalized around 1.0 for easier comparison:
RS_PERIOD = baseSymbol / baseSymbol / (comparativeSymbol / comparativeSymbol )
By leveraging these calculations, you can gain deeper insights into the relative performance of different symbols, allowing you to make more precise and confident trading decisions. Whether you’re comparing stocks, currencies, or any other assets, this script provides a robust framework for enhancing your trading strategy.

Advanced Fully Reversed Candles with Reversed IchimokuThe "Advanced Fully Reversed Candles with Reversed Ichimoku" indicator is a sophisticated tool designed for traders who seek a unique perspective on market dynamics. This innovative indicator not only reverses the traditional candlestick chart but also inverts the Ichimoku Cloud components, providing a comprehensive view of the market's inverted behavior.
Key Features:
Reversed Candlestick Chart:
The indicator recalculates the OHLC (Open, High, Low, Close) prices by reversing them along the price axis. This means that what typically would be an upward movement is displayed as a downward movement, and vice versa. This reversal provides an alternative view that can help traders identify hidden patterns and potential reversal points that might not be obvious on a standard chart.
Reversed Ichimoku Cloud:
All components of the Ichimoku Cloud indicator are recalculated based on the reversed price data. This includes:
Tenkan-sen (Conversion Line): Reversed based on the highest and lowest prices over the specified period.
Kijun-sen (Base Line): Reversed in a similar manner to the Tenkan-sen, providing a medium-term perspective on price trends.
Senkou Span A (Leading Span A): Reversed to form one boundary of the Kumo (cloud), offering insight into future support and resistance levels.
Senkou Span B (Leading Span B): Reversed to form the other boundary of the Kumo, complementing Senkou Span A.
Chikou Span (Lagging Span): Reversed and plotted backward for additional confirmation of trend direction and strength.
Dynamic Price Range Calculation:
The indicator dynamically calculates the maximum and minimum prices over the last 500 bars (or the available range if fewer bars are present). This ensures that the reversal is always based on the most relevant data, providing accurate and up-to-date visualizations.
Visual Enhancements:
The reversed candlesticks are color-coded for easy interpretation: green for upward movements and red for downward movements, based on the reversed data.
The Ichimoku Cloud is filled with semi-transparent colors to clearly distinguish between bullish and bearish conditions even in its reversed state.
Debugging Aids:
For transparency and accuracy, the indicator plots the maximum and minimum price lines used for the reversal calculations. This allows users to verify the internal workings of the indicator and ensure the reversal logic is correctly applied.
Usage:
This indicator is ideal for advanced traders and analysts who want to explore market behavior from an unconventional angle. By reversing both the candlestick chart and the Ichimoku Cloud, it provides a unique perspective that can uncover new trading opportunities and enhance market analysis.
Customization:
Users can customize the periods for the Tenkan-sen, Kijun-sen, and Senkou Span B, as well as the displacement for the Ichimoku Cloud. This flexibility allows traders to adapt the indicator to their specific trading strategies and timeframes.
Conclusion:
The "Advanced Fully Reversed Candles with Reversed Ichimoku" indicator is a powerful tool that transforms traditional market analysis. By inverting both price movements and key technical indicators, it opens up a new dimension of trading insights, helping traders to see the market in a completely different light.
Parameters:
Tenkan-sen period (default: 9)
Kijun-sen period (default: 26)
Senkou Span B period (default: 52)
Displacement (default: 26)
How to Apply:
Add the script to your TradingView account via the Pine Editor.
Customize the parameters according to your trading strategy.
Analyze the reversed candlestick chart and Ichimoku Cloud to gain unique insights into market trends and potential reversal points.
