Chaikin Money Flow & Volatility Duo +Discover the Ultimate Edge in Trading: Chaikin Money Flow & Volatility Duo + (CMV_Duo +)
Tired of indicators that lag behind the action or give you vague, conflicting signals? Say hello to Chaikin Money Flow & Volatility Duo + – the powerful, all-in-one oscillator that combines the legendary insights of Marc Chaikin with smart, high-conviction filtering to pinpoint where the real money is flowing.
This isn't just another CMF script. This is the enhanced, next-level version designed for traders who demand precision and clarity.
Why CMV_Duo + Will Become Your Go-To Indicator
Crystal-Clear Money Flow Insight
Tracks Chaikin Money Flow (CMF) with a customizable period (default 21) and adds a smooth EMA signal line (default 9) for cleaner trend confirmation.
Beautiful momentum-colored histogram:
Bright green when accumulation is accelerating
Bright red when distribution is intensifying
Softer shades when momentum is fading – you’ll spot weakening trends instantly.
Volatility That Actually Matters
Built-in Chaikin Volatility measures the rate of change in price range expansion.
Rising volatility (CV > 0) tells you the move has legs – no more getting faked out by quiet, low-conviction grinding.
"Smart Money" Conviction Signals – The Real Game-Changer
Exclusive background highlighting and entry markers that only fire when three powerful forces align:
Strong positive/negative CMF
CMF decisively above/below its signal line
Rising volatility confirming real momentum
These rare, high-probability zones light up your chart with subtle green/red backgrounds and precise triangle markers – showing you exactly where institutional "smart money" is likely stepping in with conviction.
Multiple Ways to Trade It
Classic CMF/signal line crossovers (optional circles)
Smart Money conviction entries (the ones serious traders live by)
Visual reference levels at ±0.2 for strong accumulation/distribution zones
Fully Loaded Alerts
Instant notifications for Bullish/Bearish Smart Money phases
CMF bullish/bearish crossovers
Never miss the moments that move markets.
Perfect For:
Swing traders hunting high-probability reversals
Day traders filtering noise for stronger entries
Anyone who wants to see institutional accumulation/distribution in real time
Clean, non-repainting, lightweight, and overlay-free – it sits beautifully in a separate pane and plays nicely with your existing setup.
Stop guessing where the big money is going. Let Chaikin Money Flow & Volatility Duo + show you – clearly, confidently, and with conviction.
Add it to your chart today and start trading like the smart money does. You’ll wonder how you ever traded without it.
🔶 RISK DISCLAIMER
Trading is risky & most day traders lose money. All content, tools, scripts, articles, & education provided by TheAmericanBastard are purely for informational & educational purposes only. Past performance does not guarantee future results.
Overview of Chaikin Money Flow & Volatility Duo + (CMV_Duo +)
The Chaikin Money Flow & Volatility Duo + is a custom technical indicator built in Pine Script® version 6 for TradingView. It combines two classic metrics from Marc Chaikin—Chaikin Money Flow (CMF) and Chaikin Volatility (CV)—into a single, non-overlay oscillator panel. The goal is to provide insights into accumulation/distribution (via CMF) while filtering for high-conviction moves using volatility (CV). It enhances standard CMF with a signal line, momentum-based coloring, and "Smart Money" signals that highlight potential institutional entry points during rising volatility.
The indicator operates on historical price and volume data from the chart's symbol. It doesn't overlay on the price chart but appears in a separate pane below it. Key features include customizable periods, visual cues like colored histograms and backgrounds, entry signals, and alerts. Below, I'll break it down step by step, referencing the code's logic and calculations.
1. User Inputs and Configuration
The indicator starts with customizable inputs grouped for ease of use in TradingView's settings panel:
Chaikin Money Flow Group:
cmfLen: Integer input for the CMF lookback period (default: 21). This determines how many bars are used to average the money flow.
sigLen: Integer input for the CMF signal line length (default: 9). This smooths the CMF for trend confirmation.
Chaikin Volatility Group:
cvLen: Integer input for smoothing the high-low range (default: 10). Uses an EMA on (high - low).
cvRocLen: Integer input for the Rate of Change (ROC) period on the smoothed range (default: 10).
Visuals Group:
showSmart: Boolean to toggle "Smart Money" entry shapes (default: true).
showCross: Boolean to toggle CMF crossover shapes (default: false).
These inputs allow users to adapt the indicator to different timeframes or assets (e.g., shorter periods for intraday trading).
2. Chaikin Money Flow (CMF) Calculation
CMF measures buying/selling pressure by weighting volume based on where the price closes within the bar's range. It's an oscillator ranging roughly from -1 to +1, where positive values indicate accumulation (buying) and negative values indicate distribution (selling).
The code computes it as follows:
Money Flow Multiplier (MFM):$ NYSE:MFM = \frac{(Close - Low) - (High - Close)}{High - Low}$$
This simplifies to $\frac{2 \cdot Close - High - Low}{High - Low}$, but the code uses the expanded form: (close - low - (high - close)) / (high - low).
MFM is +1 if close is at the high (strong buying), -1 if at the low (strong selling), and 0 if in the middle.
Money Flow Volume (MFV):$ SEED_ALEXDRAYM_SHORTINTEREST2:MFV = MFM \times Volume$$
Scales the multiplier by the bar's volume to emphasize high-volume moves.
CMF:$ AMEX:CMF = \frac{\sum_{i=1}^{cmfLen} MFV_i}{\sum_{i=1}^{cmfLen} Volume_i}$$
Uses ta.sma(mfv, cmfLen) for the numerator (simple moving average of MFV) and ta.sma(volume, cmfLen) for the denominator.
Result: A smoothed ratio showing net money flow over the period.
CMF Signal Line:$$CMF_{Sig} = EMA(CMF, sigLen)$$
An exponential moving average (EMA) of the CMF for a smoother "signal" line, similar to MACD's signal. This helps identify crossovers and trends.
CMF above 0 suggests net buying pressure; below 0 suggests selling. Levels like +0.2/-0.2 (plotted as dashed lines) indicate "strong" accumulation/distribution.
3. Chaikin Volatility (CV) Calculation
CV quantifies volatility by measuring the rate of change in the price range (high - low), smoothed to reduce noise. It's useful for confirming if a move has momentum—rising volatility often accompanies trend starts or breakdowns.
Smoothed High-Low Range:$$HL_{EMA} = EMA(High - Low, cvLen)$$
Applies an EMA to the bar's range for a stable baseline.
Chaikin Volatility (CV):$ NASDAQ:CV = ROC(HL_{EMA}, cvRocLen) = \frac{HL_{EMA} - HL_{EMA} }{HL_{EMA} } \times 100$$
Uses ta.roc(hl_ema, cvRocLen), which computes the percentage change over the period.
Positive CV means expanding ranges (increasing volatility, potential trend acceleration); negative means contracting ranges (decreasing volatility, potential consolidation).
For visualization, CV is scaled by dividing by 200 (cv_scaled = cv / 200) to fit neatly alongside CMF on the same scale, though they have different units. It's plotted as a line: red for positive (rising volatility), blue for negative.
4. Visual Elements
The indicator emphasizes intuitive visuals to make interpretation quick:
CMF Histogram:
Plotted as columns (plot.style_columns).
Color Logic (momentum-based):
If CMF ≥ 0 (accumulation):
Bright green (#26A69A) if rising (cmf > cmf ).
Pale green (#B2DFDB) if falling.
If CMF < 0 (distribution):
Bright red (#EF5350) if falling (cmf < cmf ).
Pale red (#FFCDD2) if rising.
This coloring highlights accelerating vs. decelerating trends.
CMF Signal Line:
Thin orange line (color.orange, linewidth 1) for easy comparison with the histogram.
CV Line:
Thicker line (linewidth 2), red for CV > 0 (expanding volatility), blue for CV < 0.
Reference Lines:
Dotted gray zero line (hline(0)).
Dashed green +0.2 for strong accumulation.
Dashed red -0.2 for strong distribution.
These elements create a clean, glanceable pane where CMF's direction and strength are obvious, augmented by CV's volatility context.
5. "Smart Money" Conviction Signals
This is the indicator's unique enhancement: It filters CMF signals with CV to identify "high-conviction" zones where smart money (e.g., institutions) might be entering.
Bullish Conviction Condition:$$bull_conviction = (CMF > 0) \land (CMF > CMF_{Sig}) \land (CV > 0)$$
CMF positive and above signal (strong buying), plus rising volatility (move has energy).
Bearish Conviction Condition:$$bear_conviction = (CMF < 0) \land (CMF < CMF_{Sig}) \land (CV > 0)$$
CMF negative and below signal (strong selling), plus rising volatility.
Background Highlighting:
Light green background (color.new(color.green, 90)) for bullish conviction.
Light red background for bearish.
Only appears when conditions are true, highlighting sustained phases.
Entry Shapes (if showSmart is true):
Triggers only on the first bar the condition becomes true (bull_entry = bull_conviction and not bull_conviction ).
Green upward triangle at bottom for bullish entry.
Red downward triangle at top for bearish entry.
Small size, no offset, for precise marking.
These signals aim to catch the start of high-probability moves, reducing false positives from low-volatility chop.
6. CMF Crossover Signals
Optional classic signals based on CMF crossing its signal line (if showCross is true):
Bullish Crossover: cross_bull = ta.crossover(cmf, cmfSig) (CMF crosses above signal).
Lime circle at bottom.
Bearish Crossunder: cross_bear = ta.crossunder(cmf, cmfSig) (CMF crosses below signal).
Maroon circle at top.
These are simpler momentum signals, without the volatility filter.
7. Alerts
The indicator includes four alert conditions for TradingView notifications:
Bullish Smart Money: Triggers on bull_conviction (message: "CMF Positive + Rising Volatility").
Bearish Smart Money: Triggers on bear_conviction (message: "CMF Negative + Rising Volatility").
CMF Bullish Crossover: Triggers on CMF > signal (message: "CMF Crossed above Signal").
CMF Bearish Crossunder: Triggers on CMF < signal (message: "CMF Crossed below Signal").
Users can set these up in TradingView to get real-time alerts via email, SMS, etc.
Practical Usage and Interpretation
Timeframe Agnostic: Works on any chart timeframe, but tune periods (e.g., shorter for crypto volatility).
Strengths: Combines flow with volatility to filter noise; Smart Money signals are rare but high-quality.
Limitations: Like all oscillators, it can lag in strong trends or whipsaw in ranges. Always use with price action or other confirmations.
Non-Repainting: All calculations use historical data only—no forward-looking elements.
This indicator empowers traders to spot where volume-weighted pressure aligns with expanding volatility, potentially signaling smart money involvement. If you're implementing it, copy the code into TradingView's Pine Editor and apply it to a chart for hands-on testing!
Chaikin Volatilitesi

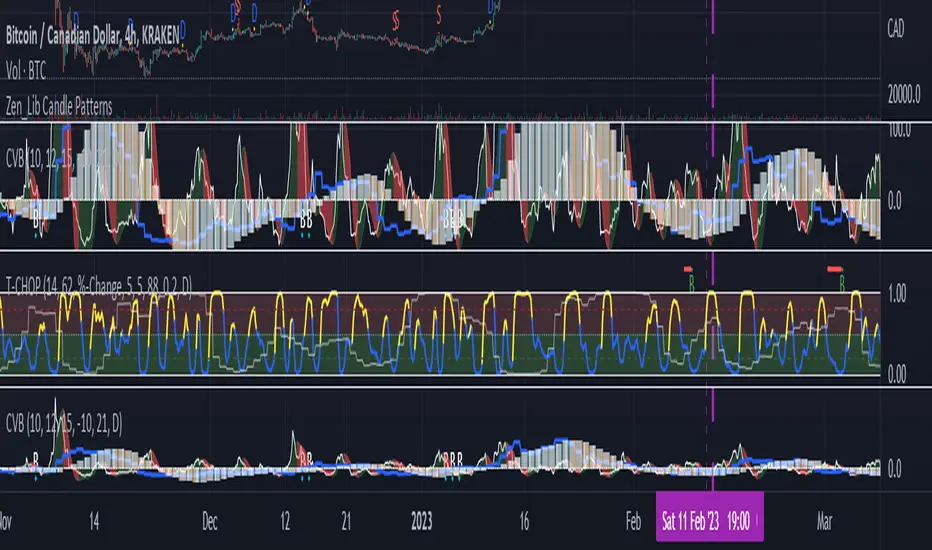
JZ_Chaikin HTF Volatility BreakoutFirst off, all credit to Harry Potter as this is a minor customization of his indicator.
Basic additions:
-- Added a Higher Timeframe that is set to Daily but can be changed. Timeframe does wait until barstate.isconfirmed so won't repaint.
-- Added HMA smoothing line to both Chart and HTF. Can be used as it's own signal, as confirmation or in combination with faster signal line -- Breakout signal & Range Highlight use both.
-- Added optional coloring of HMA based on whether increasing or decreasing.
-- Added a low volatility option that highlights Range/No Trade zones. Defval is off so needs to be selected from inputs.
Breakout Signals are very simple and both take the HTF signal and HMA. When the faster Volatility line rises from below zero and comes within the range of -10 to 0, AND the HMA signals is increasing (and also below zero) for confirmation, generates a breakout signal of an incoming big move. You can alter the breakout threshold to be greater or less than -10, I just found that works best for filtering out the noise and false signals. Won't catch everything, but pretty reliable when it does.
Tested mostly on BTC so can't vouch for other assets and would likely need modification.
I've JUST taught myself coding from scratch (and to say I'm an amateur is an understatement), so apologies in advance if anything is unclear or could be coded better. Open to any suggestions.
Volatility BandsWe used Marc Chaikin’s Chaikin Volatility as somewhat of a baseline for this indicator and then built on it. Like Chaikin Volatility, our indicator draws primarily upon high-low spreads to quantify a security’s volatility. It also has similarities to Keltner Channels as it uses ATR rather than standard deviations in its calculation of the different bands.
Inputs:
int ‘len0’, lookback window for fast EMA of high-low ranges.
int ‘len1’, lookback window for slow EMA of high-low ranges.
int ‘len2’, lookback window for slow EMA of closing prices.
float ‘m0’, ATR multiplier for first upper and lower volatility bands.
float ‘m1’, ATR multiplier for second upper and lower volatility bands.
float ‘m2’, ATR multiplier for third upper and lower volatility bands.
int ‘lenATR’, window length for ATR calculation.
Output: 3 Upper and Lower Volatility Bands (6 total).
1. Compute High Low Spread for current period.
hlr = (high – low)
2. Calculate Exponential Moving Average of HLR at length len0
fastEMA = ema(hlr, len0)
3. Calculate Exponential Moving average of HLR at length len1 (where len1 > len0)
slowEMA = ema(hlr, len1)
4. Get EMA of closing prices at length len2(where len2 > len1 and len1 > len0)
priceEMA = ema(close, len2)
5. Use adjusted Chaikin Volatility Formula to quantify volatility
v = (fastEMA – slowEMA) / slowEMA
6. Calculate three upper and three lower volatility bands (6 total):
ex:
upper0 = priceEMA + ((1 – cv) * (atrMult0 * atr(lenATR)))
lower0 = priceEMA – ((1 – cv) * (atrMult0 * atr(lenATR)))
One possible way to use this indicator is to enter a long position when the security’s price falls below the lowest volatility band and then exit when it crosses above the third upper band. This seems to get the best results for quick, high frequency trading. Another approach is to enter a position when the bands begin to break out from a compact state and the width between them increases.
Still tweaking the idea, so any feedback would be appreciated.

Chaikin Volatility Strategy With Negative Trigger AllowedSame like Chaikin Volatility Strategy, but allows negative value of Trigger

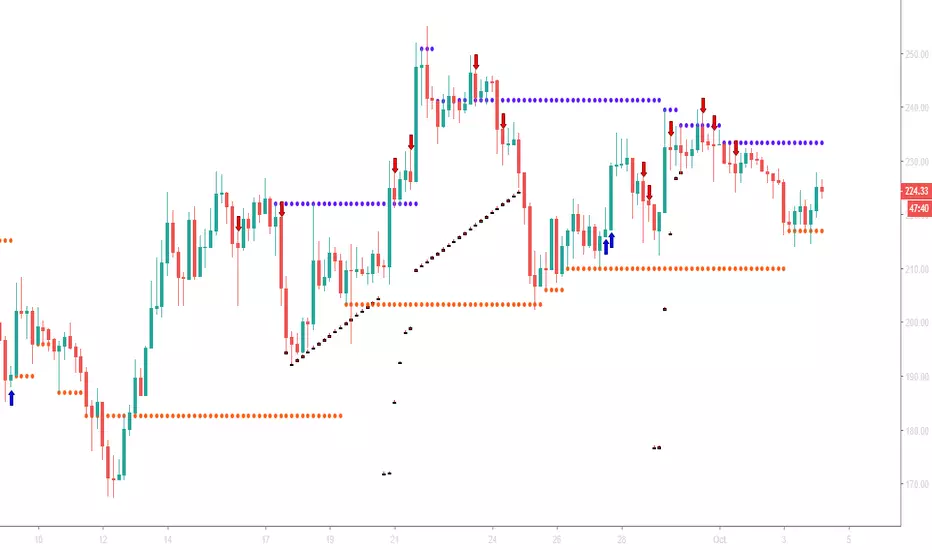
TradeMiner S9This is the first TradingView indicator EVER to include dynamic support and resistance lines from upper or lower diagonal highs and lows in real-time.
Note: This indicator has been built using Pinescript V2
Like and Share for access and more awesome indicators!
A blue arrow appears only in a red bar and under these conditions:
Closing Score Trigger (CS < 50)
On Balance Volume, Accumulation/Distribution, and Chaikin Money Flow Combination (OBV/AD /CMF > 0)
Chaikin Money Flow (CMF <-0.05)
A blue horizontal line will be drawn when CMF > 0.05 indicates a sale of the position.
A red arrow appears only in a green bar and under these conditions:
Closing Score Trigger (CS > 50)
On Balance Volume, Accumulation/Distribution, and Chaikin Money Flow Combination (OBV/AD/CMF < 0)
Chaikin Money Flow (CMF > 0.05)
A red horizontal line will be drawn when CMF <-0.05 indicates a sale of the position.
A new condition called " leaniency " has been added that allows all these conditions to be fulfilled within multiple bars so that the occurrence occurs more frequently. This will result in more signals appearing. Setting leniency to " 1 " means that all four conditions must occur in a single bar, while " 5 " means that all four conditions must occur within 5 bars.
Find lifetime access to the indicator here: www.kenzing.com
BTC
OPBNothing here for you to see. Hey! What was that over there? Was that a bird or something? Nope.. still nothing to see here.

Chaikin Volatility Strategy Backtest Chaikin's Volatility indicator compares the spread between a security's
high and low prices. It quantifies volatility as a widening of the range
between the high and the low price.
You can use in the xPrice1 and xPrice2 any series: Open, High, Low, Close, HL2,
HLC3, OHLC4 and ect...
You can change long to short in the Input Settings
Please, use it only for learning or paper trading. Do not for real trading.

Chaikin Volatility StrategyChaikin's Volatility indicator compares the spread between a security's
high and low prices. It quantifies volatility as a widening of the range
between the high and the low price.
You can use in the xPrice1 and xPrice2 any series: Open, High, Low, Close, HL2,
HLC3, OHLC4 and ect...

Chaikin Volatility Chaikin's Volatility indicator compares the spread between a security's
high and low prices. It quantifies volatility as a widening of the range
between the high and the low price.
You can use in the xPrice1 and xPrice2 any series: Open, High, Low, Close, HL2,
HLC3, OHLC4 and ect...
