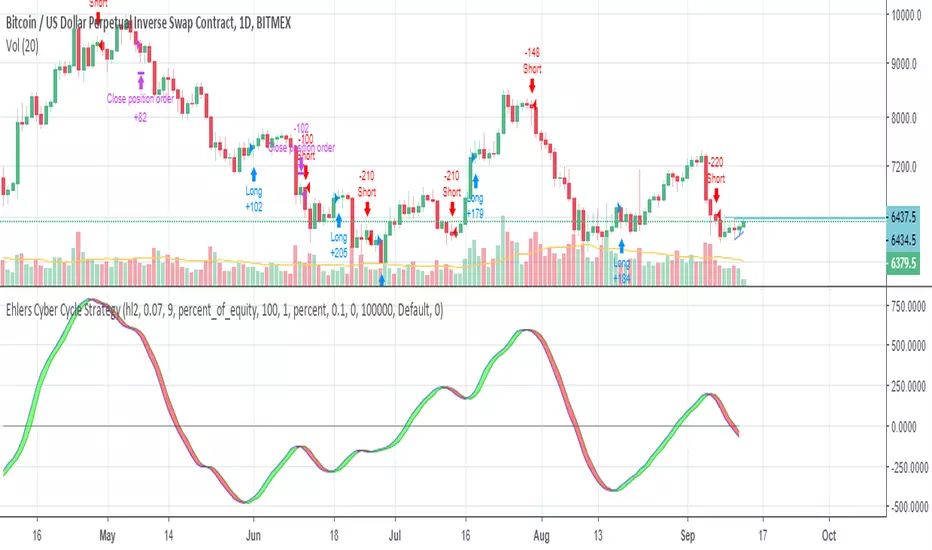
Ehlers Cyber Cycle StrategyEhlers Cyber Cycle Strategy by John Ehlers from his book "Cybernetic Analysis for Stocks and Futures".
Ortalanmış Osilatörler
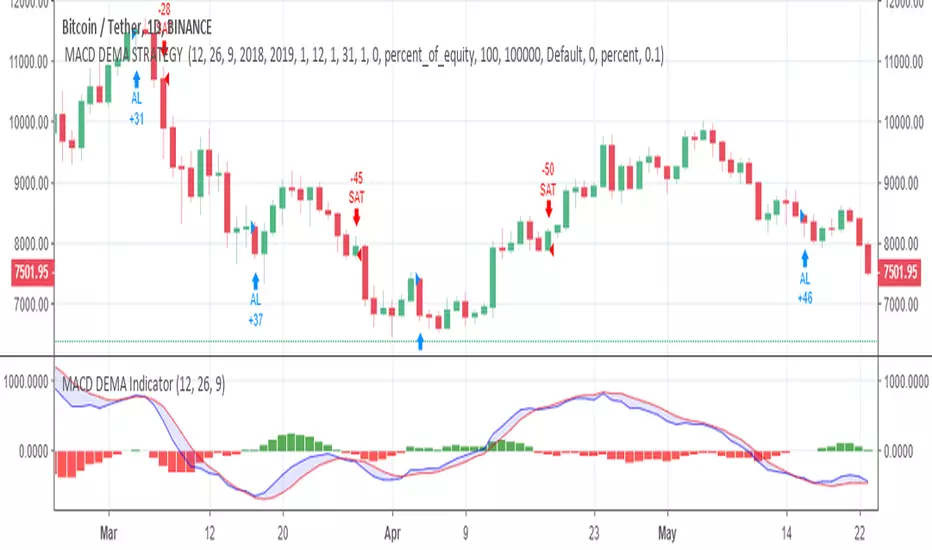
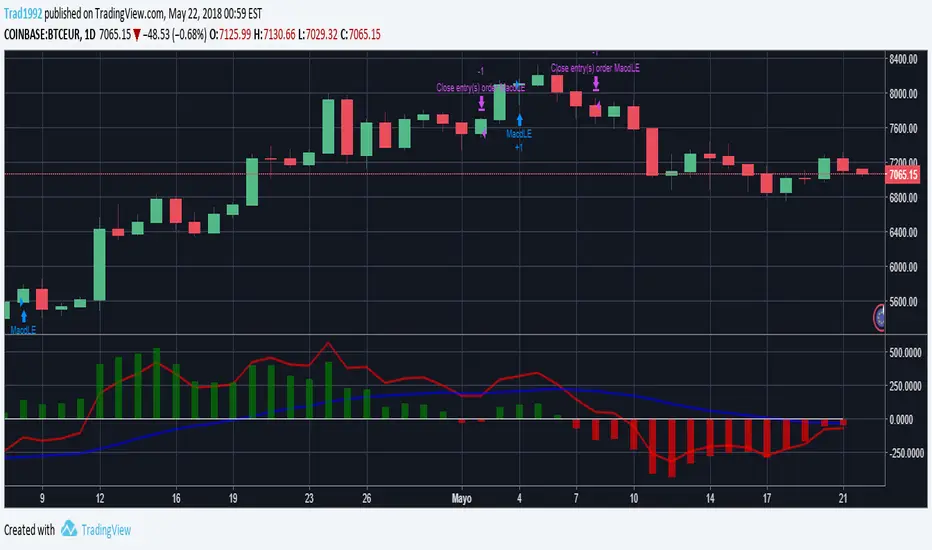
MACD DEMA STRATEGY A strategy based on ToFFF MACD DEMA indicator
Even so , ı dont recommended using MACD DEMA alone.
Combine its code with your favorite indicators.
You can visit ToFFF's indicator :
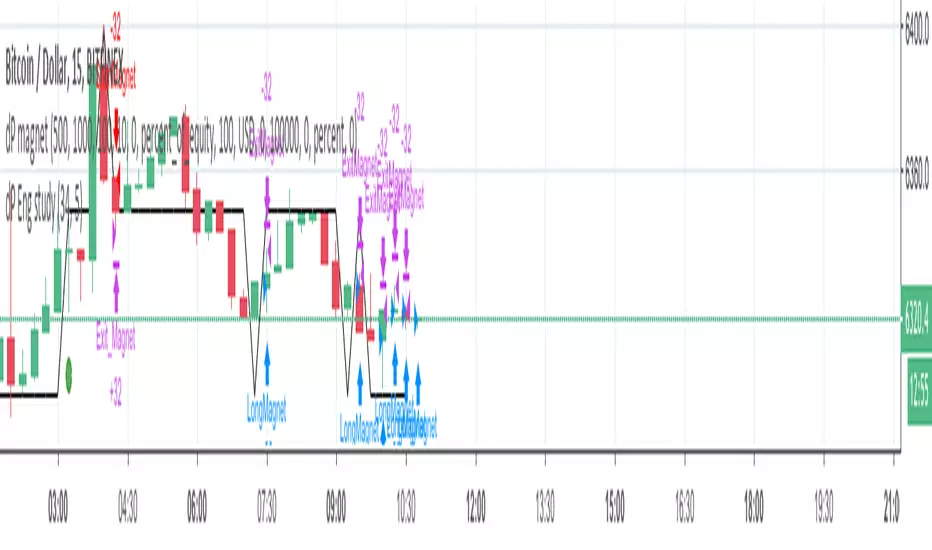
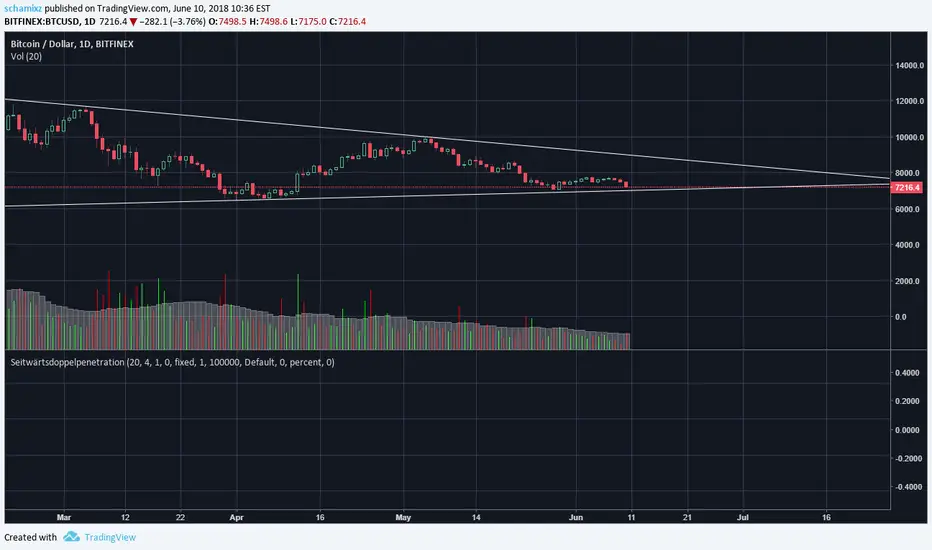
dP magnet//Strategy based on the idea that stop loss and take profit are often placed at full price levels or round numbers, whcih acts as resistance and supports levels
//Buy Rules:
//Actual price (close) is above round number.
//Round number level was not touched in previous ten bars (arbitrary value).
//Place a buy and follow the order with a trail step because price can bounce at round number (support) or can go through it.
//Sell Rules are the same of buy rules but inverted.
//
//Need improvement on conditions' logic and round numbers definitions
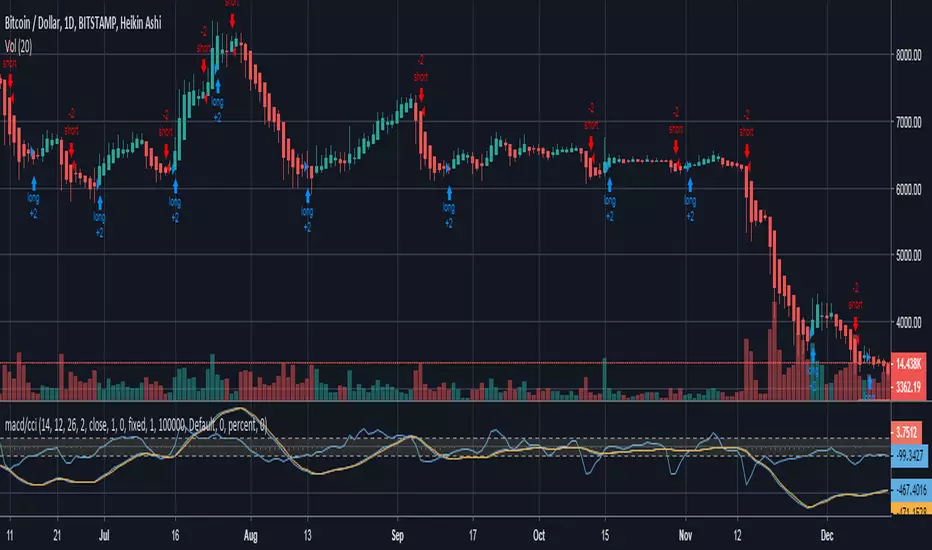
MACD+CCI Strategya simple strategy based on Joseph Nemeth MACD+CCI strategy
Reference reading: sites.google.com
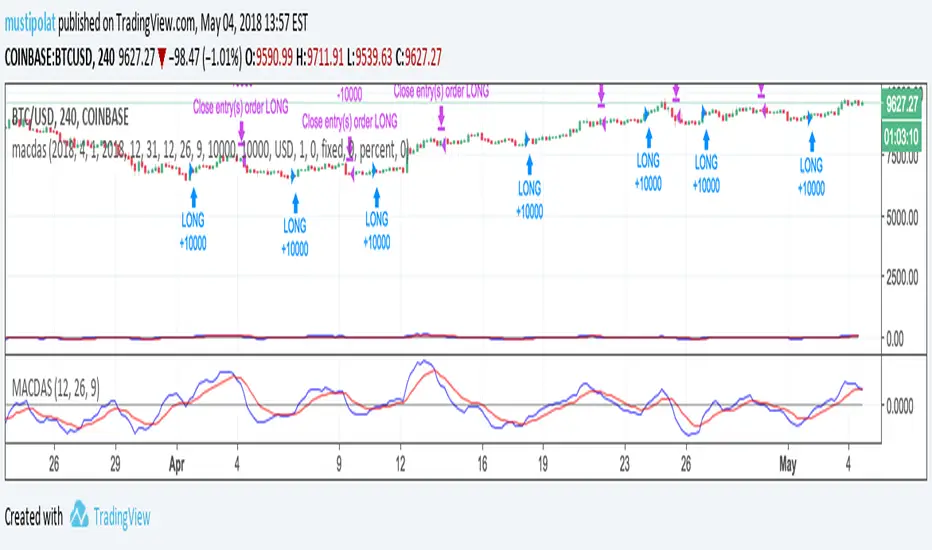
Moving Average Convergence/Divergence MaCD BackestingMade this to backtest simple macd trading strategy, had to set it to open long and short positions because i'm not sure how you get it to calculate otherwise.
TrapTradingBuy on dips and sell into rallies. Simple as that.
- Short line (green)
- Base line (white)
- Long line (red)
When the market price touches the white or the red(green) lines, buy(sell) orders are generated.
The exit points are 2 lines above(below) the entries.
Parameters
- Period: It affects the value of Base line and the spacing of each line.
- Multiple: Specify the spacing between each line.

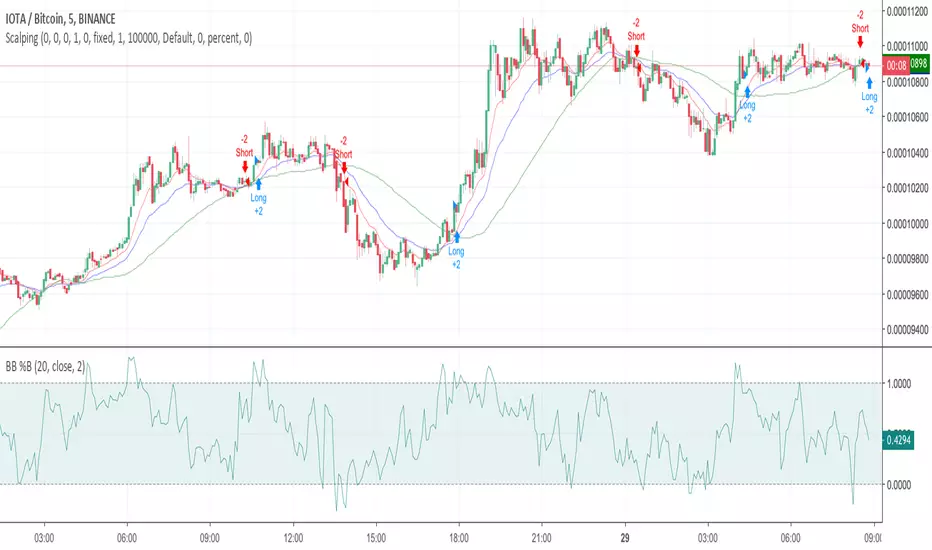
BB%/MFI/RSIThe indicator was made by a bear. I have made strategy which uses this indicator.
For any pair.

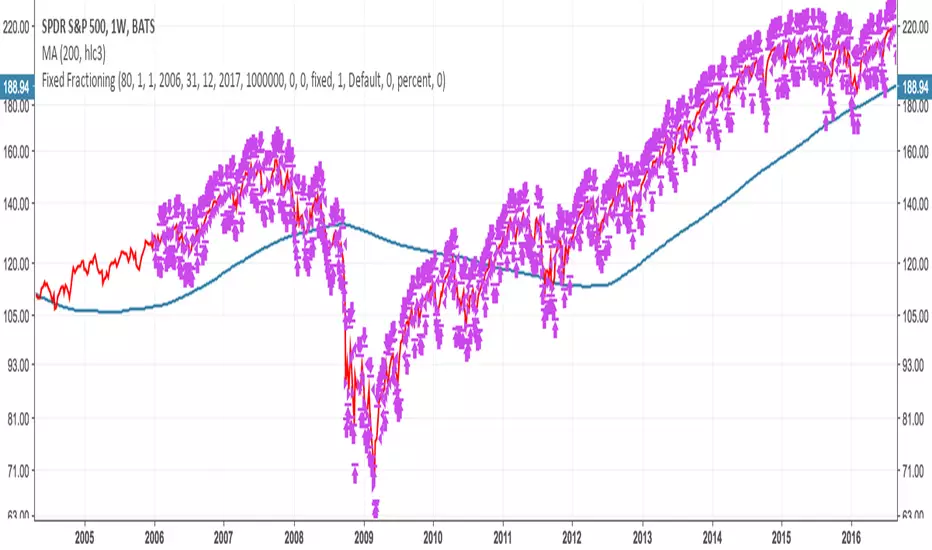
basic fixed fraction strategyOne of the most common trading strategy is to invest a certain percentage in an asset, and keep the percentage fixed. For example you invest 2% in a stock, and as the value goes up you sell. And as the value goes down you buy. Always trying to keep the value of how much you have invested in that asset at 2%.
This works very well with assets that are stable. If you have something that fluctuates around a value, you will find yourself that each time it has gone back to the value in which you entered, you have actually gained something. With an asset that grows it also works. But in general you might find that more aggressive investments are more profitable. On the other side if there is a bubble, and you invest from the beginning using this strategy you will find yourself at the end of the bubble having gained something. Not as much as having bought all at the beginning and having sold all at the end, but still you will have sold going up, and bought going down. Plus you will have gained in the fluctuation.
Where is instead very dangerous is in stock and assets that go to zero. This because you might invest just 2% in an investment. But then as the strategy works you keep investing more as you are trying to keep 2%. You basically can lose all your money in this way (like if you were invested 100% in an asset). Very dangerous. This is why you should only use this with assets that you are sure cannot go to zero (an ETF on S & P 500 could be a good example).
So I coded this strategy on TradingView. basically it will ask you what percentage you want to invest. Then starts with entering with an order of that amount, and will then keep sitself at the same percentage. The system is discrete, as it can only buy a discrete number of contract.
Note that if you use this for cryptocurrency (where you can buy a fraction of a coin, like 0.01 btc) then you should multiply the money that you have by 10, 100, 1000 ... depending on how many digits after the comma your exchange permit you to trade.
If you are using this for forex or crypto it is quite easy that the number of order will explode. As such I added the date range taken from Allanster great script
One way to use Fixed Fractioning is to calculate the Kelly Index of an asset (which will give you a percentage), and then invest half or a quarter of the kelly in that coin, and then keep this fixed.
Another way (which goes well beyond what this script can do alone) to use the Fixed Fractioning is, if you have two assets that are anticorrelated (has a negative correlation), then investing a certain percentage of your capital in one and another percentage in another. And then each time one goes up (and the other goes down) you sell the one that is going up, and buy the one that is going down to keep the percentages fixed.
Something else, it is pretty common for people to invest around 80% of their money in an ETF that follows tha S&P500. This is why here we use 80%. Generally I have seen a more common investment strategy to be around 2%.
As everybody says: I am not responsible for your money. Study before investing.


[STRATEGY]Kagi Emulator OCC & SLTP V3It is a Kagi candle emulator without resolution multiplier.
Also with take profit and stop loss.
Modify the value of "reversal" according to current symbol.
It's the backtest, coming soon, same script but with no-repainting alerts
Enjoy!

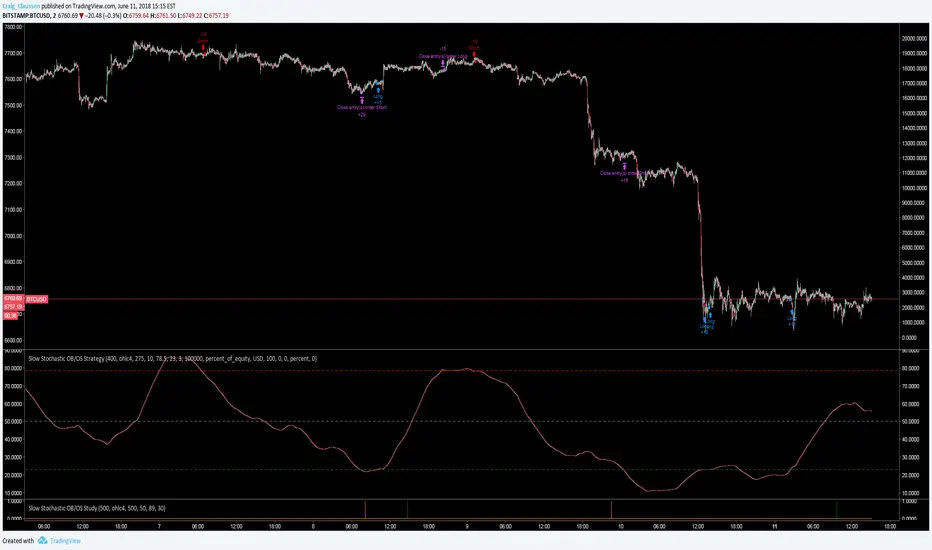
Slow Stochastic OB/OS StrategySame concept as my Slow RSI strategy script
But in Stoch format
I'm finding that i like Slow Stoch better than Slow RSi
This chart also includes exit guards.
It's up to you to decide if you want to pyramid or not. This chart is set at pyramid = 3
Dynamic Momentum Index (DMI) Backtest This indicator plots Dynamic Momentum Index indicator. The Dynamic Momentum
Index (DMI) was developed by Tushar Chande and Stanley Kroll. The indicator
is covered in detail in their book The New Technical Trader.
The DMI is identical to Welles Wilder`s Relative Strength Index except the
number of periods is variable rather than fixed. The variability of the time
periods used in the DMI is controlled by the recent volatility of prices.
The more volatile the prices, the more sensitive the DMI is to price changes.
In other words, the DMI will use more time periods during quiet markets, and
less during active markets. The maximum time periods the DMI can reach is 30
and the minimum is 3. This calculation method is similar to the Variable
Moving Average, also developed by Tushar Chande.
The advantage of using a variable length time period when calculating the RSI
is that it overcomes the negative effects of smoothing, which often obscure short-term moves.
The volatility index used in controlling the time periods in the DMI is based
on a calculation using a five period standard deviation and a ten period average
of the standard deviation.
You can change long to short in the Input Settings
WARNING:
- For purpose educate only
- This script to change bars colors.

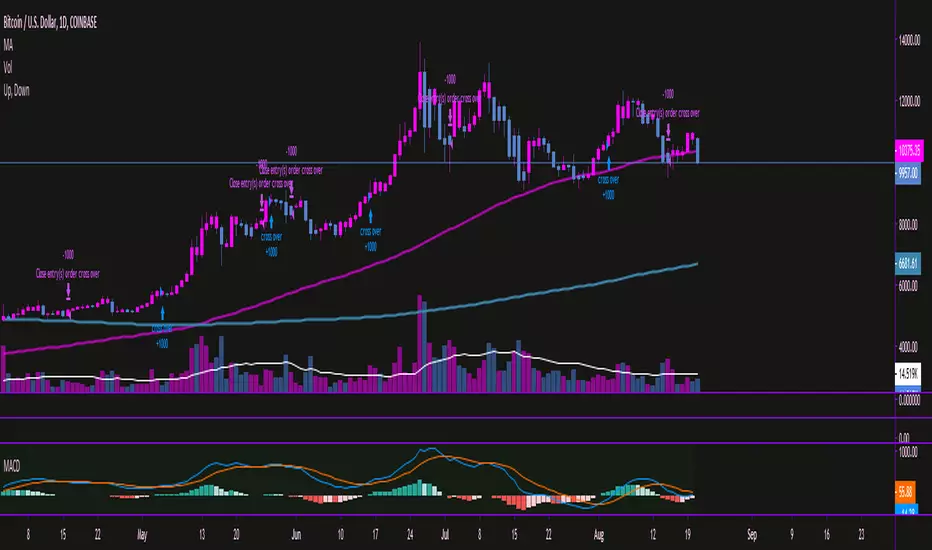
MACD+EMA crossovers Strategy customIt is a Strategy to use EMA crossover and MACD to decide when "buy" and when "sell", the key is spend some time "tuning" the parameters and using the simulation tool to find the best parameters for EMA and MACD there are 6 parameters, but with Excel and patience you could find the best configuration for the past and apply it to the future and see.

MACD Strategy custom for cryptosIt is a MACD with strategy simulation implemented to "tune" the MACD parameters for cryptos, it only use long and close strategy, not short
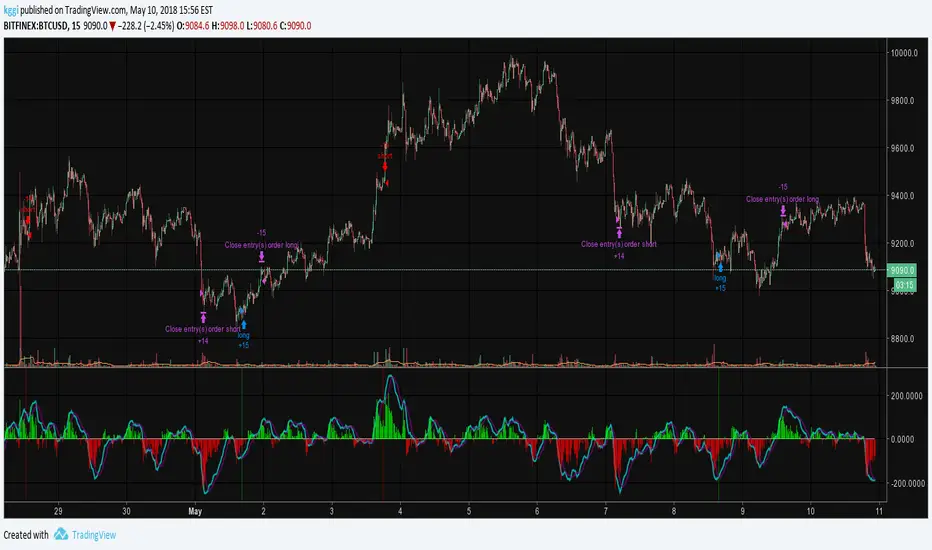
EMA50Diff & MACD StrategyOne of my attempts to create a strategy for BTC.
Its a combination of EMA50Diff (the difference between spot and EMA50) and MACD.
Buy signal if (EMA50Diff) < -(EMADiffThreshold),
(MACD bearish crossunder),
(MACD) < -(MACDThreshold),
(EMA50Diff) > (EMA50Diff 1 candle ago),
(EMA50Diff 1 candle ago) < (EMA50Diff 2 candles ago)
Sell signal if (EMA50Diff) > (EMADiffThreshold),
(MACD bullish crossover),
(MACD) > (MACDThreshold),
(EMA50Diff) < (EMA50Diff 1 candle ago),
(EMA50Diff 1 candle ago) > (EMA50Diff 2 candles ago)
Exit either when target or stoploss get reached.
Initial capital is set to 100k and its currently going all-in on every trade but im looking for a better way to handle position sizes already..
Also i included slippage of 30 ticks and exchange commission of 0.15% (e.g. 2x BitMEX market taker fee)
Works best on 15m on bitfinex, bitstamp and gdax and i'm still trying to optimize it for bitmex too, will update when i got there..
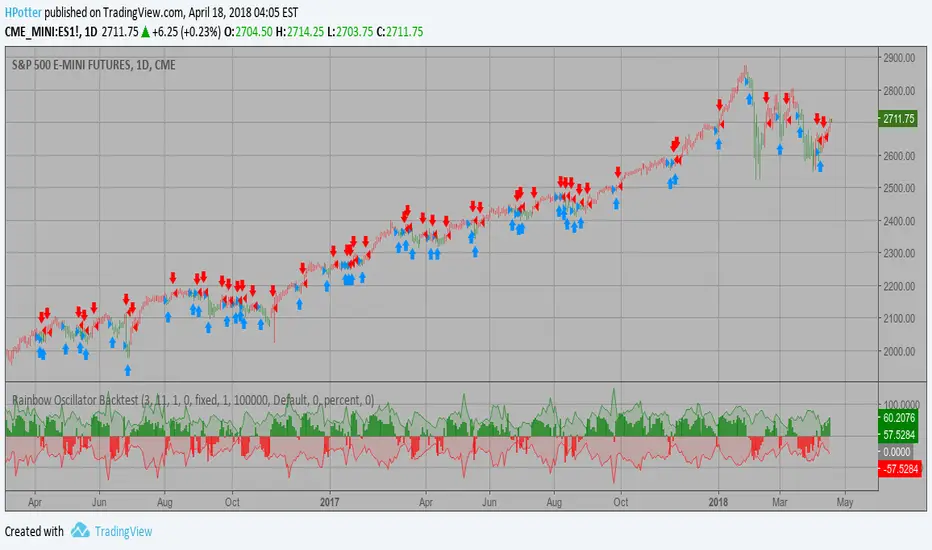
Rainbow Oscillator Backtest Ever since the people concluded that stock market price movements are not
random or chaotic, but follow specific trends that can be forecasted, they
tried to develop different tools or procedures that could help them identify
those trends. And one of those financial indicators is the Rainbow Oscillator
Indicator. The Rainbow Oscillator Indicator is relatively new, originally
introduced in 1997, and it is used to forecast the changes of trend direction.
As market prices go up and down, the oscillator appears as a direction of the
trend, but also as the safety of the market and the depth of that trend. As
the rainbow grows in width, the current trend gives signs of continuity, and
if the value of the oscillator goes beyond 80, the market becomes more and more
unstable, being prone to a sudden reversal. When prices move towards the rainbow
and the oscillator becomes more and more flat, the market tends to remain more
stable and the bandwidth decreases. Still, if the oscillator value goes below 20,
the market is again, prone to sudden reversals. The safest bandwidth value where
the market is stable is between 20 and 80, in the Rainbow Oscillator indicator value.
The depth a certain price has on a chart and into the rainbow can be used to judge
the strength of the move.
You can change long to short in the Input Settings
WARNING:
- For purpose educate only
- This script to change bars colors.
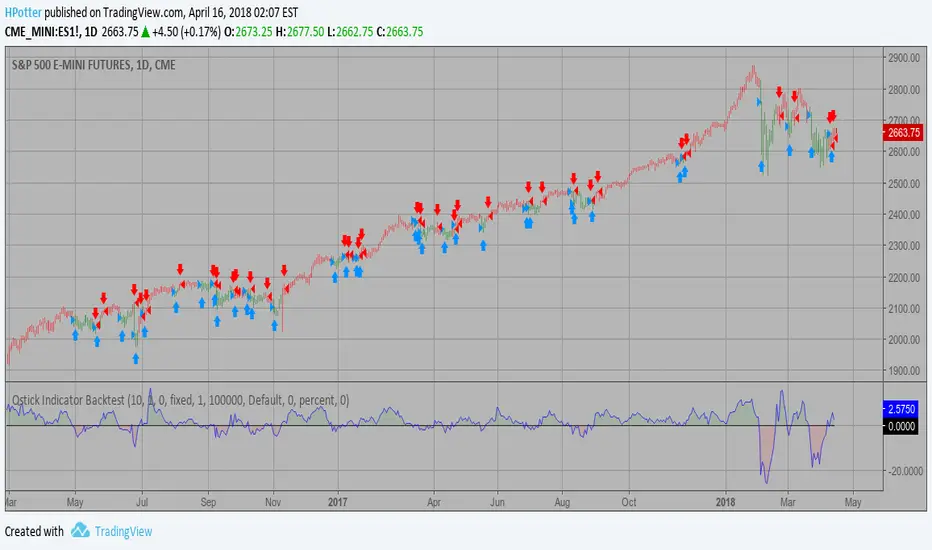
Qstick Indicator Backtest A technical indicator developed by Tushar Chande to numerically identify
trends in candlestick charting. It is calculated by taking an 'n' period
moving average of the difference between the open and closing prices. A
Qstick value greater than zero means that the majority of the last 'n' days
have been up, indicating that buying pressure has been increasing.
Transaction signals come from when the Qstick indicator crosses through the
zero line. Crossing above zero is used as the entry signal because it is indicating
that buying pressure is increasing, while sell signals come from the indicator
crossing down through zero. In addition, an 'n' period moving average of the Qstick
values can be drawn to act as a signal line. Transaction signals are then generated
when the Qstick value crosses through the trigger line.
You can change long to short in the Input Settings
WARNING:
- For purpose educate only
- This script to change bars colors.
Riz Coloured MACDThis is a souped up common or garden MACD . The Histogram is coloured giving a clear visual representation of where we are UpTicking or DownTicking on the Histogram to help support trading decisions.
When colour changes from pink to green market is bullish , and visa versa.
Very useful as a supporting indicator to confirm other strategies, or even as a standalone strategy to some extent.
Alerts are enabled by converting script from a Strategy to a Study, see comments in code.

Psychological line Backtest Psychological line (PSY), as an indicator, is the ratio of the number of
rising periods over the total number of periods. It reflects the buying
power in relation to the selling power.
If PSY is above 50%, it indicates that buyers are in control. Likewise,
if it is below 50%, it indicates the sellers are in control. If the PSY
moves along the 50% area, it indicates balance between the buyers and
sellers and therefore there is no direction movement for the market.
You can change long to short in the Input Settings
WARNING:
- For purpose educate only
- This script to change bars colors.
